. 2015 Jul 9;6(7):e1813.
doi: 10.1038/cddis.2015.186.

Single-cell imaging of inflammatory caspase dimerization reveals differential recruitment to inflammasomes

Affiliations

Single-cell imaging of inflammatory caspase dimerization reveals differential recruitment to inflammasomes

M G Sanders et al. Cell Death Dis. .

Abstract

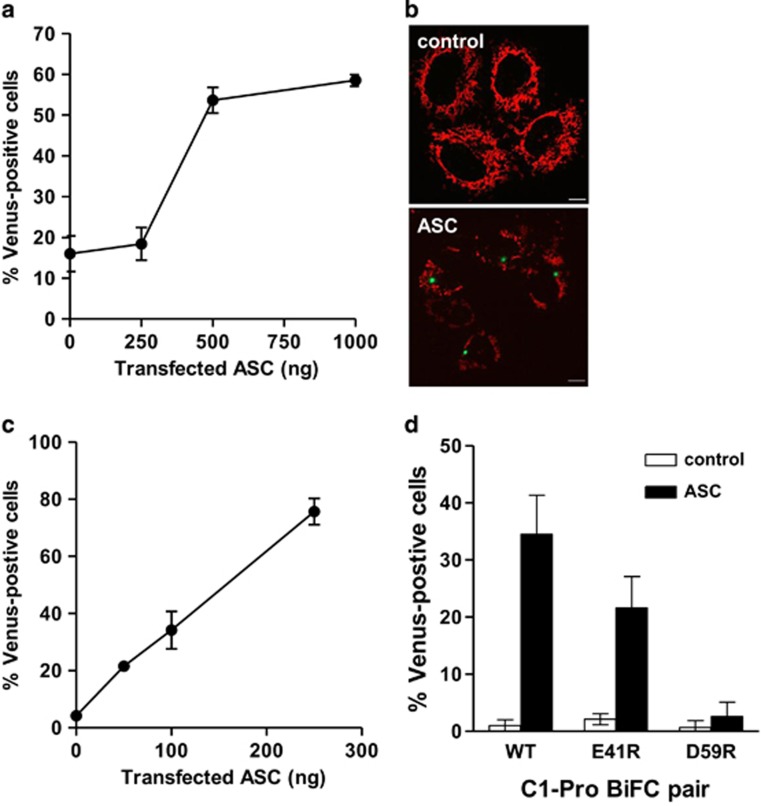
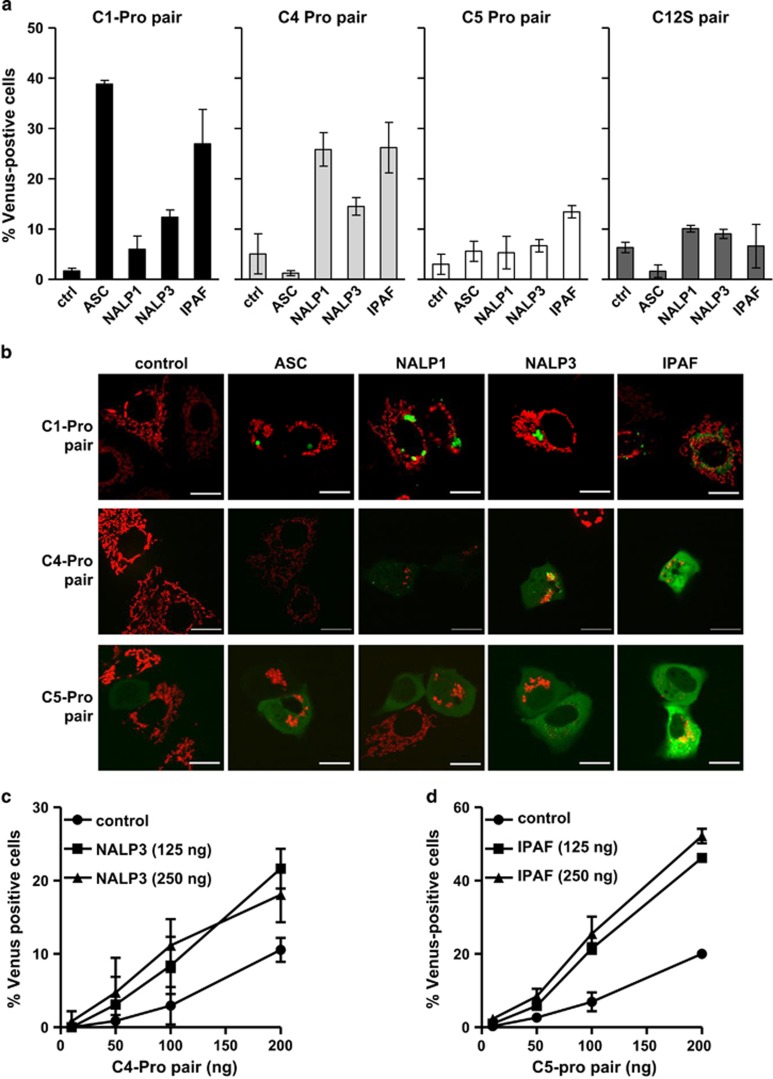
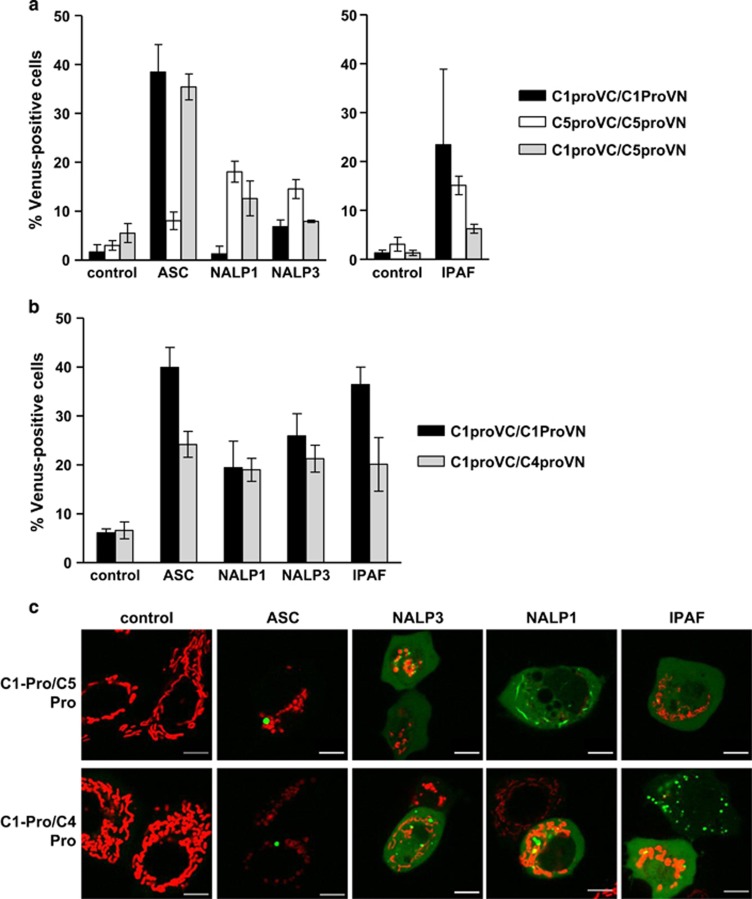
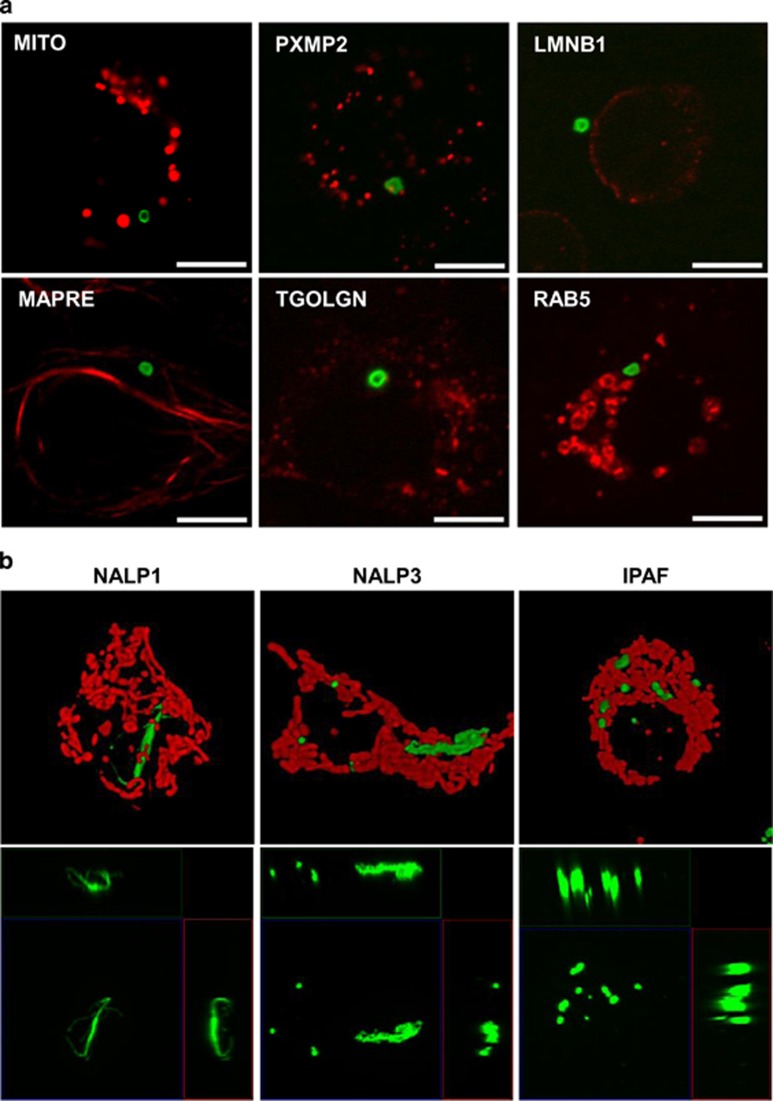
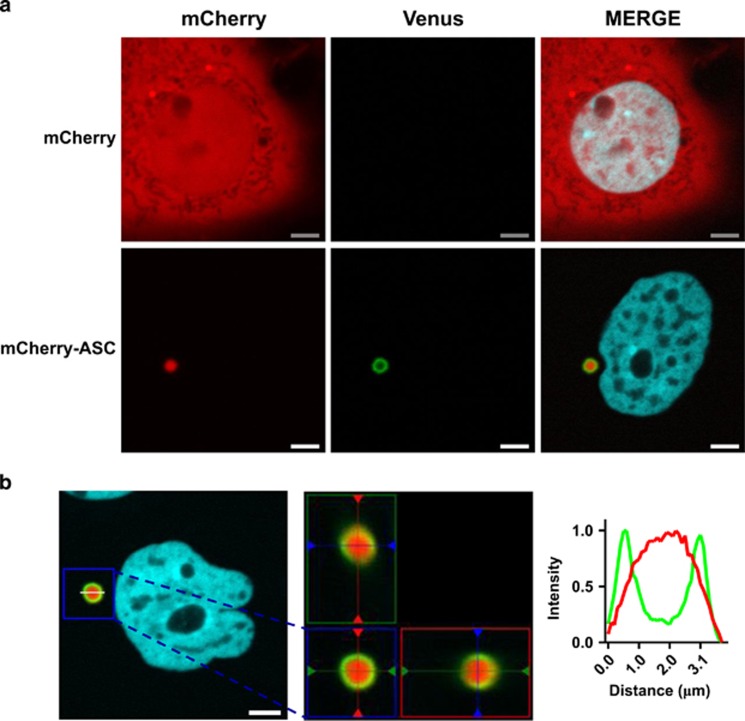
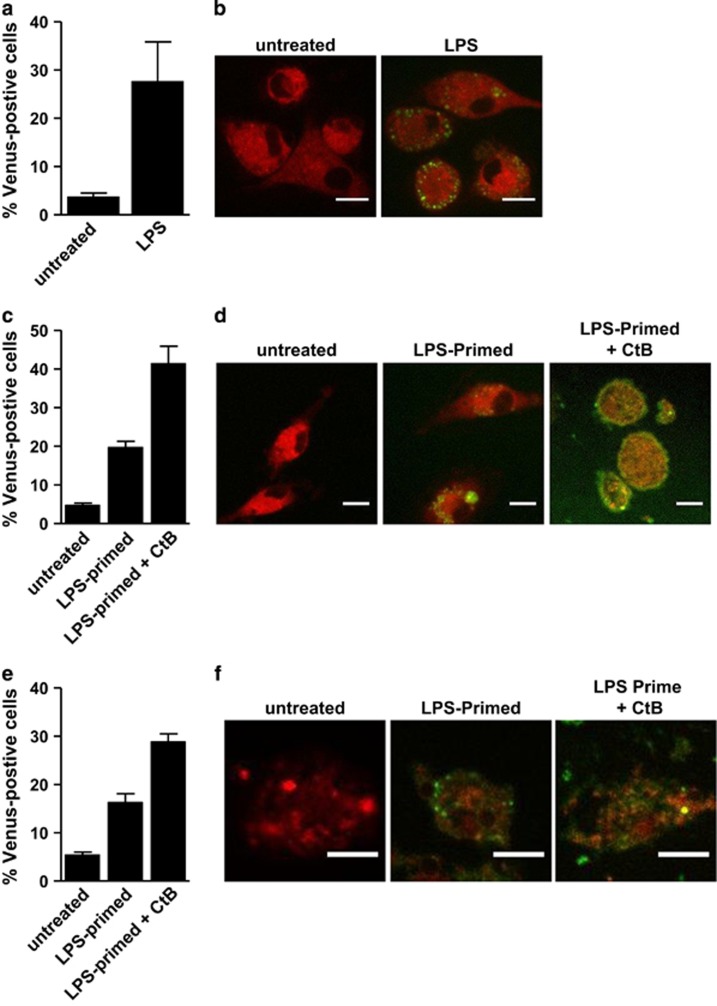
The human inflammatory caspases, including caspase-1, -4, -5 and -12, are considered as key regulators of innate immunity protecting from sepsis and numerous inflammatory diseases. Caspase-1 is activated by proximity-induced dimerization following recruitment to inflammasomes but the roles of the remaining inflammatory caspases in inflammasome assembly are unclear. Here, we use caspase bimolecular fluorescence complementation to visualize the assembly of inflammasomes and dimerization of inflammatory caspases in single cells. We observed caspase-1 dimerization induced by the coexpression of a range of inflammasome proteins and by lipospolysaccharide (LPS) treatment in primary macrophages. Caspase-4 and -5 were only dimerized by select inflammasome proteins, whereas caspase-12 dimerization was not detected by any investigated treatment. Strikingly, we determined that certain inflammasome proteins could induce heterodimerization of caspase-1 with caspase-4 or -5. Caspase-5 homodimerization and caspase-1/-5 heterodimerization was also detected in LPS-primed primary macrophages in response to cholera toxin subunit B. The subcellular localization and organization of the inflammasome complexes varied markedly depending on the upstream trigger and on which caspase or combination of caspases were recruited. Three-dimensional imaging of the ASC (apoptosis-associated speck-like protein containing a caspase recruitment domain)/caspase-1 complexes revealed a large spherical complex of ASC with caspase-1 dimerized on the outer surface. In contrast, NALP1 (NACHT leucine-rich repeat protein 1)/caspase-1 complexes formed large filamentous structures. These results argue that caspase-1, -4 or -5 can be recruited to inflammasomes under specific circumstances, often leading to distinctly organized and localized complexes that may impact the functions of these proteases.


Figures

Figure 1
Figure 1
ASC induces caspase-1 BiFC. (a) HeLa cells were transiently transfected with C1-Pro VC (10 ng) and C1-Pro VN (10 ng) along with the indicated amounts of an expression plasmid encoding ASC. All wells also received dsRed-mito (10 ng) as a reporter for transfection. All cells were treated with qVD-OPH (5 μM) to prevent cell death. At 48 h after transfection, the percentage dsRed-mito-positive cells that were Venus-positive was determined from a minimum of 300 cells per well. Results represent triplicate counts with error bars representing S.D. and are representative of at least three independent experiments. (b) Representative confocal images of cells from (a) are shown, showing mitochondria (red) and caspase-1 BiFC (green). Scale bars represent 10 μm. (c) MCF-7 cells were transiently transfected with C1-Pro VC (10 ng) and C1-Pro VN (10 ng) along with the indicated amounts of an expression plasmid encoding ASC and dsRed-mito (10 ng). Cells were treated and assessed as in (a). (d) MCF-7 cells were transiently transfected with C1-Pro VC (10 ng) and C1-Pro VN (10 ng), the E41R mutant C1-Pro Venus pair (10ng of each) or the D59R mutant C1-Pro Venus pair (10ng of each) along with dsRed-mito (10 ng). Cells were treated and assessed as in (a)
Figure 2
Figure 2
Inflammatory caspase BiFC is induced by distinct inflammasome components. (a) MCF-7 cells were transiently transfected with C1-Pro (10 ng of each), C4-Pro (50 ng of each), C5-Pro (200 ng of each) or C12S (20 ng of each) BiFC plasmid pairs along with expression plasmids encoding ASC, NALP1, NALP3 or IPAF as indicated. All wells also received dsRed-mito (10 ng) as a reporter for transfection. All cells were treated with qVD-OPH (5 μM) to prevent cell death. At 48 h after transfection, the percentage of transfected cells that were Venus-positive was determined from a minimum of 300 cells per well. Results represent triplicate counts with error bars representing S.D. and are representative of at least three independent experiments. (b) Representative confocal images of cells from (a) are shown. Mitochondria are shown in red and caspase BiFC in green. Scale bars represent 20 μm (c) MCF-7 cells were transiently transfected with the indicated amounts of C4-Pro VC, C4 Pro VN and NALP3. Cells were treated and assessed at 48 h as in (a). (d) MCF-7 cells were transiently transfected with the indicated amounts of C5-Pro VC, C5-Pro VN and IPAF. Cells were treated and assessed at 48 h as in (a)
Figure 3
Figure 3
Heterodimerization of caspase-1 with caspase-4 or -5 is induced by inflammasome components. (a) MCF-7 cells were transiently transfected with the indicated combinations of C1-Pro (10 ng) and C5-Pro (200 ng) BiFC plasmids along with expression plasmids encoding ASC, NALP1, NALP3 or IPAF. All wells also received dsRed-mito (10 ng) as a reporter for transfection. All cells were treated with qVD-OPH (5 μM) to prevent cell death. At 48 h after transfection, the percentage of transfected cells that were Venus-positive was determined from a minimum of 300 cells per well. Results represent triplicate counts with error bars representing S.D. and are representative of at least three independent experiments. (b) MCF-7 cells were transiently transfected with the indicated combinations of C1-Pro (10 ng) and C4-Pro (20 ng) BiFC plasmids along with expression plasmids encoding ASC, NALP1, NALP3 or IPAF and dsRed-mito (10 ng). Cells were treated and assessed at 48 h as in (a). (c) Representative confocal images of cells from (a) and (b) are shown, with the mitochondria shown in red and caspase BiFC shown in green. Scale bars represent 10 μm
Figure 4
Figure 4
Subcellular localization of C1-Pro BiFC. (a) MCF-7 cells were transiently transfected with expression plasmids encoding C1-Pro VC (10 ng) and C1-Pro VN (10 ng) along with an expression plasmid encoding ASC (125 ng) and dsRed-mito, PXMP2-RFP, LNMB1-RFP, MAPRE-RFP, TGOLGN-RFP or Rab5-RFP as indicated. All cells were treated with qVD-OPH (5 μM) to prevent cell death. Cells were assessed for BiFC (green) 24 h after transfection. Representative images are shown, taken with a x64 objective. DsRed-mito, PXMP2-RFP, LNMB1-RFP, MAPRE-RFP, TGOLGN-RFP and Rab5-RFP were used to detect mitochondria, peroxisomes, nuclei, cytoskeleton, Golgi and early endosomes, respectively (red). Scale bars represent 10 μm. (c) MCF-7 cells were transiently transfected with expression plasmids encoding C1-Pro VC (10 ng) and C1-Pro VN (10 ng) along with expression plasmids encoding NALP1, NALP3 or IPAF (125 ng) and dsRed-mito (10 ng) in the presence of qVD-OPH (5 μM). Cells were assessed for C1-Pro BiFC (green) 24 h after transfection. Images in the top row are three-dimensional (3D) isosurface rendering reconstructions composed from 0.1 μm serial confocal images through the z plane of the cell showing mitochondria in red and C1-Pro BiFC (in green). The bottom row shows the orthogonal views maximum intensity projection of the Venus signal for each condition. The middle panel is the xy plane, the right panel is the yz plane and the top panel is the xz plane
Figure 5
Figure 5
Caspase-1 is dimerized on the outer surface of ASC complexes. MCF-7 cells were transiently transfected with expression plasmids encoding C1-Pro VC (40 ng), C1-Pro VN (40 ng) and mTurquoise-histone H2A-10 (blue), which localizes to the nucleus (10 ng), with mCherry (800 ng) or ASC-mCherry (800 ng) in the presence of qVD-OPH (20 μM). After 24 h, cells were assessed for caspase-1 BiFC (green) and ASC (red) colocalization. Scale bars represent 5 μm. (b) 3D reconstructions composed from 0.1 μm serial confocal images through the z plane of the cell were made. The orthogonal slice view of the boxed region (left) is shown (center). The middle panel is the xy plane, the right panel is the yz plane and top panel is the xz plane. The yz and xz planes intersect according to the cross hairs. The line scan (right) indicates the localization of C1-Pro BiFC relative to mCherry-ASC and corresponds to the line drawn on the image (left)
Figure 6
Figure 6
Proinflammatory stimuli induce inflammatory caspase BiFC in primary murine BMDM. (a) Murine BMDM were transiently transfected with expression plasmids encoding C1-Pro VC (300 ng) and C1-Pro VN (300 ng) with dsRed as a reporter for transfection. After 24 h, cells were treated with or without ultrapure LPS (100 ng/ml) for 4 h. The percentage of transfected cells that were Venus-positive cells was determined by flow cytometry. Error bars represent the S.D. of three independent experiments. (b) Representative confocal images of cells from (a) are shown. Scale bars represent 10 μm. (c) Murine BMDM were transiently transfected with expression plasmids encoding C5-Pro VC (300 ng) and C5-Pro VN (300 ng) with dsRed as a reporter for transfection. After 24 h, cells were left untreated or primed with ultrapure LPS (100 ng/ml) for 4 h. LPS-primed cells were then treated with CtB (20 μg/ml) for 16 h. The percentage of transfected cells that were Venus-positive cells was determined by flow cytometry. Error bars represent the S.D. of three independent experiments. (d) Representative confocal images of cells from (c) are shown. Scale bars represent 10 μm. (e) Murine BMDM were transiently transfected with expression plasmids encoding C1-Pro VC (300 ng) and C5-Pro VN (300 ng) with dsRed as a reporter for transfection. Cells were treated and assessed as in (c). (f) Representative confocal images of cells from (e) are shown. Scale bars represent 50 μm

References

    1. 1Cerretti DP, Kozlosky CJ, Mosley B, Nelson N, Van Ness K, Greenstreet TA et al. Molecular cloning of the interleukin-1 beta converting enzyme. Science 1992; 256: 97–100. - PubMed
    1. 2Ghayur T, Banerjee S, Hugunin M, Butler D, Herzog L, Carter A et al. Caspase-1 processes IFN-gamma-inducing factor and regulates LPS-induced IFN-gamma production. Nature 1997; 386: 619–623. - PubMed
    1. 3Stutz A, Golenbock DT, Latz E. Inflammasomes: too big to miss. J Clin Invest 2009; 119: 3502–3511. - PMC - PubMed
    1. 4Petrilli V, Dostert C, Muruve DA, Tschopp J. The inflammasome: a danger sensing complex triggering innate immunity. Curr Opin Immunol 2007; 19: 615–622. - PubMed
    1. 5Bertin J, DiStefano PS. The PYRIN domain: a novel motif found in apoptosis and inflammation proteins. Cell Death Differ 2000; 7: 1273–1274. - PubMed

Publication types

MeSH terms