. 2015 Jul 9;11(7):e1005309.
doi: 10.1371/journal.pgen.1005309. eCollection 2015 Jul.

Temporal Coordination of Carbohydrate Metabolism during Mosquito Reproduction

Affiliations

Temporal Coordination of Carbohydrate Metabolism during Mosquito Reproduction

Yuan Hou et al. PLoS Genet. .

Abstract

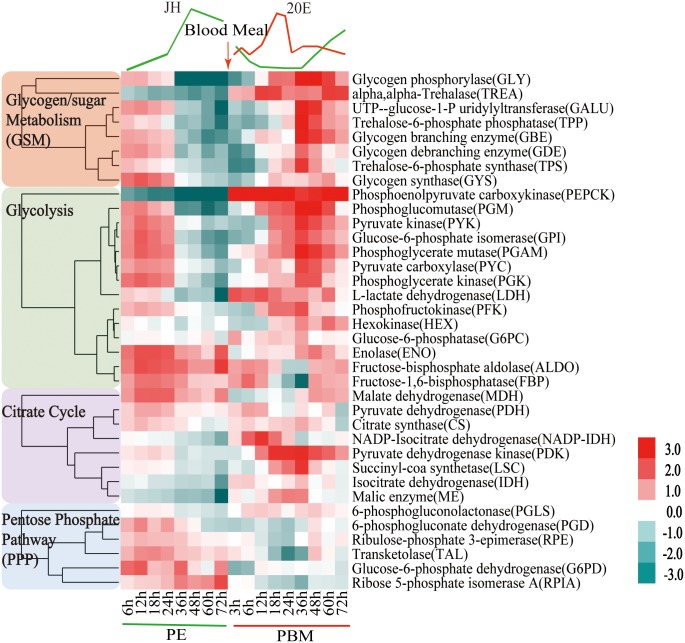
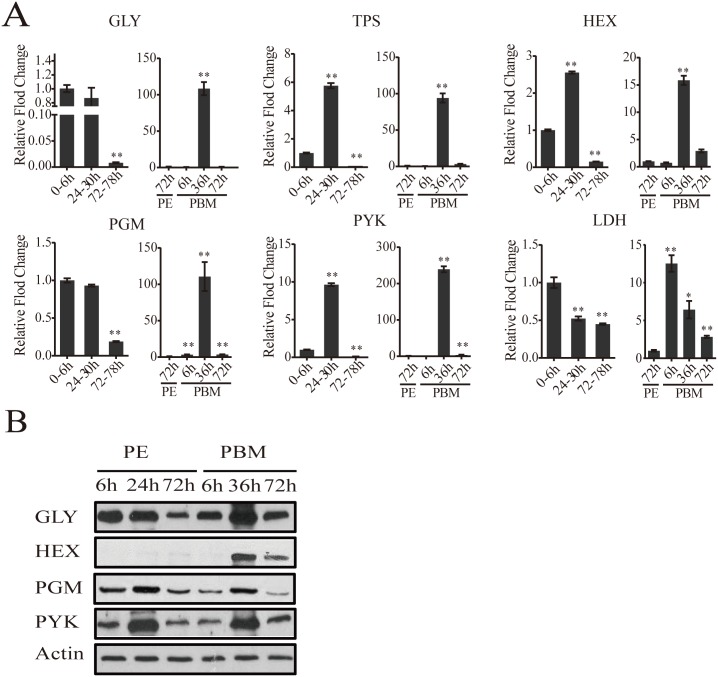
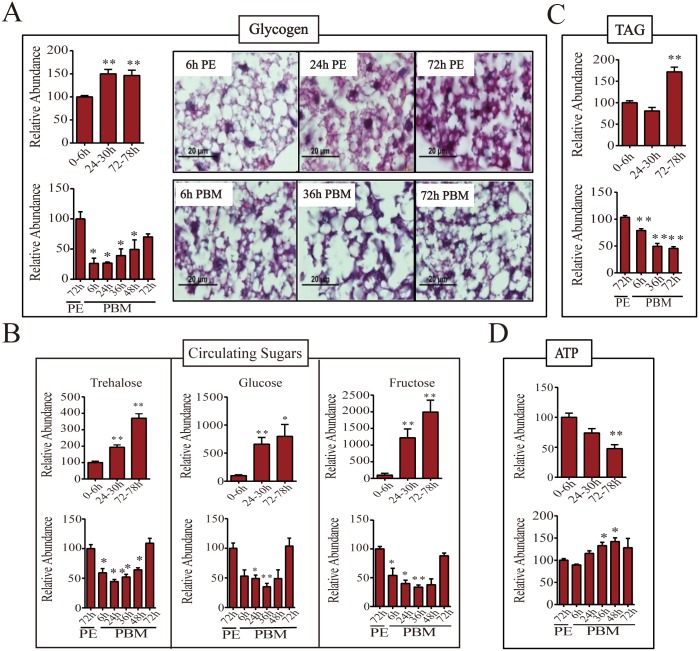
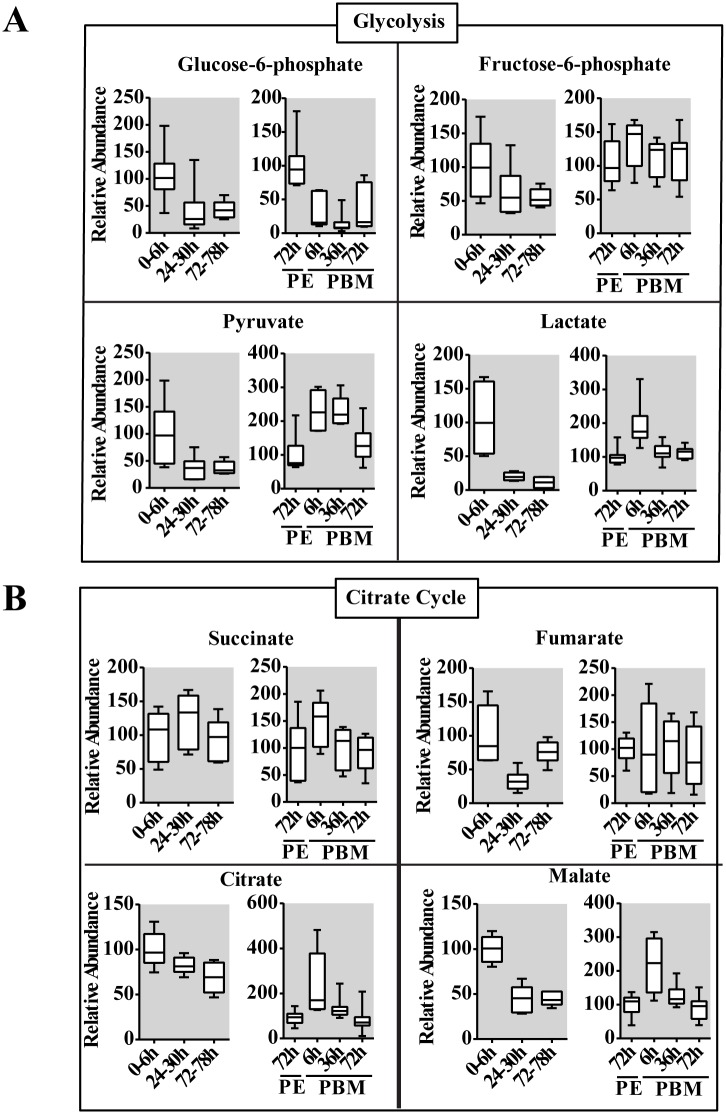
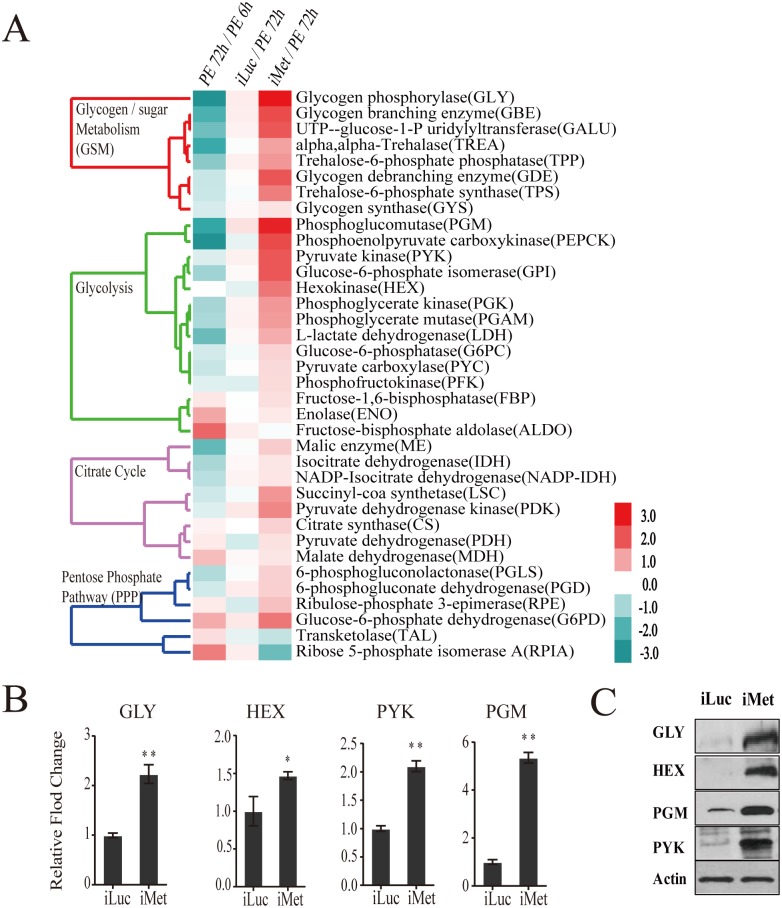
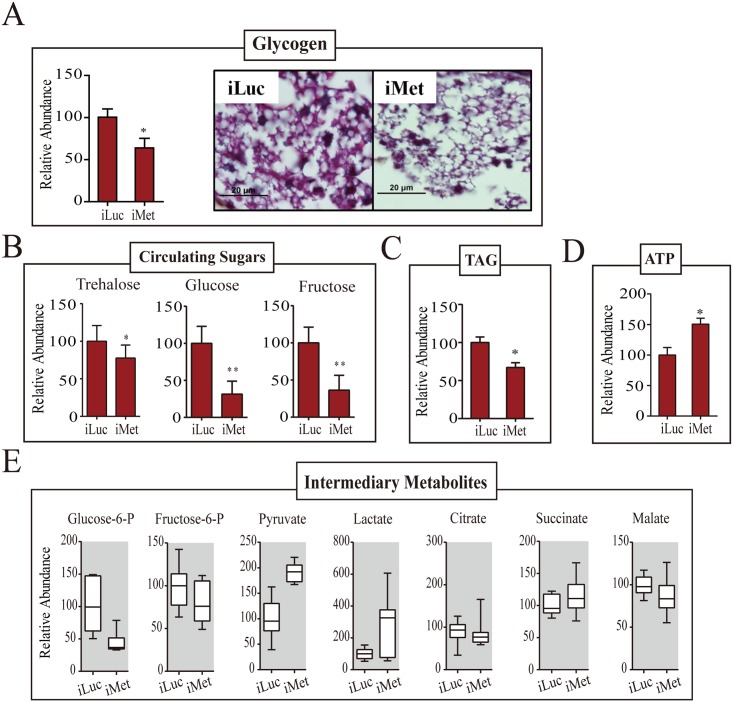
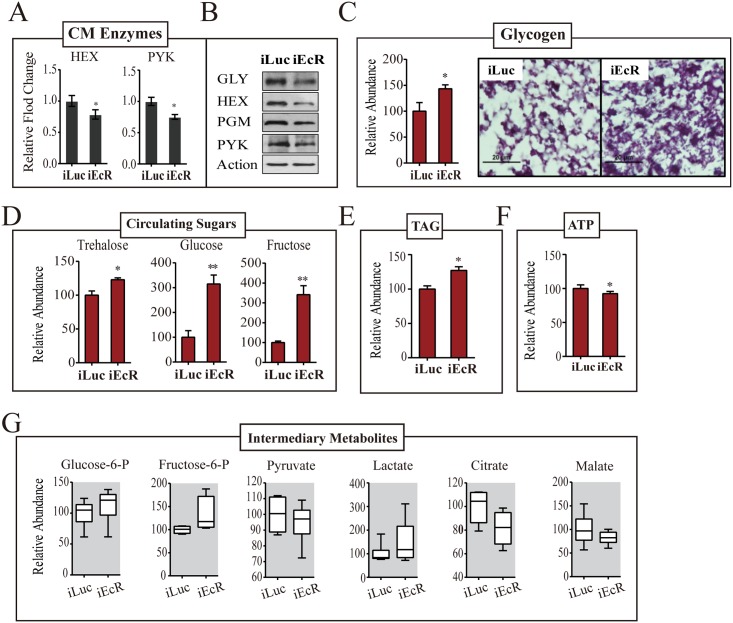
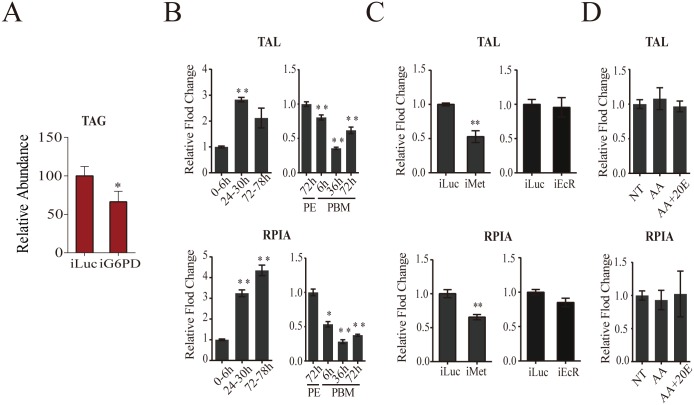
Hematophagous mosquitoes serve as vectors of multiple devastating human diseases, and many unique physiological features contribute to the incredible evolutionary success of these insects. These functions place high-energy demands on a reproducing female mosquito, and carbohydrate metabolism (CM) must be synchronized with these needs. Functional analysis of metabolic gene profiling showed that major CM pathways, including glycolysis, glycogen and sugar metabolism, and citrate cycle, are dramatically repressed at post eclosion (PE) stage in mosquito fat body followed by a sharply increase at post-blood meal (PBM) stage, which were also verified by Real-time RT-PCR. Consistent to the change of transcript and protein level of CM genes, the level of glycogen, glucose and trehalose and other secondary metabolites are also periodically accumulated and degraded during the reproductive cycle respectively. Levels of triacylglycerols (TAG), which represent another important energy storage form in the mosquito fat body, followed a similar tendency. On the other hand, ATP, which is generated by catabolism of these secondary metabolites, showed an opposite trend. Additionally, we used RNA interference studies for the juvenile hormone and ecdysone receptors, Met and EcR, coupled with transcriptomics and metabolomics analyses to show that these hormone receptors function as major regulatory switches coordinating CM with the differing energy requirements of the female mosquito throughout its reproductive cycle. Our study demonstrates how, by metabolic reprogramming, a multicellular organism adapts to drastic and rapid functional changes.


Conflict of interest statement

The authors have declared that no competing interests exist.

Figures

Fig 1
Fig 1. Heatmap representing the microarray-based expression pattern of CM genes.
Candidates with a fold change greater than 1.75 (0.8 in log2 scale) and a false-discovery rate (p value) less than 0.01 are included. Gene expression time points in the PE and PBM phases were normalized to 6h PE and 72h PE time points, respectively. The four shades of color to the left represent different CM pathways: red, glycogen/sugar metabolism; green, glycolysis; purple, citrate cycle; and blue, pentose phosphate pathway. The respective dendograms generated by hierarchical clustering of genes from each pathway are also provided.
Fig 2
Fig 2. CM gene expression dynamics in the fat body of adult female mosquitoes.
(A) qPCR analysis of selected CM genes during PE and PBM. Relative abundance of PE and PBM time points were normalized to the 0-6h PE and 72h PE, respectively. In the graphs, the abundance of these two time points is represented as 1.0, with corresponding adjustments for other time points. All experiments were performed in triplicate, with similar results. Error bars represent ± SD. * p < 0.05;** p < 0.01. Additional CM genes are shown in S2 Fig (B) Western blot showing the fat body protein levels of key CM enzymes during PE and PBM. Total protein extracts were prepared from eight adult female fat bodies for each indicated time point. Actin was used as a control for loading and transfer.
Fig 3
Fig 3. Levels of storage and circulating sugars, TAG and ATP during PE and PBM phases.
(A) Endogenous levels of glycogen during PE (top panel) and PBM (bottom panel) phases. Total glycogen content of adult female mosquitoes was measured colorimetrically (left; n = 6 independently collected samples per time point, with six mosquitoes per sample). Glycogen content of the female mosquito fat body was also visualized by PAS staining (right). Similar results were observed in two additional independent experiments. (B) Levels of circulating sugars trehalose (top), glucose (middle) and fructose (bottom) for PE and PBM as determined by means of gas chromatography—mass spectrometry (GC-MS; n = 12 independently collected samples per time point, with six mosquitoes per sample). (C) TAG levels were measured during PE (top panel) and PBM (bottom panel) phases (n = 6 independently collected samples per time point, with six mosquitoes per sample). (D) ATP concentrations in female mosquitoes during the PE (top) and the PBM (bottom) phases were measured using high performance liquid chromatography (HPLC; n = 6 independently collected samples per time point, with six mosquitoes per sample). Amounts of glycogen (A, left), trehalose, glucose and fructose (B), TAG (C), and ATP (D) were normalized to total protein levels. The metabolite levels at 0-6h PE and 72h PE are represented as 100, with relative adjustments in the sugar and ATP levels at other time points. Error bars represent ± SD. * p < 0.05;** p < 0.01.
Fig 4
Fig 4. Changes in the level of intermediary metabolites throughout the reproductive cycle of adult female mosquito.
(A and B) Relative levels for intermediary metabolites of glycolysis (A) and the citrate cycle (B) during PE and PBM development. Glucose-6-phosphate, fructose-6-phosphate, pyruvate and lactate from the glycolytic pathway, and citrate, succinate fumarate and malate from the citrate cycle were measured using gas chromatography—mass spectrometry (GC/MS). The time points 0-6h PE and 72h PE were used as controls for PE and PBM periods, respectively. The controls are represented as relative abundance 100, and the levels at other time points were adjusted accordingly. In the box plots, the box represents the lower and upper quartiles, the horizontal line represents the median and the bars represent the minimum and maximum data points (n = 12 samples collected from independent populations, with six adult female mosquito per sample). Three independent sets of metabolite measurements were performed with similar results.
Fig 5
Fig 5. CM genes are upregulated in the Met-depleted mosquito.
(A) Heatmap showing the alteration of CM gene expression in the Met-depleted mosquito (iMet) compared with that in the control samples iLuc and 72h PE, as characterized by microarray analysis. The raw intensity values for expression of CM genes in iMet and iLuc samples were normalized to 72h PE, while the 72h PE values were normalized to 6h PE samples. Only genes showing a fold change > 1.75 (0.8 in log2 scale) with a false-discovery rate (p value) less than 0.01 were included. Hierarchical clustering dendograms for the four different CM pathways are provided. Dendograms are color coded for glycogen/sugar metabolism (red), glycolysis (green), citrate cycle (purple) and pentose phosphate pathway (blue). (B) qPCR validations for a selected set of genes from glycogen/sugar metabolism and glycolysis, showing the effect of Met depletion on these genes at the transcript level. Relative abundance of control iLuc is represented as 1, with corresponding adjustments in iMet value. Error bars represent ± SD. * p < 0.05;** p < 0.01. (C) Western blots showing dramatic changes in CM enzymes at the protein level in the fat body of the Met-depleted mosquitoes during PE development. Actin was used as a loading control.
Fig 6
Fig 6. Met-depleted mosquitoes exhibit metabolic defects.
(A) A decrease in the glycogen levels was observed in Met-depleted adult female mosquitoes, as measured by colorimetry (left) and PAS staining (right). Mosquitoes injected with iLuc were used as controls. (B) Changes in the levels of circulating sugars as a result of Met depletion. A reduction in trehalose, glucose and fructose concentrations were observed in iMet mosquitoes in comparison with the iLuc controls. (C) A decrease in the TAG level was observed in Met-depleted adult female mosquitoes, as measured by colorimetry. (D) ATP levels in iMet mosquitoes as determined by HPLC. A significant increase in the ATP levels was observed in iMet mosquitoes when compared with controls. Experimental procedure, normalizations and statistical analysis are similar to those in Fig 2, parts A-C, respectively. (E) Box plots showing the relative levels of intermediary metabolites of CM in iMet mosquitoes. While lactate and the glycolytic end product pyruvate were significantly induced, a reduction in the levels of glucose-6-phosphate and fructose-6-phosphate was observed. Intermediates of the citrate cycle, citrate, succinate and malate showed a mild increase in concentration. Three independent batches of experiments were performed, each showing similar results. Tissue collections and samplings were performed 4 days post-injection. All metabolite levels were normalized to the amount of total endogenous proteins. The control iLuc is represented as relative abundance 100, with corresponding adjustments in iMet levels. Error bars represent ± SD. * p < 0.05; ** p < 0.01.
Fig 7
Fig 7. EcR depletion affects CM during PBM development.
(A) qPCR-based transcript levels of CM enzymes in iEcR adult female mosquito. Transcripts of HEX, GLY, PGM and PYK were significantly repressed as a result of EcR knockdown.(B) Western blot showing the protein levels of enzymes GLY, HEX, PGM and PYK in EcR-depleted mosquitoes. Actin was used as a loading control. (C) A moderate increase in the glycogen levels was observed as result of RNAi depletion of EcR. Glycogen levels measured by colorimetry (left) and PAS staining (right). (D) Effect of EcR knockdown on the concentration of circulating sugars. While dramatic increases in the glucose and fructose levels were noted as a result of EcR depletion, trehalose was only mildly altered. Gas chromatography—mass spectrometry (GC-MS) was used for the quantification of circulating sugars. (E) An increase in the TAG levels was observed in Met-depleted female mosquitoes, as measured by colorimetry (F) High-performance liquid chromatography (HPLC)-based ATP measurements in iEcR mosquitoes. A moderate reduction in ATP level was observed in treated mosquitoes. (G) Box plots showing the variation of relative level for small metabolites of the CM pathway in the EcR-depleted mosquitoes. Small metabolites were normalized to the total protein level of the organisms. Measurements from three independent biological experiments were performed, with similar results. Experiments were performed in triplicate using separate cohorts of mosquitoes. For all experiments, iLuc mosquitoes were used as controls. iEcR and iLuc mosquitoes were blood fed 4 days post-injection, followed by sample collections at 36h PBM. The control iLuc is represented as relative abundance 100, with corresponding adjustments in iEcR levels. Error bars represent ± SD. *p < 0.05;**p < 0.01.
Fig 8
Fig 8. Analysis of pentose phosphate pathway genes.
(A) A decrease in the TAG levels in G6PD-depleted adult female mosquitoes, as measured by colorimetry. (B) Expression of pentose phosphate pathway genes TAL (top) and RPIA (bottom) during PE and PBM. Sample points, sample collections and experimental procedures are similar to that of Fig 1C. (C) Effect of Met and EcR knockdowns on the expression of TAL (top) and RPIA (bottom) during PE and PBM. Sample collections and experiments are similar to that of Fig 4B (for iMet) and Fig 6A (for iEcR). (D) AA and 20E had no effect on TAL and RPIA expression. Sampling and experiments are similar to that of S5A Fig. The controls are represented as relative abundance of 100. Error bars represent ± SD. *p < 0.05;**p < 0.01.

References

    1. Attardo GM, Hansen IA, Raikhel AS (2005) Nutritional regulation of vitellogenesis in mosquitoes: implications for anautogeny. Insect Biochem Mol Biol 35: 661–675. - PubMed
    1. Matthews KR (2011) Controlling and coordinating development in vector-transmitted parasites. Science 331: 1149–1153. 10.1126/science.1198077 - DOI - PMC - PubMed
    1. Clements AN (1992) The biology of mosquitoes Volume 1: Development, Nutrition and Reproduction. London: Chapman & Hall; 511 p.
    1. Raikhel AS, Kokoza VA, Zhu J, Martin D, Wang SF, et al. (2002) Molecular biology of mosquito vitellogenesis: from basic studies to genetic engineering of antipathogen immunity. Insect Biochem Mol Biol 32: 1275–1286. - PubMed
    1. Zou Z, Saha TT, Roy S, Shin SW, Backman TW, et al. (2013) Juvenile hormone and its receptor, methoprene-tolerant, control the dynamics of mosquito gene expression. Proc Natl Acad Sci U S A 110: E2173–2181. 10.1073/pnas.1305293110 - DOI - PMC - PubMed

Publication types

MeSH terms

LinkOut - more resources