Data-Driven Method to Estimate Nonlinear Chemical Equivalence
- PMID: 26158701
- PMCID: PMC4497723
- DOI: 10.1371/journal.pone.0130494
Data-Driven Method to Estimate Nonlinear Chemical Equivalence
Erratum in
-
Correction: Data-Driven Method to Estimate Nonlinear Chemical Equivalence.PLoS One. 2015 Jul 30;10(7):e0134652. doi: 10.1371/journal.pone.0134652. eCollection 2015. PLoS One. 2015. PMID: 26225559 Free PMC article.
Abstract
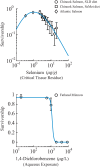
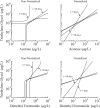
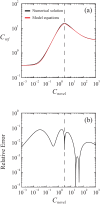
There is great need to express the impacts of chemicals found in the environment in terms of effects from alternative chemicals of interest. Methods currently employed in fields such as life-cycle assessment, risk assessment, mixtures toxicology, and pharmacology rely mostly on heuristic arguments to justify the use of linear relationships in the construction of "equivalency factors," which aim to model these concentration-concentration correlations. However, the use of linear models, even at low concentrations, oversimplifies the nonlinear nature of the concentration-response curve, therefore introducing error into calculations involving these factors. We address this problem by reporting a method to determine a concentration-concentration relationship between two chemicals based on the full extent of experimentally derived concentration-response curves. Although this method can be easily generalized, we develop and illustrate it from the perspective of toxicology, in which we provide equations relating the sigmoid and non-monotone, or "biphasic," responses typical of the field. The resulting concentration-concentration relationships are manifestly nonlinear for nearly any chemical level, even at the very low concentrations common to environmental measurements. We demonstrate the method using real-world examples of toxicological data which may exhibit sigmoid and biphasic mortality curves. Finally, we use our models to calculate equivalency factors, and show that traditional results are recovered only when the concentration-response curves are "parallel," which has been noted before, but we make formal here by providing mathematical conditions on the validity of this approach.
Conflict of interest statement
Figures


References
-
- ISO. Environmental Management—Life Cycle Assessment—Principles and Framework Geneva, Switzerland: International Standards Organization; 2006. ISO 14040:2006.
-
- Brentrup F, Kusters J, Kuhlmann H, Lammel J. Application of life cycle assessment methodology to agricultural production: an example of sugar beet production with different forms of nitrogen fertilisers. Eur J Agron. 2001;14:221–233.
-
- Seppälä J, Knuuttila S, Silvo K. Eutrophication of aquatic ecosystems: a new method for calculating the potential contributions of nitrogen and phosphorous. Int J LCA. 2004;9(2):90–100.
-
- Myhre G, Shindell D, Bréon F-M, Collins W, Fuglestvedt J, Huang J., et al. Anthropogenic and Natural Radiative Forcing In: Stocker TF, Qin D, Plattner G-K, Tignor MMB, Allen SK, Boshung J., et al., editors. Climate Change 2013: The Physical Science Basis. Contribution of Working Group I to the Fifth Assessment Report of the Intergovernmental Panel on Climate Change. Cambridge, UK: Cambridge University Press; 2013.
Publication types
MeSH terms
Substances
LinkOut - more resources
Full Text Sources
Other Literature Sources
Medical

