. 2015 Jul 9;11(7):e1004259.
doi: 10.1371/journal.pcbi.1004259. eCollection 2015 Jul.

Heterogeneous Network Edge Prediction: A Data Integration Approach to Prioritize Disease-Associated Genes

Affiliations

Heterogeneous Network Edge Prediction: A Data Integration Approach to Prioritize Disease-Associated Genes

Daniel S Himmelstein et al. PLoS Comput Biol. .

Abstract

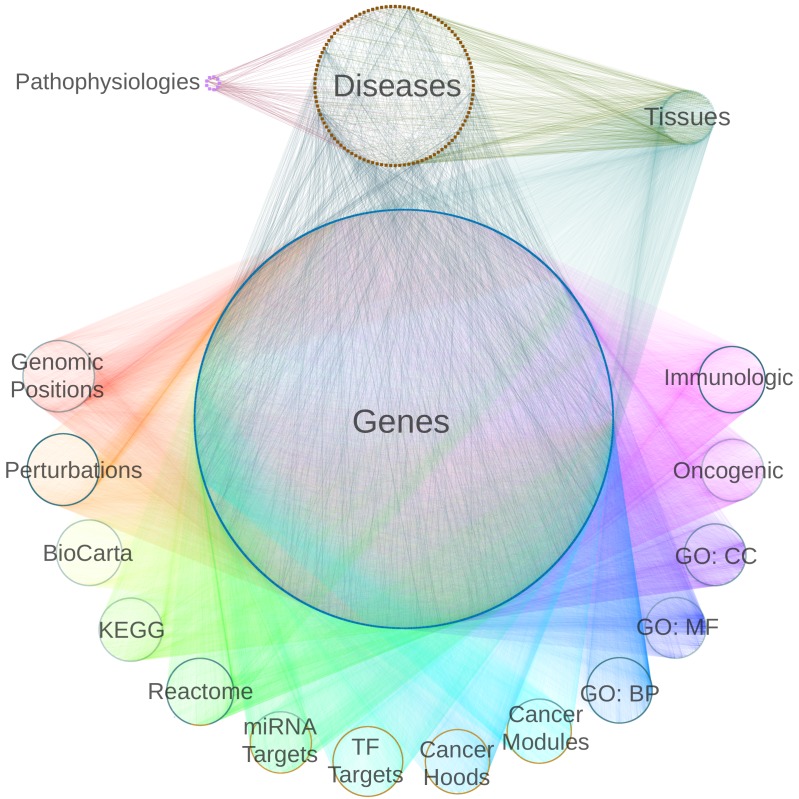
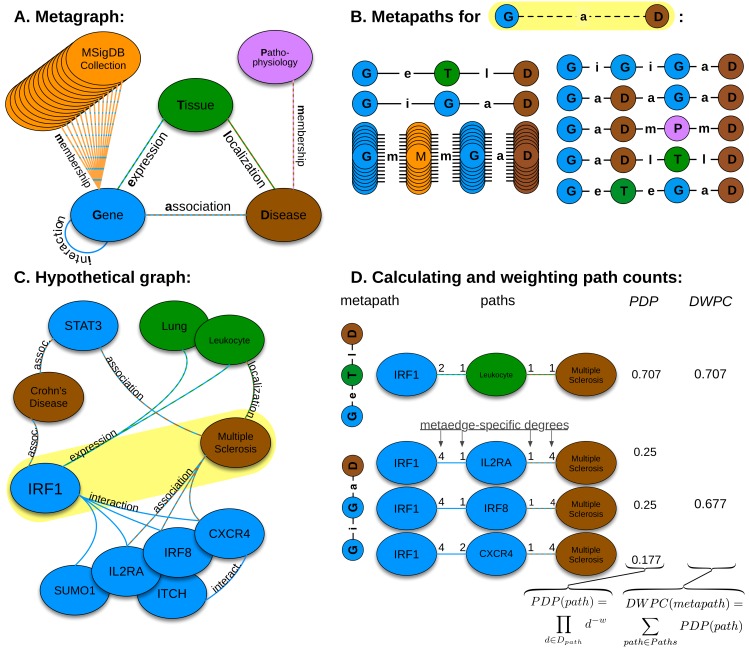
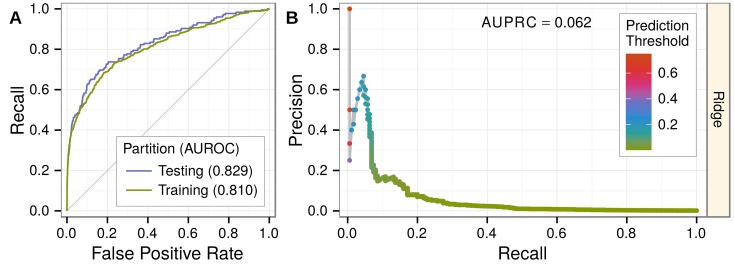
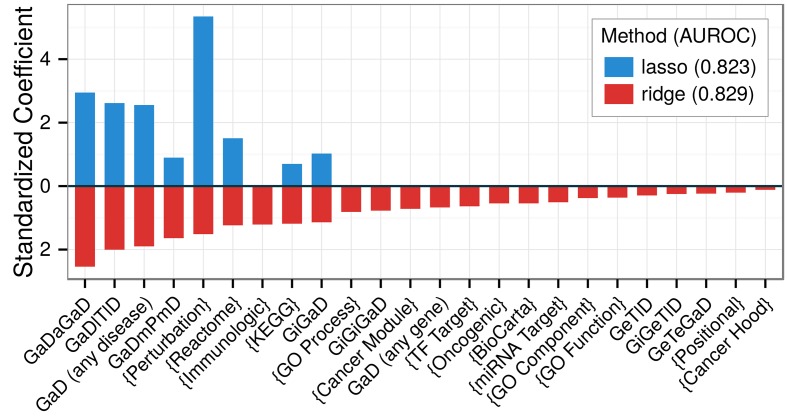
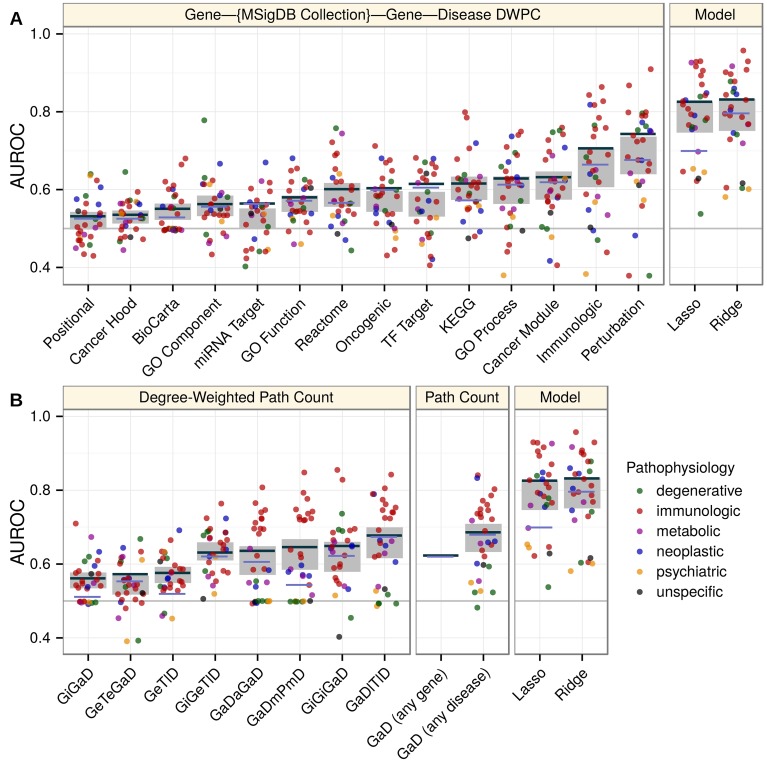
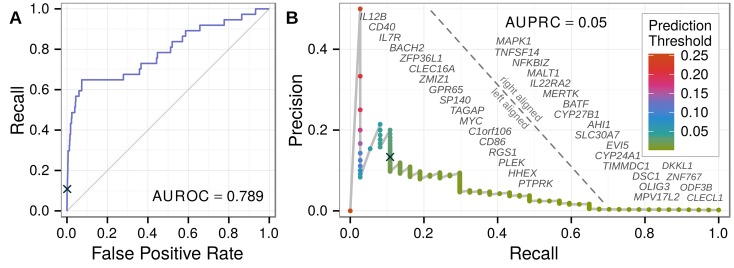
The first decade of Genome Wide Association Studies (GWAS) has uncovered a wealth of disease-associated variants. Two important derivations will be the translation of this information into a multiscale understanding of pathogenic variants and leveraging existing data to increase the power of existing and future studies through prioritization. We explore edge prediction on heterogeneous networks--graphs with multiple node and edge types--for accomplishing both tasks. First we constructed a network with 18 node types--genes, diseases, tissues, pathophysiologies, and 14 MSigDB (molecular signatures database) collections--and 19 edge types from high-throughput publicly-available resources. From this network composed of 40,343 nodes and 1,608,168 edges, we extracted features that describe the topology between specific genes and diseases. Next, we trained a model from GWAS associations and predicted the probability of association between each protein-coding gene and each of 29 well-studied complex diseases. The model, which achieved 132-fold enrichment in precision at 10% recall, outperformed any individual domain, highlighting the benefit of integrative approaches. We identified pleiotropy, transcriptional signatures of perturbations, pathways, and protein interactions as influential mechanisms explaining pathogenesis. Our method successfully predicted the results (with AUROC = 0.79) from a withheld multiple sclerosis (MS) GWAS despite starting with only 13 previously associated genes. Finally, we combined our network predictions with statistical evidence of association to propose four novel MS genes, three of which (JAK2, REL, RUNX3) validated on the masked GWAS. Furthermore, our predictions provide biological support highlighting REL as the causal gene within its gene-rich locus. Users can browse all predictions online (http://het.io). Heterogeneous network edge prediction effectively prioritized genetic associations and provides a powerful new approach for data integration across multiple domains.


Conflict of interest statement

The authors have declared that no competing interests exist.

Figures

Fig 1
Fig 1. Heterogeneous network integrates diverse information domains.
We constructed a heterogeneous network with 18 metanodes (denoted with labels) and 19 metaedges (denoted by color). For each metanode, nodes are laid out circularly. Incorporating type information adds structure to a network which would otherwise appear as an undecipherable agglomeration of 40,343 nodes and 1,608,168 edges.
Fig 2
Fig 2. Heterogeneous network edge prediction methodology.
A) We constructed the network according to a schema, called a metagraph, which is composed of metanodes (node types) and metaedges (edge types). B) The network topology connecting a gene and disease node is measured along metapaths (types of paths). Starting on Gene and ending on Disease, all metapaths length three or less are computed by traversing the metagraph. C) A hypothetical graph subset showing select nodes and edges surrounding IRF1 and multiple sclerosis. To characterize this relationship, features are computed that measure the prevalence of a specific metapath between IRF1 and multiple sclerosis. D) Two features (for the GeTlD and GiGaD metapaths) are calculated to describe the relationship between IRF1 and multiple sclerosis. The metric underlying the features is degree-weighted path count (DWPC). First, for the specified metapath, all paths are extracted from the network. Next, each path receives a path-degree product (PDP) measuring its specificity (calculated from node-degrees along the path, D path). This step requires a damping exponent (here w = 0.5), which adjusts how severely high-degree paths are downweighted. Finally, the path-degree products are summed to produce the DWPC.
Fig 3
Fig 3. Predicting associations withheld for testing.
Performance was evaluated on 25% of gene-disease pairs withheld for testing. A) Testing and training ROC curves. At top prediction thresholds, associated gene-disease pairs are recalled at a much higher rate than unassociated pairs are incorrectly classified as positives. The testing area under the curve (AUROC) is slightly greater than the training AUROC, demonstrating the method’s lack of overfitting. Performance greatly exceeds random denoted by gray line. B) The precision-recall curve showing performance in the context of the low prevalence of associated gene-disease pairs (0.13%). Nevertheless, at top prediction thresholds, a high percentage of pairs classified as positives are truly associated. Prediction thresholds, shown as points and colored by value, align with the observed precision at that threshold.
Fig 4
Fig 4. Feature selection identifies a parsimonious yet predictive model.
Ridge and lasso models were fit from the complete network. The resulting standardized coefficients (y-axis) assess the effect size of each feature (x-axis). Brackets indicate features from MSigDB-traversing metapaths (Gm{}mGaD). The ridge model disperses effects amongst features whereas the lasso concentrates effects. The lasso identifies an 8-feature model with minimal performance loss compared to the ridge model. Besides KEGG, gene-set based features were largely captured by Perturbations. The lasso retains several measures of pleiotropy as well as the one-step interactome feature (GiGaD).
Fig 5
Fig 5. Decomposing performance shows the superiority of the integrative model and compares individual features.
Disease, feature, and model-specific performance on the complete network. The AUROC (y-axis) was calculated for each classifier (x-axis). In addition to the ridge and lasso models (rightmost panels), each feature was considered as a classifier. Line segments show the classifier’s global performance (average performance across permuted networks shown in violet as opposed to dark grey). Points indicate disease-specific performance and are colored by the disease’s pathophysiology. Grey rectangles show the 95% confidence interval for mean disease-specific performance. A) Features from metapaths that traverse an MSigDB collection. B) Features from non-MSigDB-traversing metapaths. Metapaths are abbreviated using first letters of metanodes (uppercase, Table 1) and metaedges (lowercase, Table 2). Feature descriptions are provided in S1 Table.
Fig 6
Fig 6. Prioritizing multiple sclerosis associations identified by a masked GWAS.
From a network with the WTCCC2 MS associations omitted, we predicted probabilities of association for all potentially novel genes. The 37 novel genes identified by the WTCCC2 GWAS were considered positives, and the resulting performance was plotted. The ROC (A) and precision-recall (B) curves show performance, with AUCs in line with the testing performance across all diseases. A prediction threshold (black cross) that resulted in high performance was selected as the discovery threshold for further analysis. As the classification threshold decreases along the precision-recall curve, the advent of each true positive is denoted by its gene symbol.

References

    1. (2010) On beyond GWAS. Nat Genet 42: 551 10.1038/ng0710-551 - DOI - PubMed
    1. Goldstein DB (2009) Common genetic variation and human traits. N Engl J Med 360: 1696–1698. 10.1056/NEJMp0806284 - DOI - PubMed
    1. Hirschhorn JN (2009) Genomewide association studies—illuminating biologic pathways. N Engl J Med 360: 1699–1701. 10.1056/NEJMp0808934 - DOI - PubMed
    1. Kraft P, Hunter DJ (2009) Genetic risk prediction—are we there yet? N Engl J Med 360: 1701–1703. 10.1056/NEJMp0810107 - DOI - PubMed
    1. Welter D, MacArthur J, Morales J, Burdett T, Hall P, Junkins H, et al. (2014) The NHGRI GWAS Catalog, a curated resource of SNP-trait associations. Nucleic Acids Res 42: D1001–1006. 10.1093/nar/gkt1229 - DOI - PMC - PubMed

Publication types