Agriculture intensifies soil moisture decline in Northern China
- PMID: 26158774
- PMCID: PMC4497304
- DOI: 10.1038/srep11261
Agriculture intensifies soil moisture decline in Northern China
Abstract
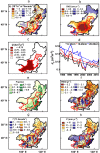
Northern China is one of the most densely populated regions in the world. Agricultural activities have intensified since the 1980s to provide food security to the country. However, this intensification has likely contributed to an increasing scarcity in water resources, which may in turn be endangering food security. Based on in-situ measurements of soil moisture collected in agricultural plots during 1983-2012, we find that topsoil (0-50 cm) volumetric water content during the growing season has declined significantly (p < 0.01), with a trend of -0.011 to -0.015 m(3) m(-3) per decade. Observed discharge declines for the three large river basins are consistent with the effects of agricultural intensification, although other factors (e.g. dam constructions) likely have contributed to these trends. Practices like fertilizer application have favoured biomass growth and increased transpiration rates, thus reducing available soil water. In addition, the rapid proliferation of water-expensive crops (e.g., maize) and the expansion of the area dedicated to food production have also contributed to soil drying. Adoption of alternative agricultural practices that can meet the immediate food demand without compromising future water resources seem critical for the sustainability of the food production system.
Figures


References
-
- Wang A., Lettenmaier D. P. & Sheffield J. Soil moisture drought in China, 1950–2006. J Climate 24, 3257–3271 (2011).
-
- Pandey S. & Bhandari H. S. [Chapter 1 Introduction] Economic Costs of Drought and Rice Farmers’ Coping Mechanisms: A Cross-Country Comparative Analysis , [Pandey S., Bhandari H. S., Hardy B. (ed.)] [1–10] (International Rice Research Institute, Los Baños, Philippines, 2007).
-
- Sheffield J., Wood E. F. & Roderick M. L. Little change in global drought over the past 60 years. Nature 491, 435–438 (2012). - PubMed
-
- Zou X., Zhai P. & Zhang Q. Variations in droughts over China: 1951–2003. Geophys Res Lett 32, doi:10.1029/2004GL021853 (2005).
-
- Ma Z. & Fu C. Some evidence of drying trend over northern China from 1951 to 2004. Chinese Science Bulletin 51, 2913–2925 (2006).
Publication types
MeSH terms
Substances
Grants and funding
LinkOut - more resources
Full Text Sources
Other Literature Sources

