. 2015 Jul 9:6:7683.
doi: 10.1038/ncomms8683.

Gap geometry dictates epithelial closure efficiency

Affiliations

Gap geometry dictates epithelial closure efficiency

Andrea Ravasio et al. Nat Commun. .

Abstract

Closure of wounds and gaps in tissues is fundamental for the correct development and physiology of multicellular organisms and, when misregulated, may lead to inflammation and tumorigenesis. To re-establish tissue integrity, epithelial cells exhibit coordinated motion into the void by active crawling on the substrate and by constricting a supracellular actomyosin cable. Coexistence of these two mechanisms strongly depends on the environment. However, the nature of their coupling remains elusive because of the complexity of the overall process. Here we demonstrate that epithelial gap geometry in both in vitro and in vivo regulates these collective mechanisms. In addition, the mechanical coupling between actomyosin cable contraction and cell crawling acts as a large-scale regulator to control the dynamics of gap closure. Finally, our computational modelling clarifies the respective roles of the two mechanisms during this process, providing a robust and universal mechanism to explain how epithelial tissues restore their integrity.


Figures
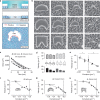
Figure 1
Figure 1. Closure of gaps and wounds of different geometries is curvature-dependent.
(a) Cartoons showing in vitro generation of damage-free gaps in an epithelial wound model experiment. Top, a PDMS stencil serves as a block to create damage-free gaps with well-defined geometries. Middle, after removal of the stencil, epithelial cells move into the voided area. Bottom, top view of a gap after removal of the stencil. In this paper, the epithelium protruding into the gap (where the tissue is locally convex) is defined as having a positive curvature. Conversely, concave regions are defined as being negatively curved. (b) Example time lapses of gap closure. Voids of varying geometries were created in confluent and mature epithelia. Scale bar, 50 μm. (c) Decay in the area of differently shaped gaps over time (n=15–18). (d) The cartoon shows the six different moon-like gaps used to test dependence of velocity on local curvature. The edge movement velocity is measured at the intersection between dashed line and the north (negative curvature) or south pole (flat or positive) of the gap. Bar plots display the edge movement velocity measured at the intersection between the dashed line and the north (negative curvature=textured bars) or south pole (flat or positive curvature=full bars) of the gap. (e) Plot of velocity as a function of curvature from the experiments shown in d. Empty and full circles correspond to top and bottom bar plots in d, respectively. The dashed line indicates linear fitting of data as a visual guide. Stars indicate a statistically significant difference of velocity (P<0.05; n=12–23). (fh) Velocity plots of randomly chosen points at the edge of gaps as in b. Logarithmic fitting (best fit; R2=0.89–0.98) of experimental data are shown by dashed line as a visual guide (n=15–18). Insets, overlay of outlines at different time points from representative experiments. Error bars indicate s.e.m. Samples are considered statistically different for P<0.05 in unpaired Student's t-test and are indicated by the star.
Figure 2
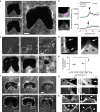
Figure 2. Crawling and purse-string show curvature dependence.
(a) Immunofluorescence for cortactin, phosphomyosin light chain and actin localization 15 min after stencil removal. Staining of phoshorylated myosin light chain (top left) and cortactin (bottom left) and actin (right). Scale bar, 20 μm. (b) Left, enlarged view of negative and positive regions (grey, actin; green, cortactin and magenta, phosphomyosin). Right, fluorescence intensity line profiles of the dashed lines. (c) Time lapse of gap closure visualized by DIC (top) and GFP-Actin in stably transfected MDCK cells (bottom). GFP-Actin levels vary between cells, and thus cannot be used for quantitative comparison. Kp1 and Kn1 are lines used to generate kymographs in g. Scale bar, 20 μm. (d) Enlarged view of boxes in c. Scale bar, 10 μm. (e) Percentage of lamellipodia occupancy of the edge as a function of the local curvature. The gap edge is subdivided into three regions according to their curvature. Length of the edge occupied by lamellipodia is expressed as a percentage of the total length of that particular region. Measurements are taken from still images 15 min after the removal of the stencil (P<0.05; n=63 independent regions from 17 experiments). (f) Examples of in vivo wound closure with varying geometries. Wounds were made with laser microsurgery on notum epithelia of D. melanogaster pupa expressing mCherry-Moesin as a marker for actin (top) and Spaghetti-Squash-GFP as a myosin marker (bottom). Kp2 and Kn2 are lines used to generate kymographs in g. Scale bar, 50 μm. (g) Kymographs from the lines in c,f. Lamellipodia protrusion at positive regions were more persistent then those at negative once. Scale bar for top panels, 10 μm; for bottom panels, 5 μm. (h) Enlarged view of boxes in f. In all images, arrowheads indicate the actomyosin cable and arrows indicate lamellipodia. Error bars indicate for s.e.m. Samples are considered statistically different for P<0.05 in unpaired Student's t-test and are indicated by the star.
Figure 3
Figure 3. Focal adhesions and traction forces at the gap edge.
(a) Left, immunofluorescence staining of actin (red) and paxillin (green) at 15 min after removal of the stencils show the distribution and orientation of focal adhesions at the gap edge. Top right, representative super resolved (SIM) images were used to quantify angular orientation of focal adhesions (bottom) at different curvatures (N, negative, P, positive). Data represent cumulative counts from four independent gaps. Scale bar, 20 μm. (b) Analysis of force distribution. Contrast of force vectors scales with magnitude (dark blue for forces >15 nN). (c) Enlarged view of dashed boxes in b, showing the evolution of force distribution over time. (d) Force magnitude plot in negatively (N) and positively (P) curved regions. Bulk shows the average force magnitude in regions >15 μm away from the edge. Force magnitudes are the average force per pillar in indicated regions. Experiments were performed in triplicate. (e) Force magnitudes at different regions are decomposed into their parallel (//) and perpendicular components (⊥). The values shown are the average force measured from all pillars in the specified regions for a 1-h experiment. Experiments were performed in triplicate. (f) Example of force traces of a pair of pillars engaged in a force dipole at a negatively curved region. (g) Example of force traces of pillars engaged in the crawling mechanism at a positively curved region. Error bars indicate s.e.m. Samples are considered statistically different for P<0.05 in unpaired Student's t-test and are indicated by the star.
Figure 4
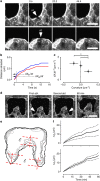
Figure 4. Laser ablation of the purse-string cable.
(a) Examples of laser microsurgery at positive and negative curvatures. Retraction of the cable (relaxation of elastic tension) can be visualized over time. Arrowheads show the site of ablation. Scale bar, 20 μm. (b) Measurement of cable retraction after laser ablation as shown in a. Initial velocity of retraction (dXi dt1) is a function of the elastic tension. (c) Plot of the initial retraction velocity after ablation as a function of the curvature of the edge (P<0.05; n=76 independent regions from nine independent gaps). (d) Laser ablation of two sides of a positively curved region causes release in tension and allows crawling to advance the protrusion. Arrowheads show the site of ablation. Scale bar, 50 μm. (e) Overlays of the gap edge at different times after laser abaltion. Δxp is distance crawled by the tip of the finger. Δxn is the average advancement of the two negatively curved regions. (f) Top, advancement of the tip of the finger (Δxp) over time. Bottom, average distance travelled by the negative regions (Δxn) over time. Experiments were performed in quadruplicate. Error bars and dashed lines indicate s.e.m. Samples are considered statistically different for P<0.05 in unpaired Student's t-test and are indicated by the star.
Figure 5
Figure 5. Fibronectin concentration and pharmacological inhibition influence cell-crawling and purse-string contraction.
Top row, area decay of the gap over time. The linear fitting of experimental data is shown by the dashed line. Insets, overlay impression of outlines at different time points from representative experiments. Bottom row, relation between velocity–curvature. Logarithmic (best fit for a; R2=0.94-0.97) and linear fitting (best fit for b,c) of experimental data are shown by dashed line as guide of the eyes. (a) Closure of gaps on substrates coated with 5, 20 and 40 μg ml−1 fibronectin (n=15–19). Inset, representative experiment with 20 μg ml−1 fibronectin. (b) Blebbistatin inhibition of myosin II (50 μM) tested at 20 and 40 μg ml−1 of fibronectin (n=9–19). Inset, myosin II inhibition at 40 μg ml−1 fibronectin. (c) CK666 inhibition of the ARP2/3 complex (10 and 100 μM) tested at 20 and 40 μg ml−1 fibronectin (n=5–11). Inset, ARP2/3 inhibition at 10 μM CK666 and 20 μg ml−1 fibronectin. Error bars are s.e.m.
Figure 6
Figure 6. Simulation and mathematical model.
(a) Cartoon showing the model of the mechanical coupling between purse-string and crawling mechanisms. Red and blue arrows indicate the direction and magnitude of the local stress induced by purse-string and crawling, respectively. Stress pulling the edge of the gap results from the arithmetic sum of purse-string and crawling stresses. (b) In silico simulation of gap closure. Cell–cell interactions throughout the tissue are modelled as viscous drag. Cell–substrate interaction contributes as a frictional component. Stresses at the edge are as in a. (c) Comparison of experimental and simulation results. Lines indicate logarithmic fits (best fit; R2=0.88–0.97) of the data points as a visual guide. (d) Simulation showing the contribution of crawling and purse-string mechanisms separately. Red (only purse-string) and blue (only crawling) lines are logarithmic and linear fits, respectively. The green line is the arithmetic sum of red and blue fits. Line fittings from c (black lines) are displayed for comparison. (e) Line fittings from d are used to illustrate the relationship between local curvature, gap size and the closure mechanism.

References

    1. Jacinto A., Martinez-Arias A. & Martin P. Mechanisms of epithelial fusion and repair. Nat. Cell Biol. 3, E117–E123 (2001). - PubMed
    1. Jacinto A., Woolner S. & Martin P. Dynamic analysis of dorsal closure in Drosophila: from genetics to cell biology. Dev. Cell 3, 9–19 (2002). - PubMed
    1. Marinari E. et al. Live-cell delamination counterbalances epithelial growth to limit tissue overcrowding. Nature 484, 542–545 (2012). - PubMed
    1. Rosenblatt J., Raff M. C. & Cramer L. P. An epithelial cell destined for apoptosis signals its neighbors to extrude it by an actin- and myosin-dependent mechanism. Curr. Biol. 11, 1847–1857 (2001). - PubMed
    1. Shaw T. J. & Martin P. Wound repair at a glance. J. Cell Sci. 122, 3209–3213 (2009). - PMC - PubMed

Publication types

LinkOut - more resources