. 2015 Jul 28;112(30):E4065-74.
doi: 10.1073/pnas.1421946112. Epub 2015 Jul 9.

Climate change and decadal shifts in the phenology of larval fishes in the California Current ecosystem

Affiliations

Climate change and decadal shifts in the phenology of larval fishes in the California Current ecosystem

Rebecca G Asch. Proc Natl Acad Sci U S A. .

Abstract

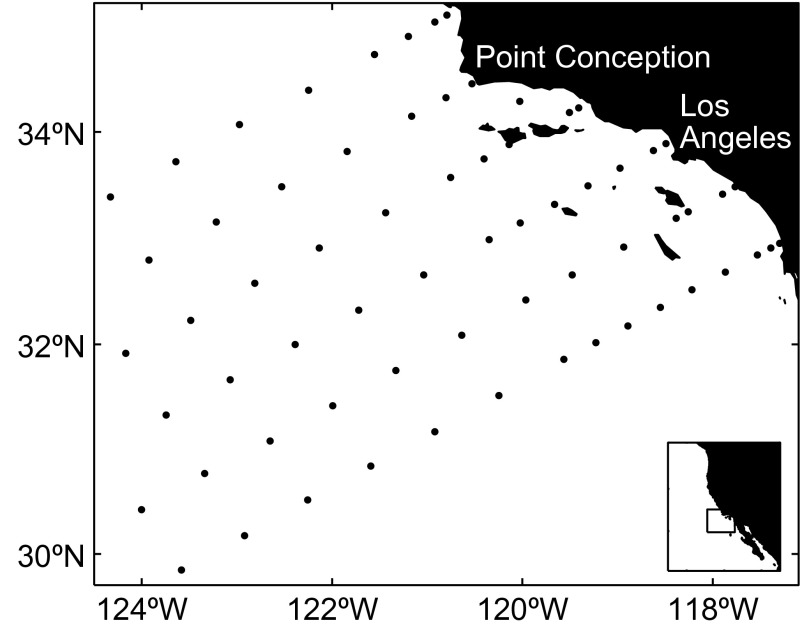
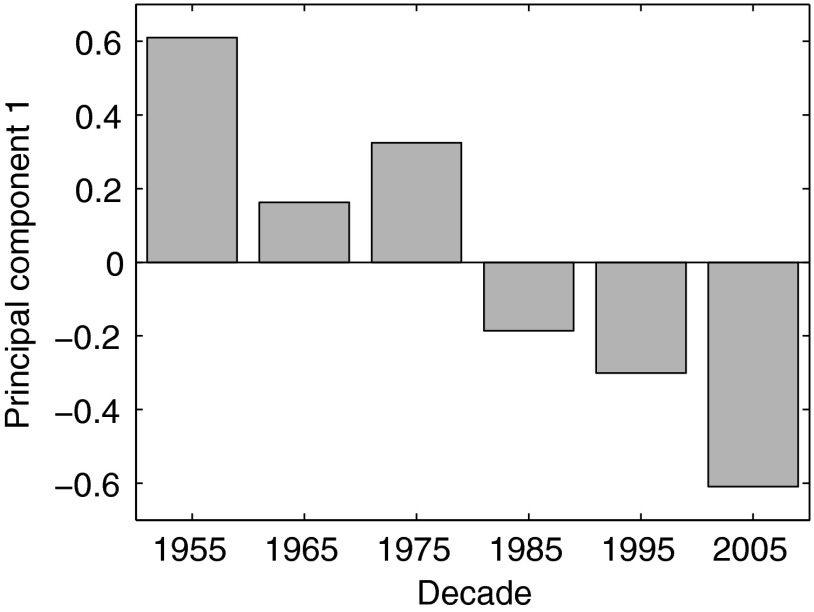
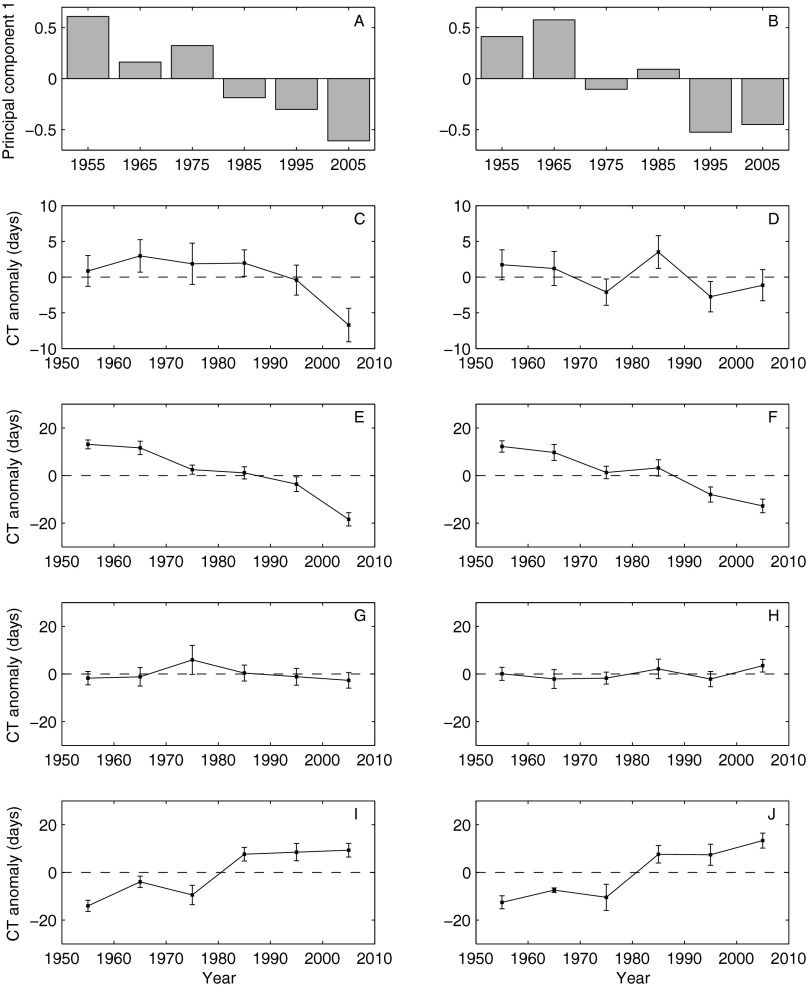
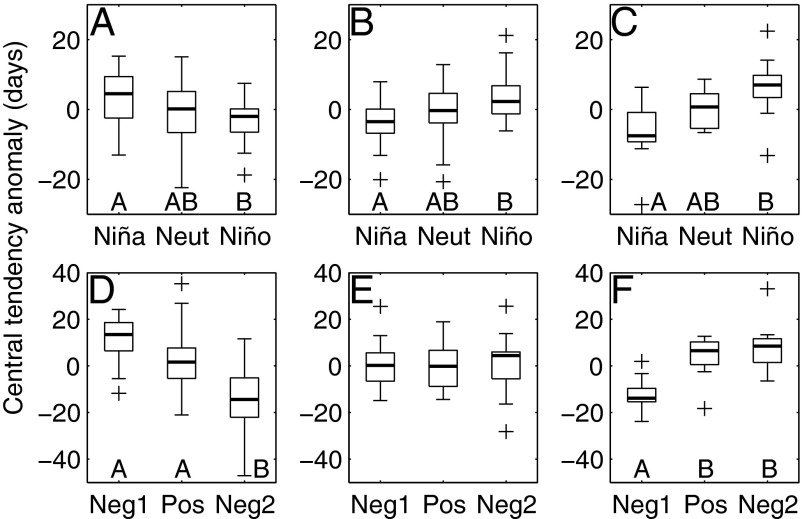
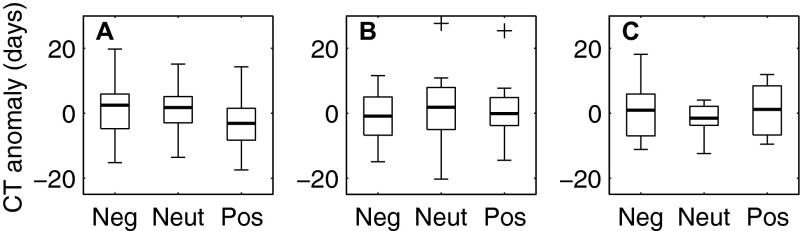
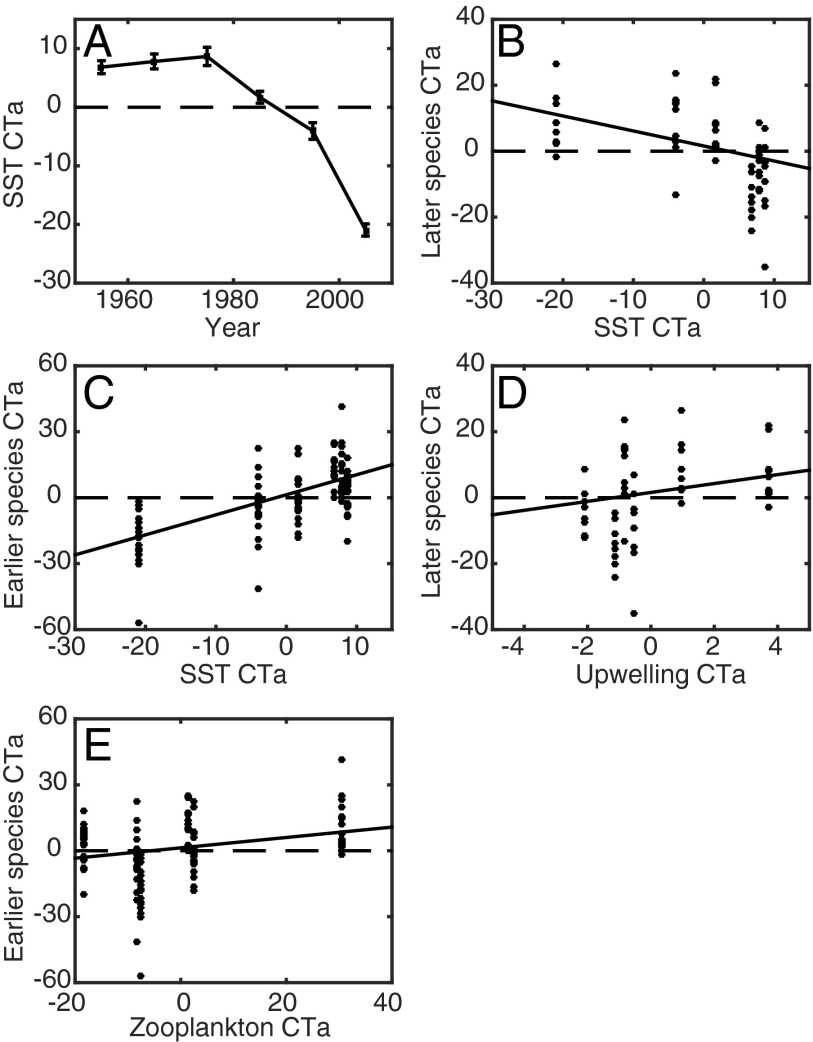
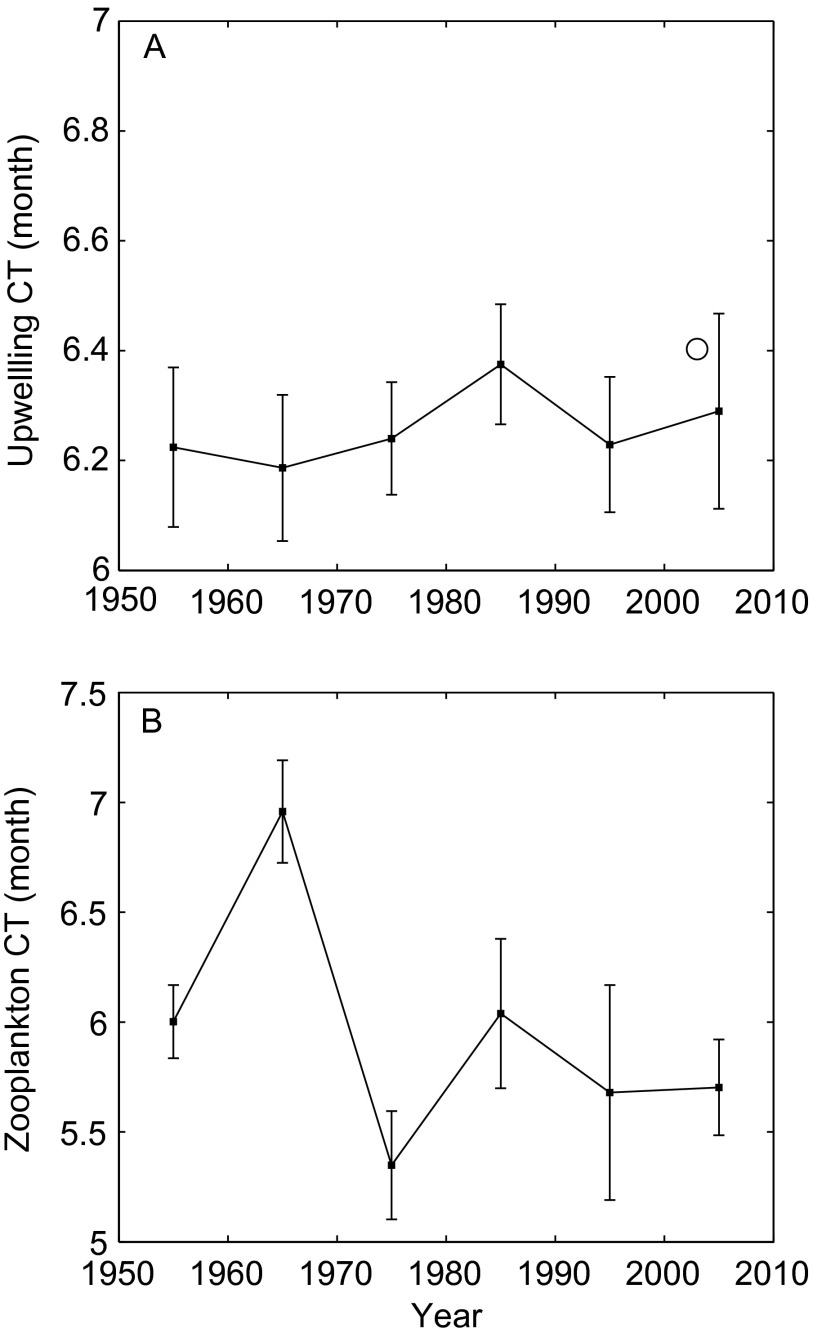
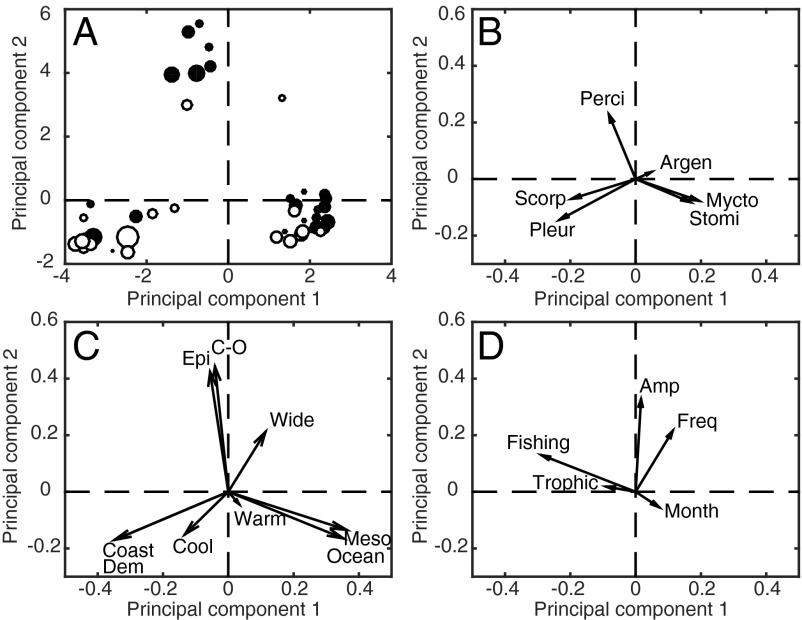
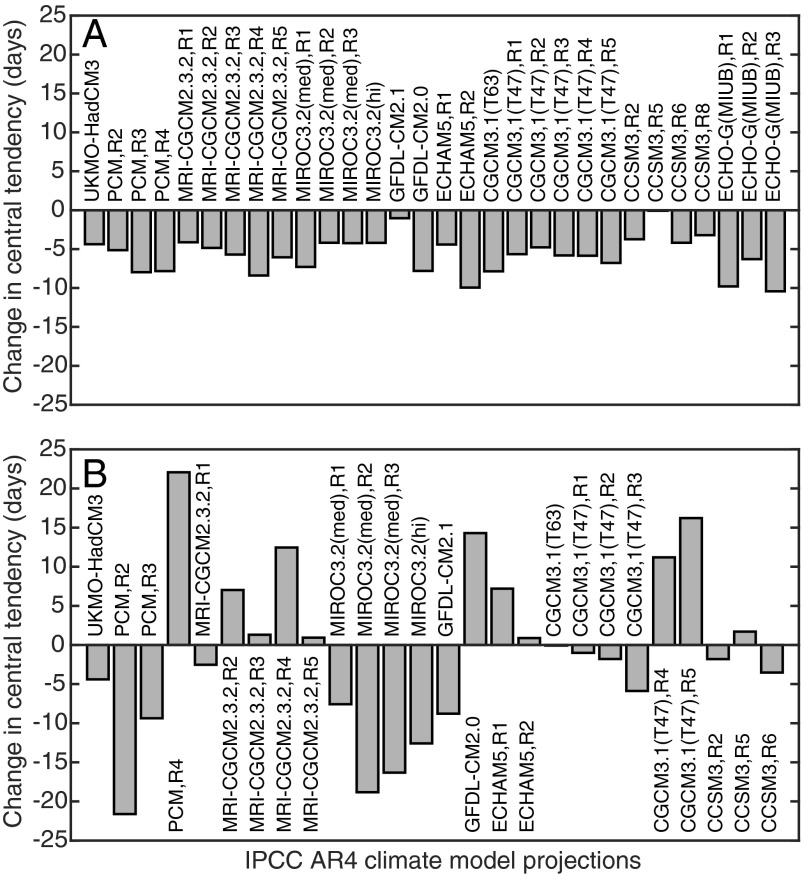
Climate change has prompted an earlier arrival of spring in numerous ecosystems. It is uncertain whether such changes are occurring in Eastern Boundary Current Upwelling ecosystems, because these regions are subject to natural decadal climate variability, and regional climate models predict seasonal delays in upwelling. To answer this question, the phenology of 43 species of larval fishes was investigated between 1951 and 2008 off southern California. Ordination of the fish community showed earlier phenological progression in more recent years. Thirty-nine percent of seasonal peaks in larval abundance occurred earlier in the year, whereas 18% were delayed. The species whose phenology became earlier were characterized by an offshore, pelagic distribution, whereas species with delayed phenology were more likely to reside in coastal, demersal habitats. Phenological changes were more closely associated with a trend toward earlier warming of surface waters rather than decadal climate cycles, such as the Pacific Decadal Oscillation and North Pacific Gyre Oscillation. Species with long-term advances and delays in phenology reacted similarly to warming at the interannual time scale as demonstrated by responses to the El Niño Southern Oscillation. The trend toward earlier spawning was correlated with changes in sea surface temperature (SST) and mesozooplankton displacement volume, but not coastal upwelling. SST and upwelling were correlated with delays in fish phenology. For species with 20th century advances in phenology, future projections indicate that current trends will continue unabated. The fate of species with delayed phenology is less clear due to differences between Intergovernmental Panel on Climate Change models in projected upwelling trends.

Keywords: California Current; fish larvae; global change biology; phenology; upwelling ecosystem.


Conflict of interest statement

The author declares no conflict of interest.

Figures

Fig. S1.
Fig. S1.
Sites where larval fish abundance was sampled. The rectangular box in the inset map shows the location of the study region relative to the West Coast of North America.
Fig. 1.
Fig. 1.
First principal component of the central tendency of seasonal occurrence of larval fishes. Positive values of eigenvectors on the y axis indicate later occurrence of larvae, whereas negative values indicate earlier occurrence.
Fig. S2.
Fig. S2.
Decadal trends in the CT of larval fishes based on the full dataset (Left) and a partial dataset where May, September, and December were removed (Right). The partial dataset was used to examine any biases due to lack of sampling during these months in the 2000s. (A and B) Eigenvectors for each decade from the first principal component of the CT of larval fishes. Decadal means and SEs of the CT of all fish phenophases (C and D; n = 290), phenophases with earlier phenology (E and F; n = 110), phenophases with no long-term, linear trend in phenology (G and H; n = 128), and phenophases with later phenology (I and J; n = 52).
Fig. 2.
Fig. 2.
Effects of El Niño-Southern Oscillation (A–C) and Pacific Decadal Oscillation (PDO; D–F) on species displaying earlier phenology (Left; n = 60), no long-term, linear change in phenology (Center; n = 66), and later phenology (Right; n = 27). In each box plot, the darkened line indicates the median; boxes show the interquartile range; whiskers indicate the expected extent of 99% of the data for a Gaussian distribution, and crosses show outliers. Two outliers fall outside the range displayed in A. Capital letters below boxes indicate means that differ significantly at P < 0.05 based on Tukey-Kramer multiple comparison tests. (A–C) El Niño, neutral (Neut), and La Niña conditions based on the Oceanic Niño Index. (D–F) Neg1, cold-phase PDO between 1951 and 1976; Pos, warm-phase PDO from 1977 to 1998; Neg2, cold-phase PDO during 1999–2002 and 2007–2008.
Fig. S3.
Fig. S3.
Effects of the NPGO on the seasonal CT of fish species displaying earlier phenology (A; n = 60), no long-term, linear change in phenology (B; n = 66), and later phenology (C; n = 27). In each box plot, the darkened line indicates the median; boxes show the interquartile range; whiskers indicate the expected extent of 99% of the data for a Gaussian distribution, and crosses show outliers. Neg, NPGO index ≤−0.5; Neut, NPGO index between −0.5 and 0.5; Pos, NPGO index ≥0.5. ANOVA results for earlier species: F2,57 = 1.6, P = 0.22; species without a linear trend: F2,63 = 0.2, P = 0.81; later species: F2,24 = 0.5, P = 0.61.
Fig. 3.
Fig. 3.
Responses of the phenology of larval fishes to changes in the central tendency (CT) of SST, zooplankton displacement volume, and the Bakun upwelling index at 33°N and 119°W. Units of all CT anomalies (CTa) are days. (A) Decadal changes in SST CT. SEs from bootstrap analysis are shown. (B–E) Multiple regression equations shown in Table S5. Variables included in a given regression, but not displayed on these bivariate plots, were held constant at a CT anomaly of zero.
Fig. S4.
Fig. S4.
Decadal changes in the CT of the Bakun upwelling index at 33°N and 119°W (A) and zooplankton volume from CalCOFI (B); 95% CIs from bootstrap analysis are shown. The white circle in A denotes the decadal CT of upwelling velocity within the CalCOFI area based on data from the QuikSCAT scatterometer.
Fig. 4.
Fig. 4.
Principal components analysis performed on ecological traits (n = 51). (A) Species ordination. Marker size is proportional to changes in CT. Black (white) dots indicate species whose CT has a negative (positive) slope when regressed against year. (B) Eigenvectors of taxonomic orders. Stomi, Stomiiformes; Perci, Perciformes; Scorp, Scorpaeniformes; Mycto, Myctophiformes; Argen, Argentiniformes; Pleur, Pleuronectiformes. (C) Eigenvectors of adult fish habitat (epipelagic, mesopelagic, demersal), cross-shore distribution [coastal, coastal-oceanic (C-O), oceanic], and biogeographic affinity (cool water, warm water, widespread). (D) Eigenvectors of adult trophic level, fishing status, month of maximum larval abundance, frequency of occurrence, and amplitude of the seasonal cycle.
Fig. 5.
Fig. 5.
Projected changes in the phenology of larval fishes between 2000–2009 and 2090–2099 based on climate models from the IPCC Fourth Assessment Report. All projections are based on IPCC scenario A1B. Abbreviated IPCC names for each model are shown. (A) Species whose phenology became earlier during the 20th century. (B) Species whose phenology became later during the 20th century.

References

    1. Parmesan C, Yohe G. A globally coherent fingerprint of climate change impacts across natural systems. Nature. 2003;421(6918):37–42. - PubMed
    1. Root TL, et al. Fingerprints of global warming on wild animals and plants. Nature. 2003;421(6918):57–60. - PubMed
    1. Menzel A, et al. European phenological response to climate change matches the warming pattern. Glob Change Biol. 2006;12(10):1969–1976.
    1. Parmesan C. Influences of species, latitudes and methodologies on estimates of phenological response to global warming. Glob Change Biol. 2007;13(9):1860–1872.
    1. Poloczanska ES, et al. Global imprint of climate change on marine life. Nature Clim Change. 2013;3:919–925.

Publication types

LinkOut - more resources