. 2015 Sep 1;309(5):G324-40.
doi: 10.1152/ajpgi.00108.2015. Epub 2015 Jul 9.

Parkin regulates mitophagy and mitochondrial function to protect against alcohol-induced liver injury and steatosis in mice

Affiliations

Parkin regulates mitophagy and mitochondrial function to protect against alcohol-induced liver injury and steatosis in mice

Jessica A Williams et al. Am J Physiol Gastrointest Liver Physiol. .

Erratum in

  • Corrigendum.
    [No authors listed] [No authors listed] Am J Physiol Gastrointest Liver Physiol. 2016 Jan 15;310(2):G142. doi: 10.1152/ajpgi.zh3-7034-corr.2016. Am J Physiol Gastrointest Liver Physiol. 2016. PMID: 26772614 Free PMC article.

Abstract

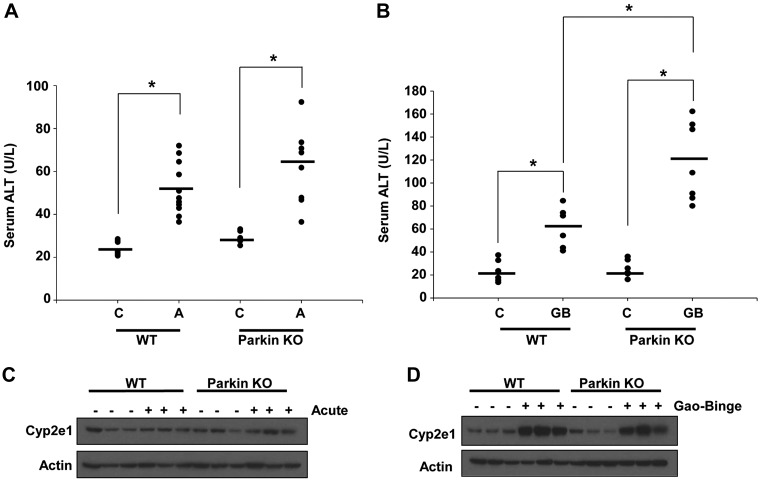
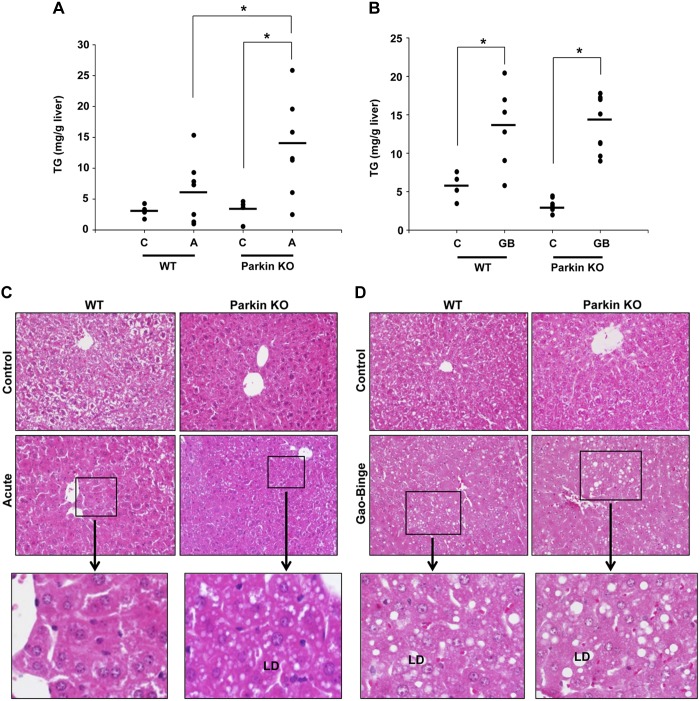
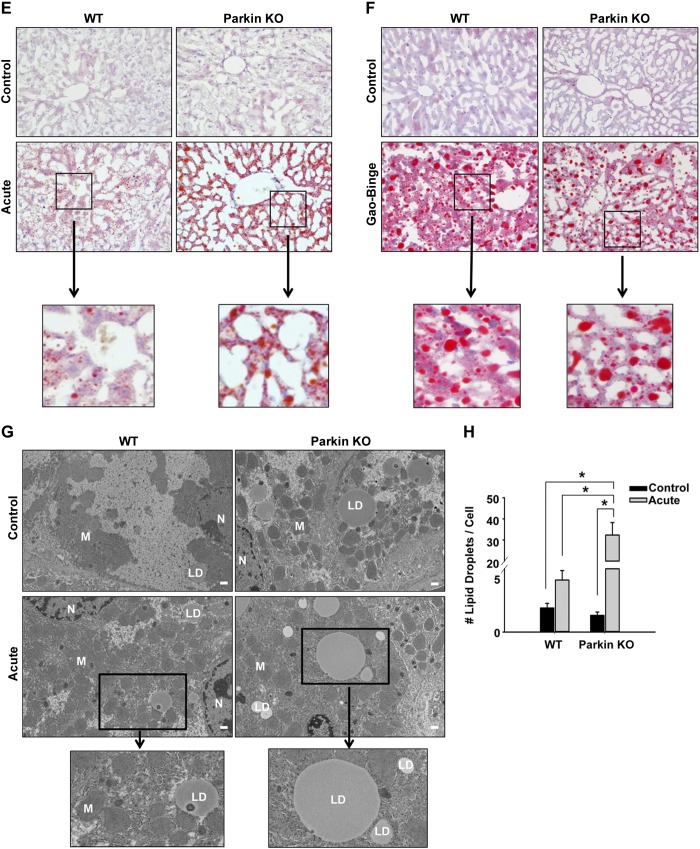
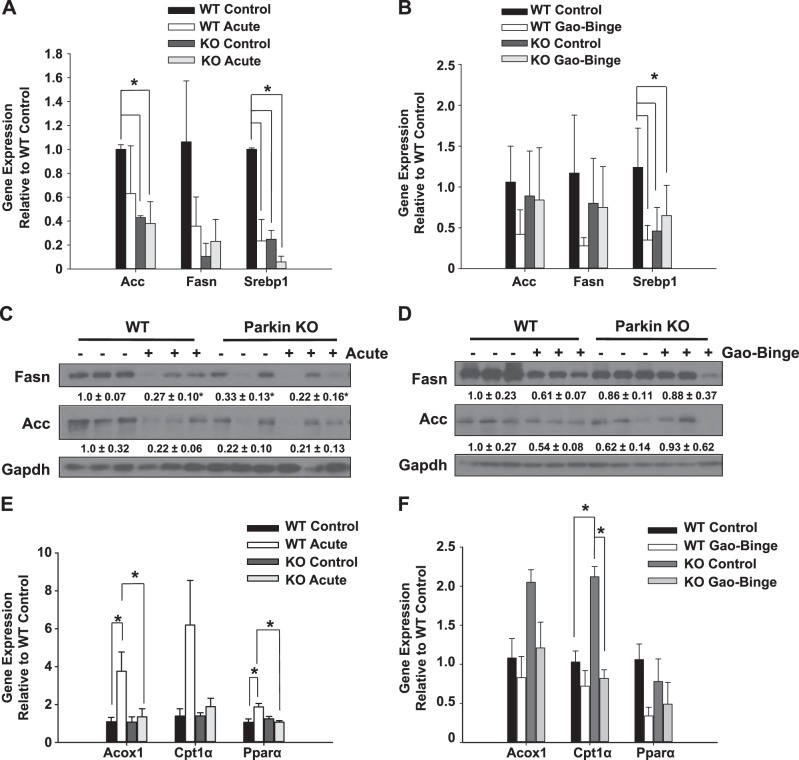
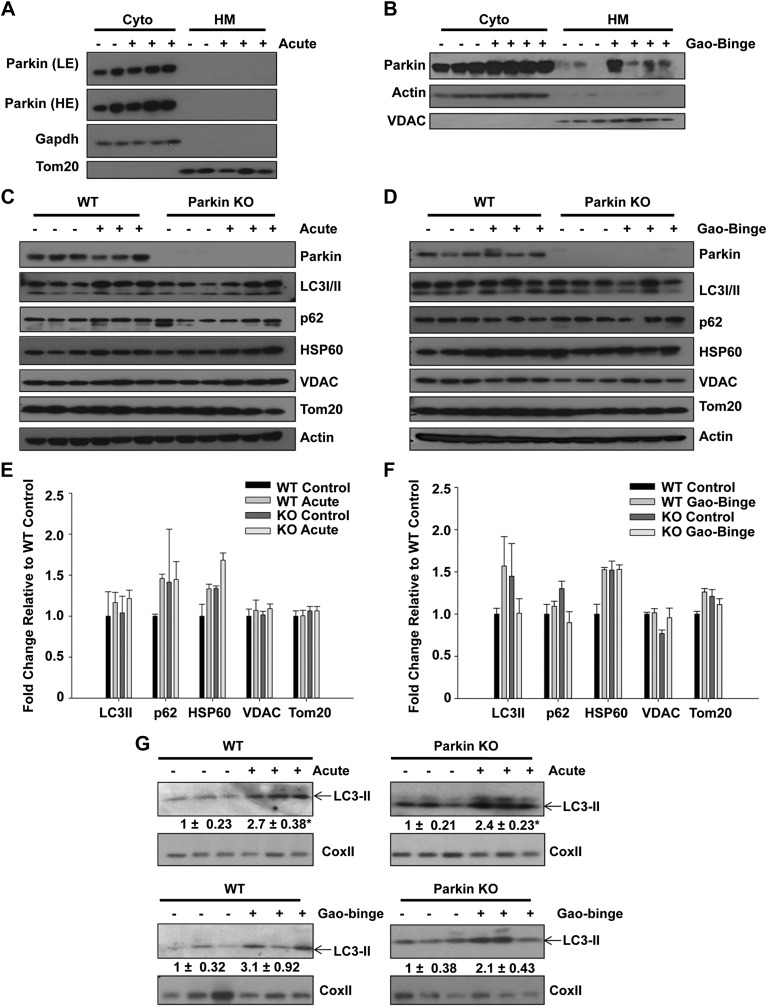
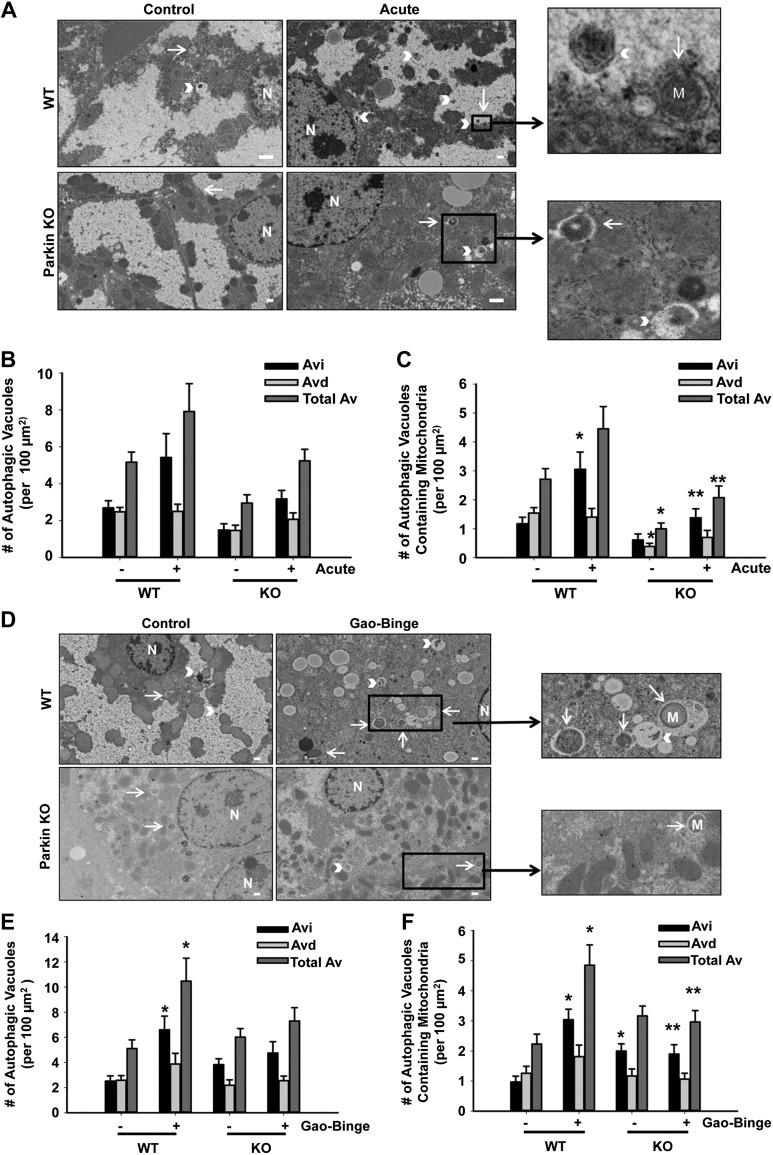
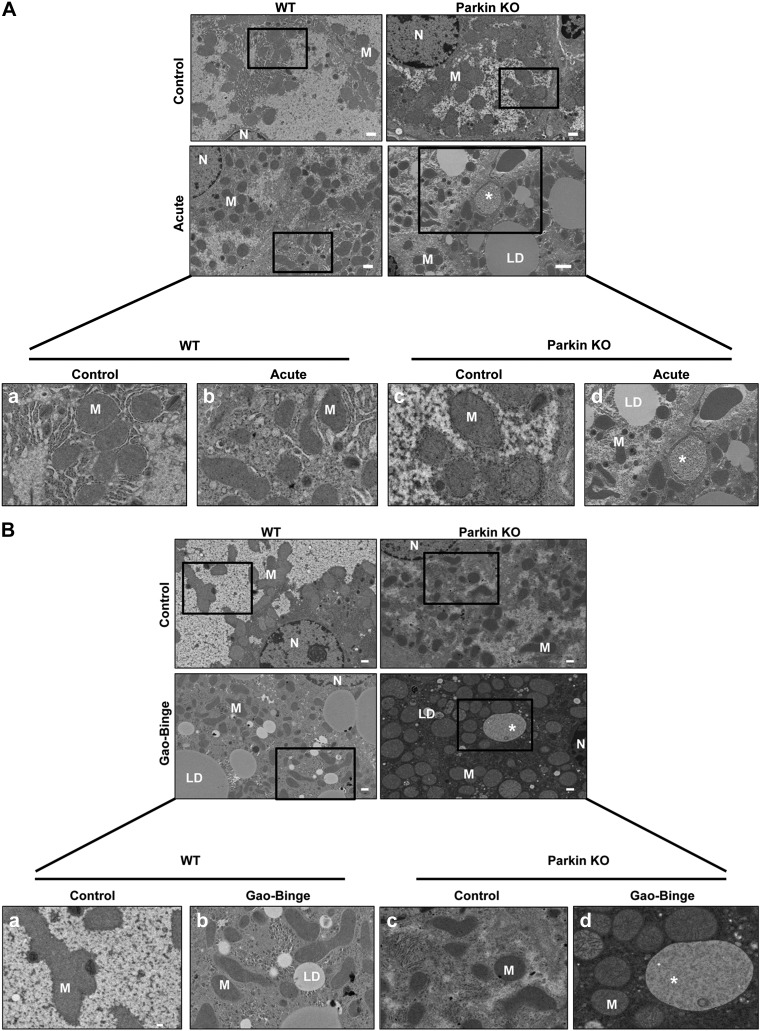
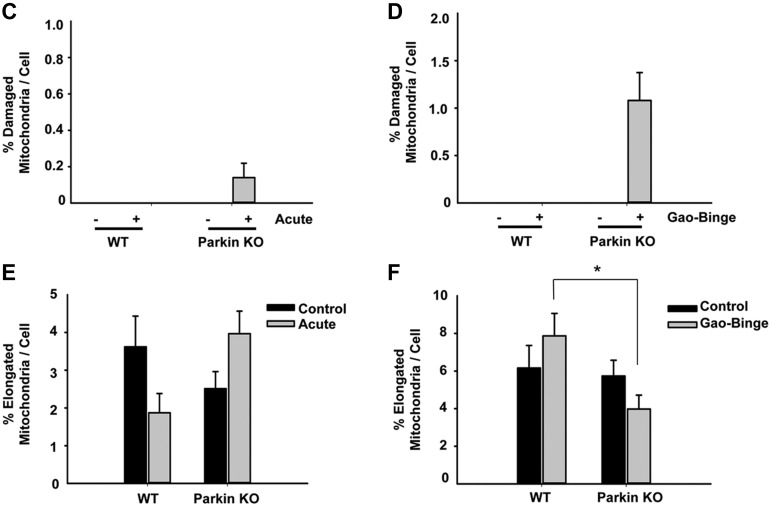
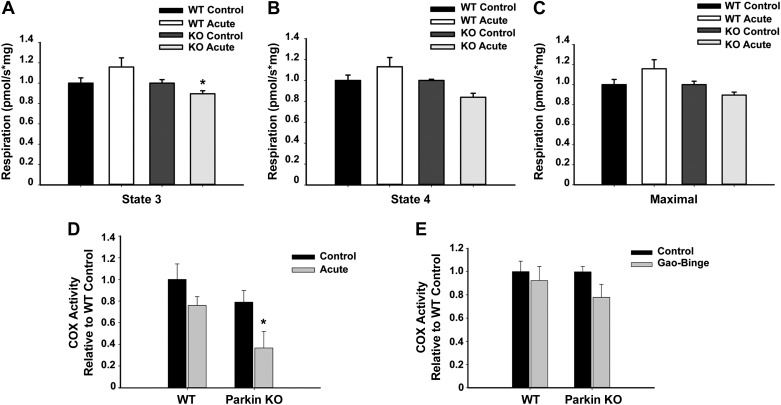
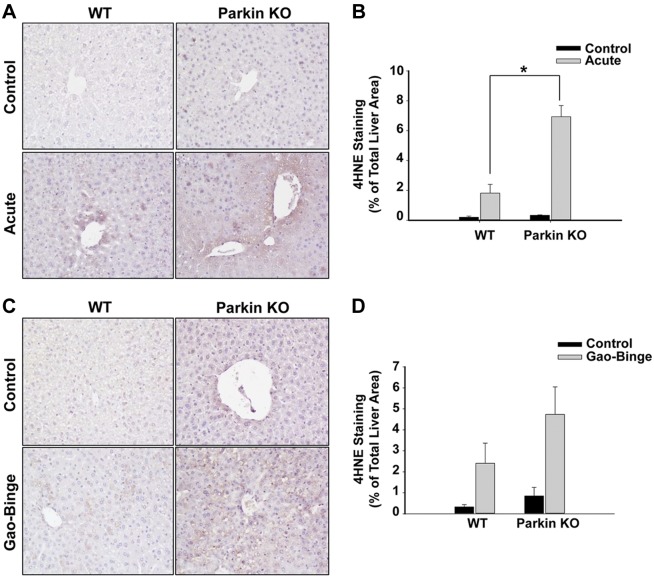
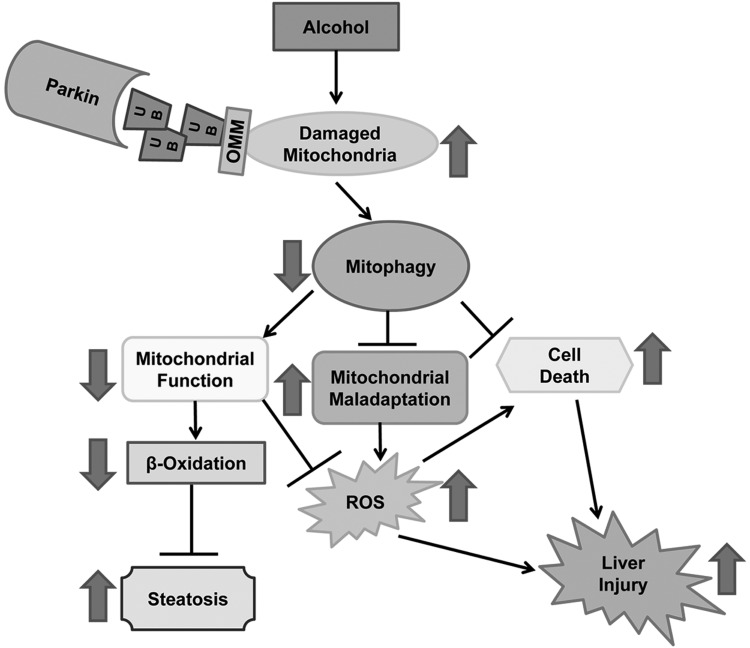
Alcoholic liver disease claims two million lives per year. We previously reported that autophagy protected against alcohol-induced liver injury and steatosis by removing damaged mitochondria. However, the mechanisms for removal of these mitochondria are unknown. Parkin is an evolutionarily conserved E3 ligase that is recruited to damaged mitochondria to initiate ubiquitination of mitochondrial outer membrane proteins and subsequent mitochondrial degradation by mitophagy. In addition to its role in mitophagy, Parkin has been shown to have other roles in maintaining mitochondrial function. We investigated whether Parkin protected against alcohol-induced liver injury and steatosis using wild-type (WT) and Parkin knockout (KO) mice treated with alcohol by the acute-binge and Gao-binge (chronic plus acute-binge) models. We found that Parkin protected against liver injury in both alcohol models, likely because of Parkin's role in maintaining a population of healthy mitochondria. Alcohol caused greater mitochondrial damage and oxidative stress in Parkin KO livers compared with WT livers. After alcohol treatment, Parkin KO mice had severely swollen and damaged mitochondria that lacked cristae, which were not seen in WT mice. Furthermore, Parkin KO mice had decreased mitophagy, β-oxidation, mitochondrial respiration, and cytochrome c oxidase activity after acute alcohol treatment compared with WT mice. Interestingly, liver mitochondria seemed able to adapt to alcohol treatment, but Parkin KO mouse liver mitochondria had less capacity to adapt to Gao-binge treatment compared with WT mouse liver mitochondria. Overall, our findings indicate that Parkin is an important mediator of protection against alcohol-induced mitochondrial damage, steatosis, and liver injury.

Keywords: Parkin; alcohol; autophagy; liver injury; mitophagy; steatosis.


Figures

Fig. 1.
Fig. 1.
Alcohol induced more liver injury in Parkin knockout (KO) mice. A and B: serum alanine aminotransferase (ALT) levels were measured from wild-type (WT) and Parkin KO mice after treatment with alcohol by using the acute-binge (A) or Gao-binge (B) model. Data shown are means ± SE (n ≥ 5 mice per group; *P < 0.05 by 1-way ANOVA). C, control; A, acute-binge; GB, Gao-binge. C and D: WT and Parkin KO mice were treated with the acute-binge (C) or Gao-binge (D) model, and liver lysates were analyzed by Western blot. β-Actin was used as a loading control.
Fig. 2.
Fig. 2.
Parkin KO mice had increased liver steatosis compared with WT mice after acute-binge, but not Gao-binge, treatment. A and B: liver triglycerides (TG) were measured for WT and Parkin KO mice after acute-binge (A) and Gao-binge (B) alcohol treatment. Data shown are means ± SE (n = 4 for controls and ≥6 for alcohol-treated mice; *P < 0.05 by 1-way ANOVA). C and D: representative hematoxylin and eosin (H&E) images from the acute-binge model (C) and the Gao-binge model (D) are shown with boxed areas enlarged. LD, lipid droplet; ×200 magnification. E and F: representative images are shown for Oil Red O staining for the acute-binge model (E) and for the Gao-binge model (F) with boxed areas enlarged (×200 magnification). G: representative electron microscopy (EM) images are shown for acute-binge-treated mice with boxed areas enlarged (bar = 500 nm; N, nucleus; M, mitochondria). H: quantification of lipid droplets per cell in acute-binge-treated mice. Data shown are means ± SE (n ≥ 10 images per mouse from 2 mice per group; *P < 0.05 by 1-way ANOVA).
Fig. 2.
Fig. 2.
Parkin KO mice had increased liver steatosis compared with WT mice after acute-binge, but not Gao-binge, treatment. A and B: liver triglycerides (TG) were measured for WT and Parkin KO mice after acute-binge (A) and Gao-binge (B) alcohol treatment. Data shown are means ± SE (n = 4 for controls and ≥6 for alcohol-treated mice; *P < 0.05 by 1-way ANOVA). C and D: representative hematoxylin and eosin (H&E) images from the acute-binge model (C) and the Gao-binge model (D) are shown with boxed areas enlarged. LD, lipid droplet; ×200 magnification. E and F: representative images are shown for Oil Red O staining for the acute-binge model (E) and for the Gao-binge model (F) with boxed areas enlarged (×200 magnification). G: representative electron microscopy (EM) images are shown for acute-binge-treated mice with boxed areas enlarged (bar = 500 nm; N, nucleus; M, mitochondria). H: quantification of lipid droplets per cell in acute-binge-treated mice. Data shown are means ± SE (n ≥ 10 images per mouse from 2 mice per group; *P < 0.05 by 1-way ANOVA).
Fig. 3.
Fig. 3.
Steatosis in WT and Parkin KO alcohol-treated livers was due not to fatty acid synthesis but to decreased β-oxidation. WT and Parkin KO mice were treated with the acute-binge (A, C, and E) or Gao-binge (B, D, and F) model. A, B, E, and F: RNA from mouse livers was used to measure gene expression by quantitative PCR. Results were normalized to β-actin and expressed as fold change compared with WT control. Data shown are means ± SD (n = 3–4 mice per group; *P < 0.05 by 1-way ANOVA). C and D: protein was isolated from mouse livers for Western blot analysis. Results were normalized to Gapdh for densitometry analysis. Results from densitometry were expressed as fold change compared with WT control. Data shown are means ± SE (n = 3 mice per group; *P < 0.05 by 1-way ANOVA).
Fig. 4.
Fig. 4.
Western blot analysis was unable to detect induction of mitophagy after alcohol treatment. A and B: WT and Parkin KO mice were treated with alcohol by using the acute-binge (A) and Gao-binge (B) models, and liver cytosolic (Cyto) and heavy membrane (HM) fractions were isolated and analyzed by Western blot. β-Actin or Gapdh and VDAC or Tom20 were used as loading controls. C and D: WT and Parkin KO mice were treated with alcohol by using the acute-binge (C) or Gao-binge (D) model, and liver lysates were used for Western blot analysis. β-Actin was used as a loading control. E and F: densitometry quantification for blots in C and D, respectively. Data shown are means ± SE (n = 3 mice per group; no significant differences among groups by 1-way ANOVA). G: WT and Parkin KO mice were treated with alcohol by using the acute-binge or Gao-binge models, and HM fractions were used for Western blot analysis. Cox II was used as a loading control.
Fig. 5.
Fig. 5.
Decreased mitophagy in Parkin KO mice. A: representative EM images are shown for the acute-binge model with boxed areas enlarged (arrows represent autophagosomes, and arrowheads represent autolysosomes; bar = 500 nm). B and C: quantification of the number of autophagic vacuoles (B) and mitophagosomes (C) from EM in A. Data shown are means ± SE (n = 1 mouse per group, at least 15 images quantified per mouse; *P < 0.05 compared with WT control, **P < 0.05 compared with WT alcohol by 1-way ANOVA). Avi, autophagosomes; Avd, autolysosomes; AV, autophagic vacuoles. D: representative EM images are shown for the Gao-binge model with boxed areas enlarged (arrows represent autophagosomes, and arrowheads represent autolysosomes; bar = 500 nm). E and F: quantification of the number of autophagic vacuoles (E) and mitophagosomes (F) from EM in D. Data shown are means ± SE (n = 1 mouse per group, at least 15 images quantified per mouse; *P < 0.05 compared with WT control, **P < 0.05 compared with WT alcohol by 1-way ANOVA).
Fig. 6.
Fig. 6.
Analysis of mitochondrial morphology after alcohol treatment in WT and Parkin KO mice. A and B: representative EM images are shown from WT and Parkin KO mice treated with the acute-binge (A) or Gao-binge (B) model with boxed areas enlarged. a: WT control. b: WT alcohol. c: Parkin KO control. d: Parkin KO alcohol. *Severely damaged mitochondria. Bar = 500 nm with the exception of Ad, which is 2 μm. C and D: quantification of the number of severely damaged mitochondria shown in Ad and Bd in WT and Parkin KO mice after acute-binge (C) or Gao-binge (D) (n ≥ 10 images per mouse from 2 mice per group). E and F: quantification of the number of elongated mitochondria per cell in WT and Parkin KO mice after acute-binge (E) or Gao-binge (F). Data shown are means ± SE (n ≥ 10 images per mouse from 2 mice per group; *P < 0.05 by 1-way ANOVA).
Fig. 6.
Fig. 6.
Analysis of mitochondrial morphology after alcohol treatment in WT and Parkin KO mice. A and B: representative EM images are shown from WT and Parkin KO mice treated with the acute-binge (A) or Gao-binge (B) model with boxed areas enlarged. a: WT control. b: WT alcohol. c: Parkin KO control. d: Parkin KO alcohol. *Severely damaged mitochondria. Bar = 500 nm with the exception of Ad, which is 2 μm. C and D: quantification of the number of severely damaged mitochondria shown in Ad and Bd in WT and Parkin KO mice after acute-binge (C) or Gao-binge (D) (n ≥ 10 images per mouse from 2 mice per group). E and F: quantification of the number of elongated mitochondria per cell in WT and Parkin KO mice after acute-binge (E) or Gao-binge (F). Data shown are means ± SE (n ≥ 10 images per mouse from 2 mice per group; *P < 0.05 by 1-way ANOVA).
Fig. 7.
Fig. 7.
Mitochondrial respiration rates and cytochrome c oxidase (COX) activity were decreased in Parkin KO mice after alcohol treatment. AC: WT and Parkin KO mice were treated with alcohol by using the acute-binge model, and state 3 (A), state 4 (B), and maximal respiratory capacity (C) respiration rates were measured by Oroboros using isolated liver mitochondria. Data shown are means ± SE (n ≥ 3 mice per group; *P < 0.05 compared with WT alcohol by t-test). D and E: COX activity for WT and Parkin KO mouse livers treated with acute-binge (D) or Gao-binge (E). Data shown are means ± SE (n ≥ 3 mice per group; *P < 0.05 compared with WT control by 1-way ANOVA).
Fig. 8.
Fig. 8.
Lipid peroxidation was increased in Parkin KO mice compared with WT mice after alcohol treatment. AD: WT and Parkin KO mice were treated with alcohol by using the acute-binge (A and B) or Gao-binge (C and D) model. Representative images are shown from 4-hydroxynonenal (4HNE) immunohistochemistry after acute-binge (A) or Gao-binge (C) treatment, and data are represented as the percent (%) of positively stained areas compared with the total liver area [B (acute), D (Gao-Binge)]. Results shown are means ± SE (n ≥ 3 mice per group; *P < 0.05 compared with WT control by 1-way ANOVA).
Fig. 9.
Fig. 9.
Summary of the role of Parkin in alcohol-induced steatosis and liver injury. Parkin is protective against alcohol-induced liver injury, oxidative stress, and steatosis by promoting mitophagy. Decreased mitophagy due to the absence of Parkin may lead to impaired mitochondrial function, decreased β oxidation, increased reactive oxygen species, and lipid peroxidation as well as mitochondrial maladaptation (fewer elongated mitochondria and more swollen mitochondria), resulting in increased steatosis, cell death, and liver injury after alcohol treatment. Consequences of Parkin loss after alcohol treatment are shown by large arrows. ROS, reactive oxygen species; UB, ubiquitin; OMM, outer mitochondrial membrane protein.

Comment in

References

    1. Andringa KK, Udoh US, Landar A, Bailey SM. Proteomic analysis of 4-hydroxynonenal (4-HNE) modified proteins in liver mitochondria from chronic ethanol-fed rats. Redox Biol 2C: 1038–1047, 2014. - PMC - PubMed
    1. Bansal S, Liu CP, Sepuri NB, Anandatheerthavarada HK, Selvaraj V, Hoek J, Milne GL, Guengerich FP, Avadhani NG. Mitochondria-targeted cytochrome P450 2E1 induces oxidative damage and augments alcohol-mediated oxidative stress. J Biol Chem 285: 24609–24619, 2010. - PMC - PubMed
    1. Bertola A, Mathews S, Ki SH, Wang H, Gao B. Mouse model of chronic and binge ethanol feeding (the NIAAA model). Nat Protoc 8: 627–637, 2013. - PMC - PubMed
    1. Bertola A, Park O, Gao B. Chronic plus binge ethanol feeding synergistically induces neutrophil infiltration and liver injury in mice: a critical role for E-selectin. Hepatology 58: 1814–1823, 2013. - PMC - PubMed
    1. Bruha R, Dvorak K, Petrtyl J. Alcoholic liver disease. World J Hepatol 4: 81–90, 2012. - PMC - PubMed

Publication types