. 2015 Jul 1;29(13):1362-76.
doi: 10.1101/gad.263707.115.

H3K36 methylation promotes longevity by enhancing transcriptional fidelity

Affiliations

H3K36 methylation promotes longevity by enhancing transcriptional fidelity

Payel Sen et al. Genes Dev. .

Abstract

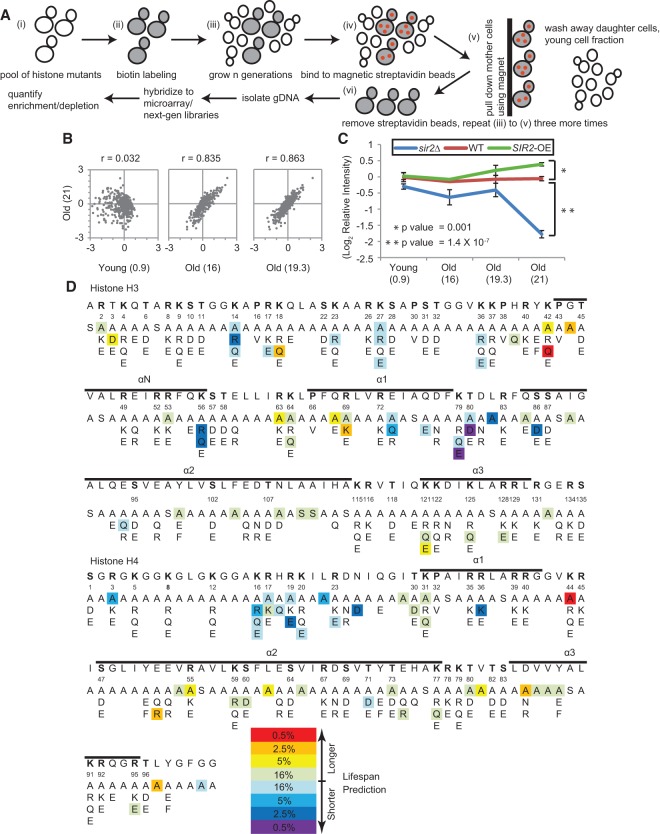
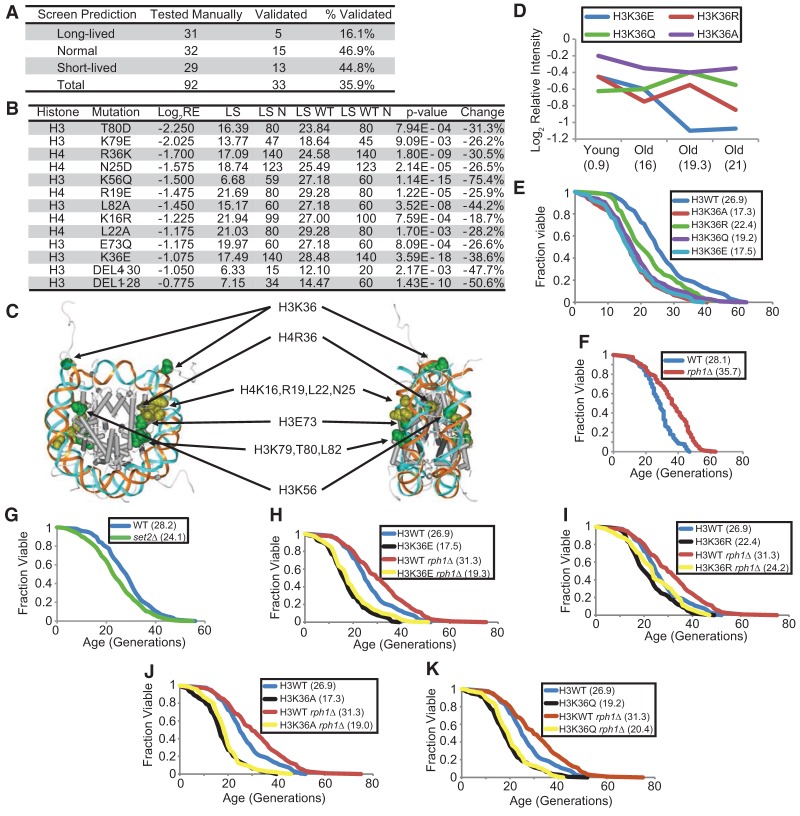
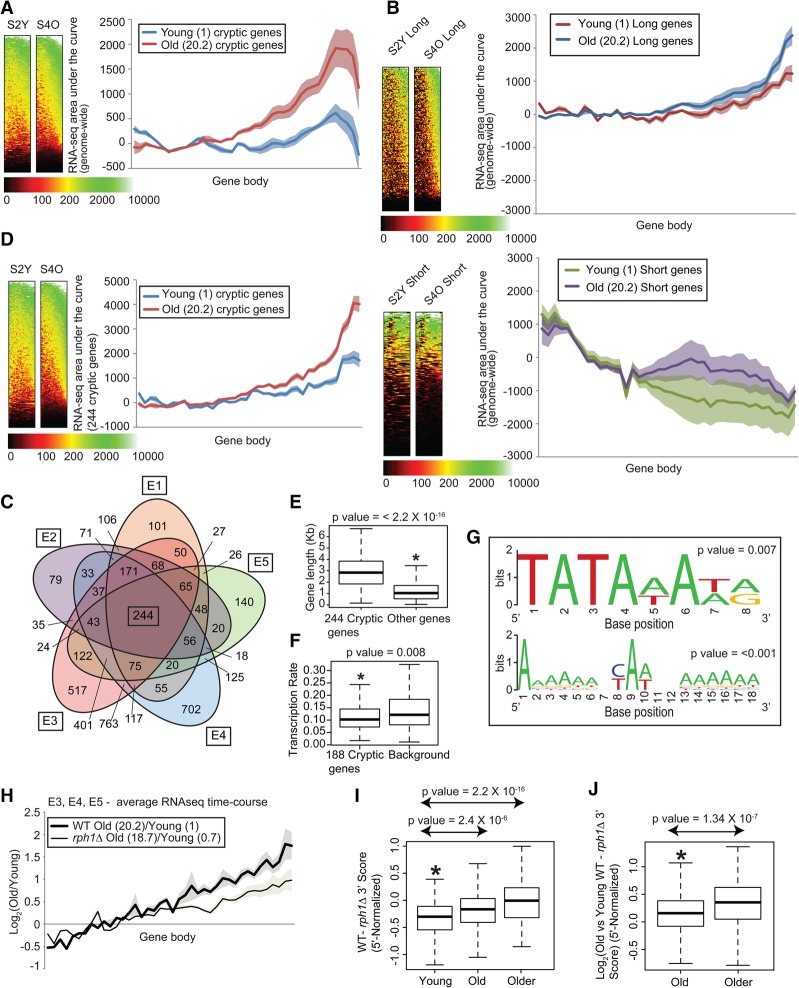
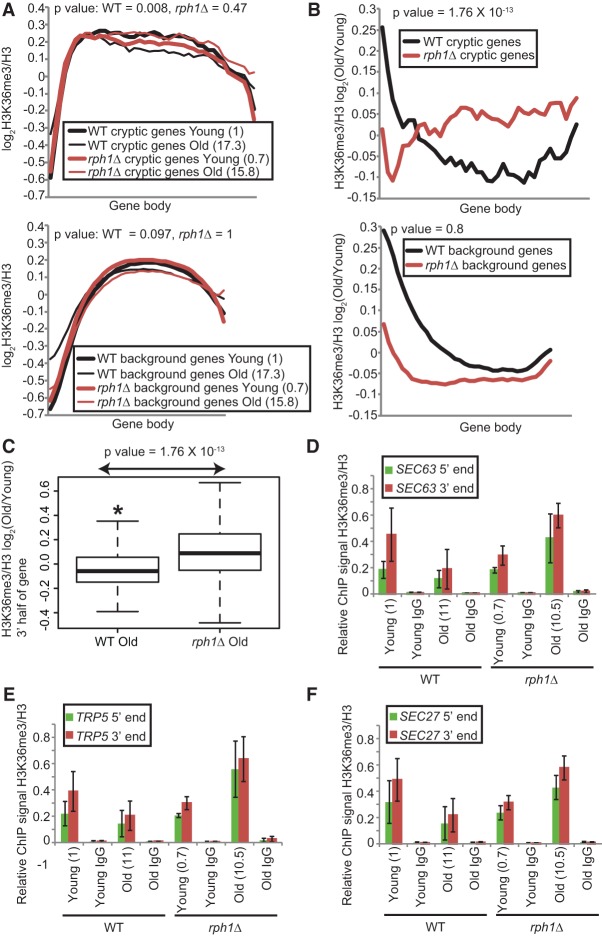
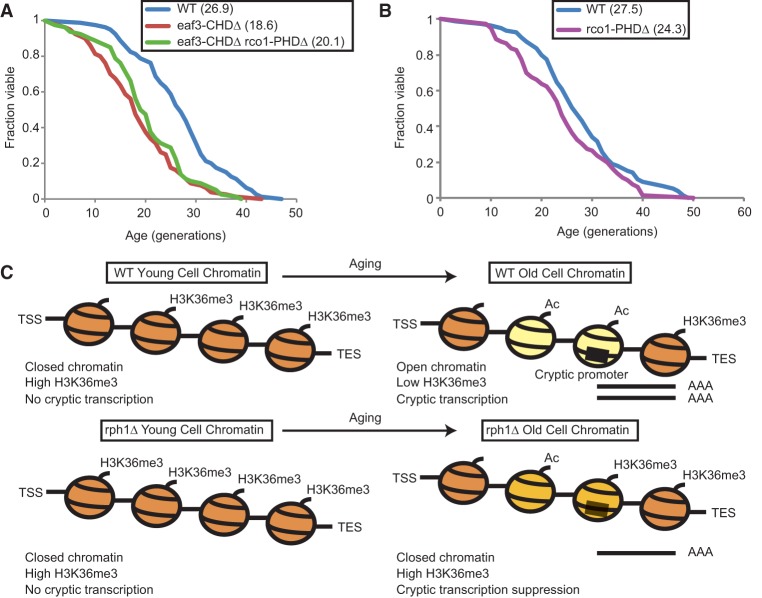
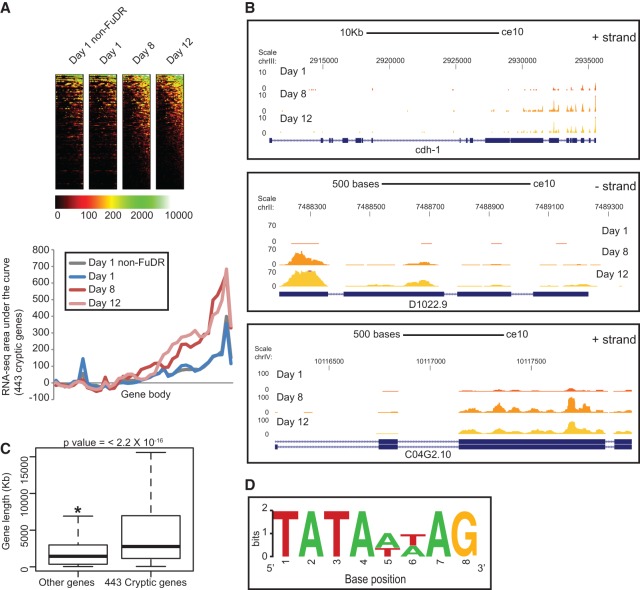
Epigenetic mechanisms, including histone post-translational modifications, control longevity in diverse organisms. Relatedly, loss of proper transcriptional regulation on a global scale is an emerging phenomenon of shortened life span, but the specific mechanisms linking these observations remain to be uncovered. Here, we describe a life span screen in Saccharomyces cerevisiae that is designed to identify amino acid residues of histones that regulate yeast replicative aging. Our results reveal that lack of sustained histone H3K36 methylation is commensurate with increased cryptic transcription in a subset of genes in old cells and with shorter life span. In contrast, deletion of the K36me2/3 demethylase Rph1 increases H3K36me3 within these genes, suppresses cryptic transcript initiation, and extends life span. We show that this aging phenomenon is conserved, as cryptic transcription also increases in old worms. We propose that epigenetic misregulation in aging cells leads to loss of transcriptional precision that is detrimental to life span, and, importantly, this acceleration in aging can be reversed by restoring transcriptional fidelity.

Keywords: H3K36 methylation; aging; cryptic transcription; epigenetics.


Figures

Figure 1.
Figure 1.
A high-throughput screen for histone mutations altering life span. (A) Illustration of screening strategy. (B) Scatter plots showing changes in relative abundance of each histone mutant in the oldest population (four rounds of old cell sorting) compared with the young and intermediate old cell fractions. Values in parentheses represent mean bud scar counts. (C) Performances of internal reference strains in the screen. Six short-lived sir2Δ strains and four long-lived SIR2-OE strains were depleted and enriched, respectively, in the oldest population compared with six wild-type strains. All reference strains carry distinct barcodes. Error bars are standard error of the mean among strains bearing different barcodes. Values in parentheses are mean bud scar counts. (D) Sequence display of histones H3 and H4, with mutations showing differential enrichment in the oldest fraction highlighted in color as indicated. The α helices of the histone proteins are indicated above the sequence.
Figure 2.
Figure 2.
Histone mutations that alter replicative life span. (A) Table listing the number of histone mutants selected from the life span screen and the validation results showing the success rate of the screen. (B) Table listing all validated short-lived mutants, their locations (histone and mutation), relative enrichments in the screen, life span (LS), number of cells used for life span assay (LS N), experimentally matched wild-type life span (LS WT), number of wild-type cells used for life span assay (LS WT N), Wilcoxon rank sum P-value (P-value), and percent change in life span of the mutant (change). (C) Location of the life span-shortening histone residues on the nucleosome crystal structure. (D) Performance of the H3K36 mutants in the screen. The relative intensity of a particular mutant in the population was traced over the cell sorting assay. Values in parentheses are mean bud scar counts. (E) Replicative life span assays with wild type (blue) and H3K36 mutants. (F,G) Replicative life span assay with wild-type (blue), rph1Δ (red), and set2Δ (green). (HK) Replicative life span assays with wild type (blue), rph1Δ (red), H3K36 mutants (black), and H3K36 mutant with rph1Δ (yellow). Mean life spans are indicated in parentheses. All life span P-values are listed in Supplemental Table S3.
Figure 3.
Figure 3.
Cryptic transcription increases in old cells, and suppression of cryptic transcripts extends life span. (A,B) Metagene plots and heat maps of normalized tag counts over all genes (A) and the top 10% longest and shortest genes (672 genes each) (B) in young and old wild-type cells; values in parentheses are mean bud scar counts. Shaded error bands represent standard error of the mean. (C) Five-way Venn diagram of genes with age-related cryptic transcription in five RNA-seq data sets (Supplemental Table S4, E1–E5). (D) Metagene plots and heat maps of normalized tag counts over gene bodies of 244 cryptic genes. (E,F) Box plots showing that the gene length distribution (E) and transcription frequency (F) of the 244 cryptic genes are higher and lower, respectively, than those of a background set of noncryptic genes. (G) WebLogo outputs of regular expression pattern searches for TATA (top) and Initiator (bottom) sequences in the cryptic genes. P-values for the number of motifs are indicated. (H) Metagene plots of normalized tag counts over cryptic gene bodies plotted as a log ratio of old versus young. (I,J) Box plot showing progressive cryptic transcription suppression measured as the difference (I) or log2 (old/young) difference (J) between wild-type and rph1Δ tag counts at the 3′ end of the cryptic genes after normalizing to the 5′ half. P-values are indicated at the top.
Figure 4.
Figure 4.
Genes showing up-regulation of cryptic transcription with age lose H3K36me3 over gene bodies. (A) Metagene plots of H3K36me3 tag counts normalized to H3 over the gene bodies of 244 cryptic genes (top) and all noncryptic genes designated as background (bottom). (B) Same as in A except that the tag counts are expressed as a ratio of old to young. P-values were calculated from the 3′ half of gene bodies. (C) Box plots depicting the significant reduction of H3K36me3 signal over the 3′ half of the gene. Tag counts are expressed as a ratio of old to young. (DF) qPCR of H3K36me3 ChIP plotted relative to H3 at the 5′ and 3′ ends of three cryptic genes: SEC63, TRP5, and SEC27. Error bars are standard error of the mean of two independent biological repeats of cell sorting. Values in parenthesis are mean bud scar counts.
Figure 5.
Figure 5.
Overall model of regulation of life span by the Set2/Rpd3S pathway. (A) Replicative life span assay with wild type (blue), a yeast strain lacking the chromodomain of Eaf3 (eaf3-CHDΔ; red), or both the chromodomain of Eaf3 and the PHD finger of Rco1 (eaf3-CHDΔ rco1-PHDΔ; green). (B) Replicative life span assay with wild type (blue) and a strain lacking the PHD finger of Rco1 (rco1-PHDΔ; purple). Mean life spans are indicated in parentheses. (C) Model showing the aging in wild-type and rph1Δ cells. Wild-type cells lose H3K36me3 from gene bodies with age, thus resulting in hyperacetylation, increased chromatin accessibility (marked by yellow nucleosomes), and high levels of cryptic transcription that is detrimental to life span. In contrast, rph1Δ cells retain moderate levels of H3K36me3, promoting deacetylation and closing down chromatin over intragenic cryptic promoters (marked by light-orange nucleosomes), resulting in suppression of cryptic transcription and life span extension.
Figure 6.
Figure 6.
Cryptic transcript up-regulation in old age is conserved in higher eukaryotes. (A) Metagene plots and heat maps of normalized tag counts over 443 genes in worm that show up-regulation of cryptic transcripts at day 8 and day 12. (B) Browser track views of cdh-1, D1022.9, and C04G2.10 showing the increase in 3′ end tag counts at day 8 and day 12. (C) Box plot showing that the gene length distribution of the cryptic genes is significantly higher than that of a background set of noncryptic genes. (D) WebLogo output of regular expression pattern searches for a modified TATA sequence in the worm cryptic genes.

References

    1. Adams PD, Ivanov A, Pawlikowski J, Manoharan I, Van Tuyn J, Nelson DM, Singh Rai T, Shah PP, Hewitt G, Korolchuk VI, et al. 2013. Lysosome-mediated processing of chromatin in senescence. J Cell Biol 202: 129–143. - PMC - PubMed
    1. Balaban RS, Nemoto S, Finkel T. 2005. Mitochondria, oxidants, and aging. Cell 120: 483–495. - PubMed
    1. Bartkowiak B, Mackellar AL, Greenleaf AL. 2011. Updating the CTD story: from tail to epic. Genet Res Int 2011: 623718. - PMC - PubMed
    1. Blander G, Guarente L, Words K. 2004. The Sir2 family of protein deacetylases. Annu Rev Biochem 73: 417–435. - PubMed
    1. Butler JS, Dent SYR. 2012. Chromatin ‘resetting’ during transcription elongation: a central role for methylated H3K36. Nat Struct Mol Biol 19: 863–864. - PMC - PubMed

Publication types

MeSH terms