. 2015 Aug 28;290(35):21305-19.
doi: 10.1074/jbc.M115.649087. Epub 2015 Jul 9.

Activation of Human Toll-like Receptor 4 (TLR4)·Myeloid Differentiation Factor 2 (MD-2) by Hypoacylated Lipopolysaccharide from a Clinical Isolate of Burkholderia cenocepacia

Affiliations

Activation of Human Toll-like Receptor 4 (TLR4)·Myeloid Differentiation Factor 2 (MD-2) by Hypoacylated Lipopolysaccharide from a Clinical Isolate of Burkholderia cenocepacia

Flaviana Di Lorenzo et al. J Biol Chem. .

Abstract

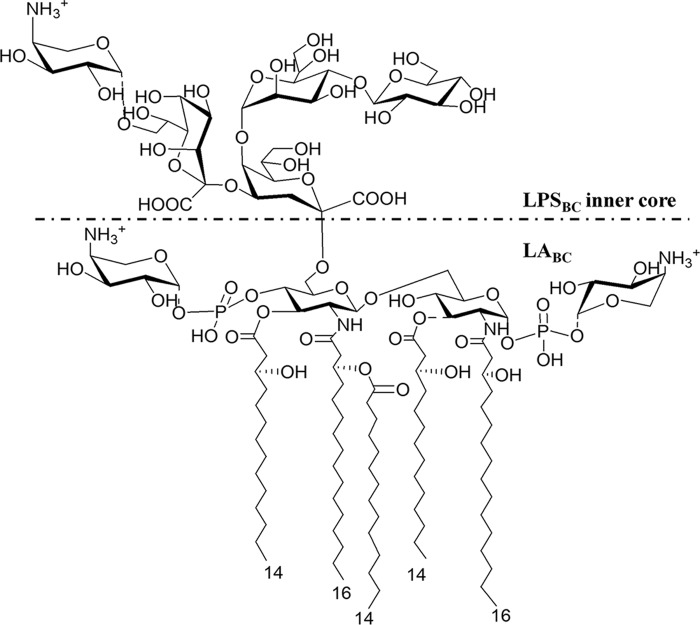
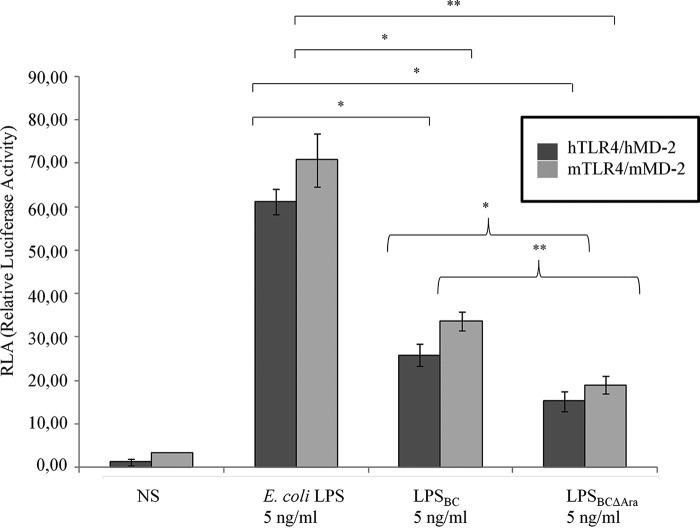
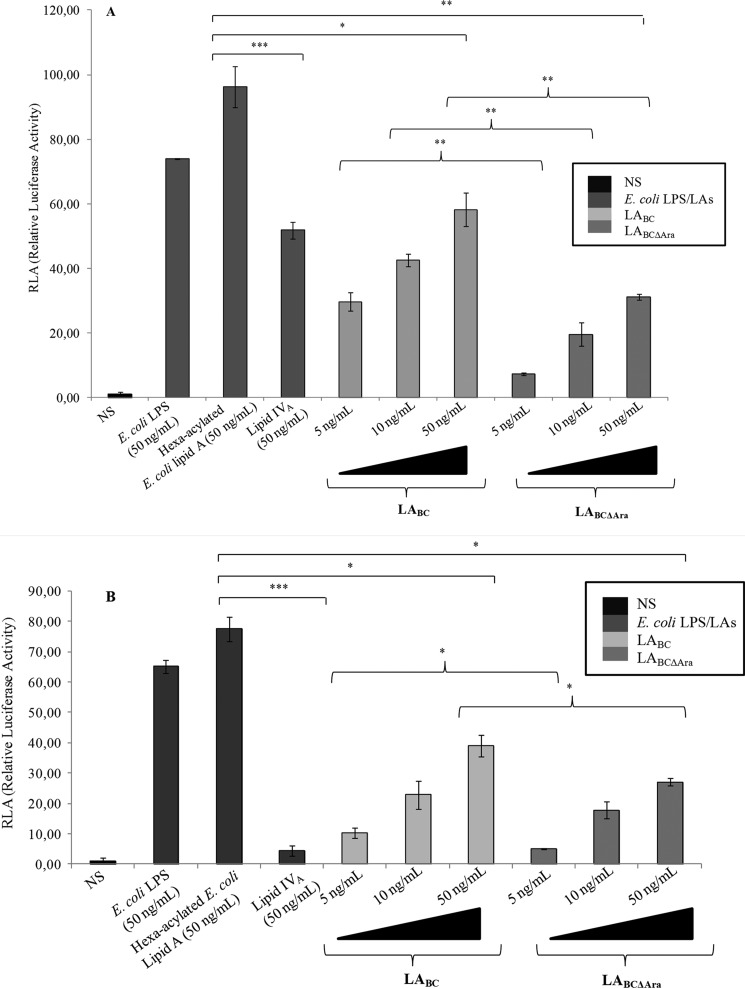
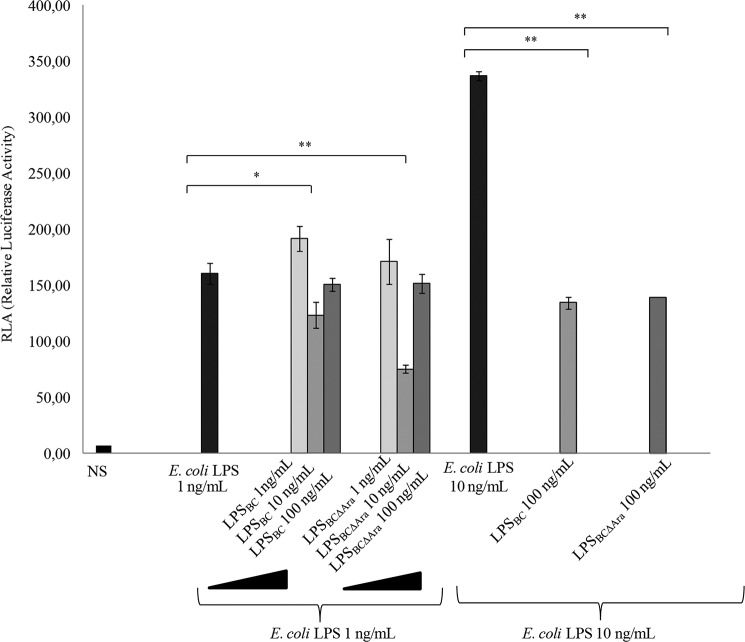
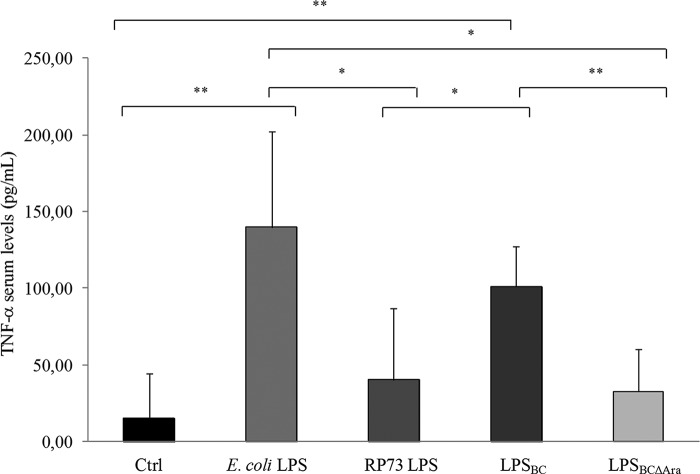
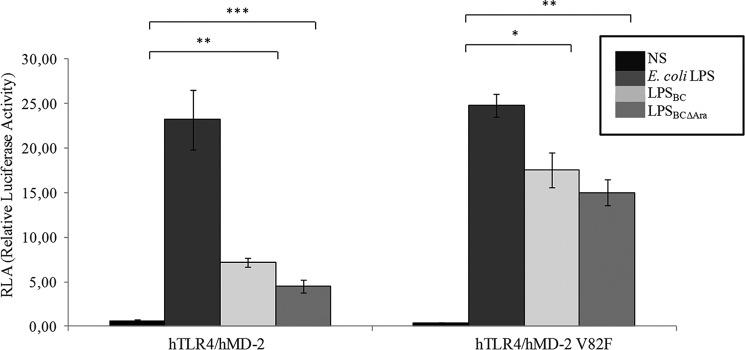
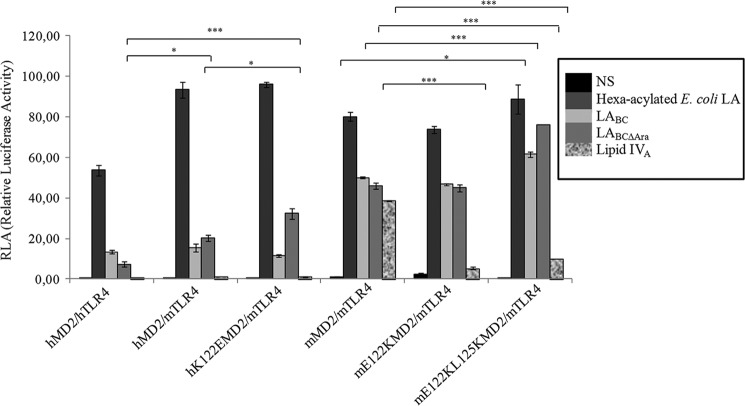
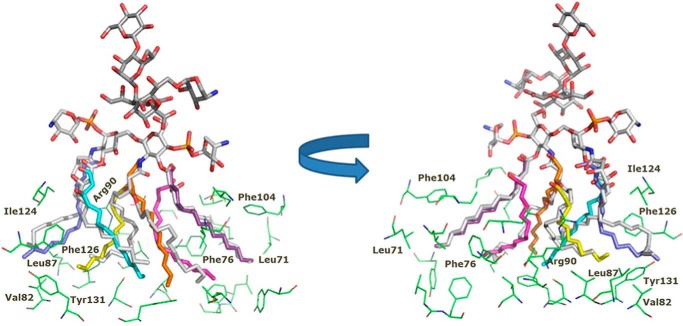
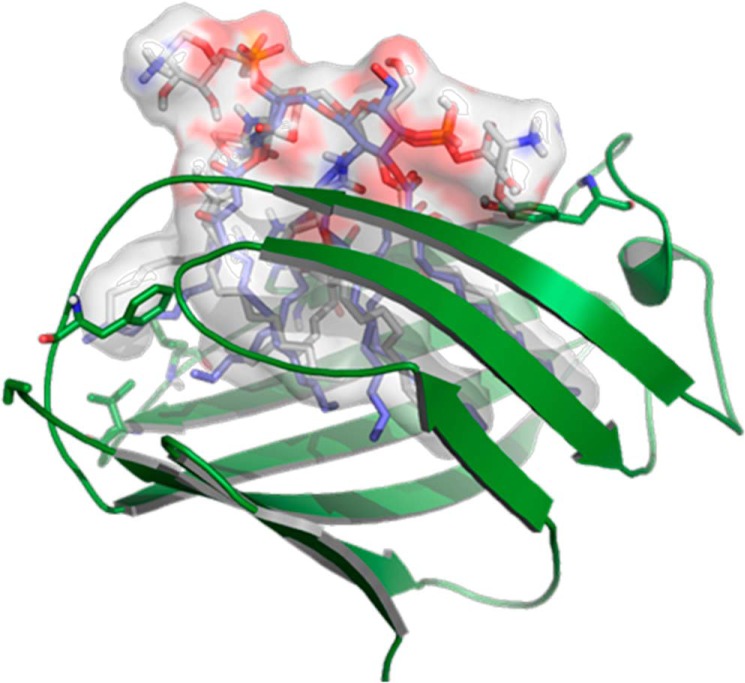
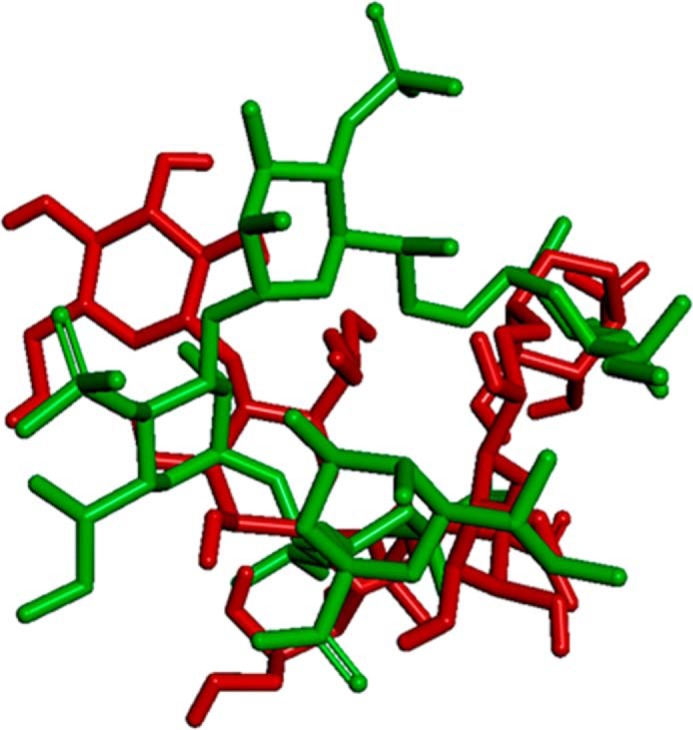
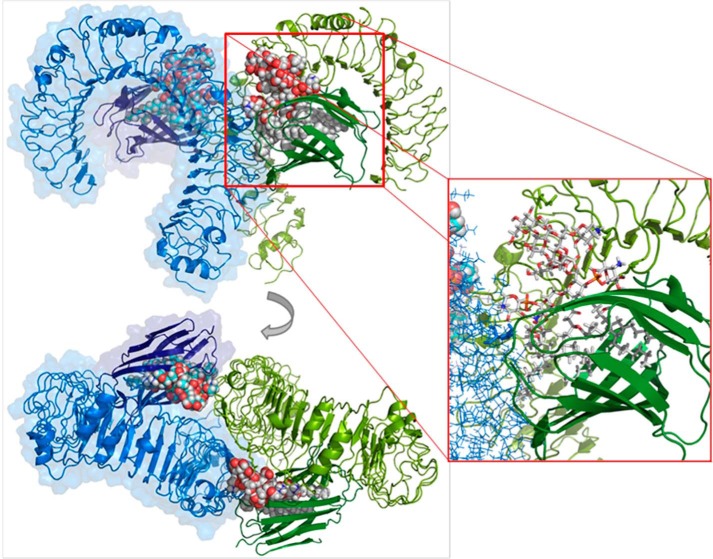
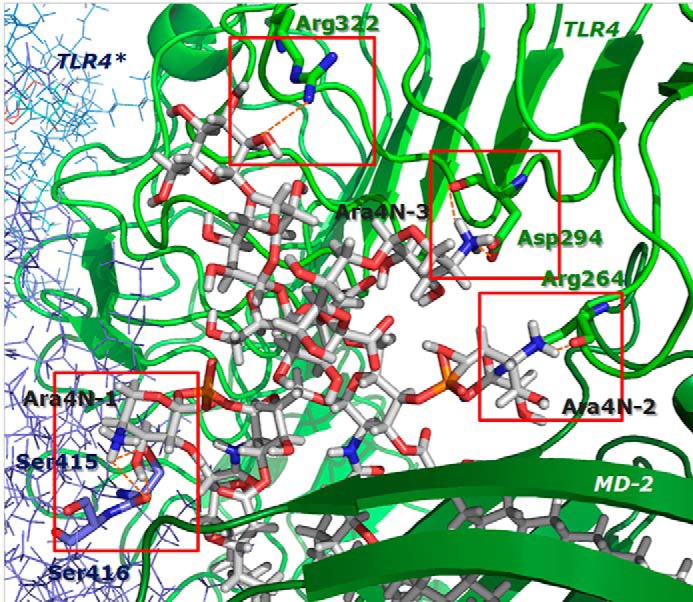
Lung infection by Burkholderia species, in particular Burkholderia cenocepacia, accelerates tissue damage and increases post-lung transplant mortality in cystic fibrosis patients. Host-microbe interplay largely depends on interactions between pathogen-specific molecules and innate immune receptors such as Toll-like receptor 4 (TLR4), which recognizes the lipid A moiety of the bacterial lipopolysaccharide (LPS). The human TLR4·myeloid differentiation factor 2 (MD-2) LPS receptor complex is strongly activated by hexa-acylated lipid A and poorly activated by underacylated lipid A. Here, we report that B. cenocepacia LPS strongly activates human TLR4·MD-2 despite its lipid A having only five acyl chains. Furthermore, we show that aminoarabinose residues in lipid A contribute to TLR4-lipid A interactions, and experiments in a mouse model of LPS-induced endotoxic shock confirmed the proinflammatory potential of B. cenocepacia penta-acylated lipid A. Molecular modeling combined with mutagenesis of TLR4-MD-2 interactive surfaces suggests that longer acyl chains and the aminoarabinose residues in the B. cenocepacia lipid A allow exposure of the fifth acyl chain on the surface of MD-2 enabling interactions with TLR4 and its dimerization. Our results provide a molecular model for activation of the human TLR4·MD-2 complex by penta-acylated lipid A explaining the ability of hypoacylated B. cenocepacia LPS to promote proinflammatory responses associated with the severe pathogenicity of this opportunistic bacterium.

Keywords: Burkholderia; Gram-negative bacteria; TLR4/MD-2; cystic fibrosis; innate immunity; lipopolysaccharide (LPS); molecular modeling.


Figures

FIGURE 1.
FIGURE 1.
Structure of B. cenocepacia LPS inner core and lipid A. B. cenocepacia lipid A is heterogeneous, being composed of a mixture of penta- and tetra-acylated species (30, 40). Lipid A fatty acids are two 3-(R)-hydroxyhexadecanoic acids, two 3-(R)-hydroxytetradecanoic acids, and one tetradecanoic acid (30, 40). The dotted lines indicate the non-stoichiometric substitution.
FIGURE 2.
FIGURE 2.
LPSBC activates the murine and human TLR4·MD-2 complexes. NF-κB activation upon stimulation of HEK293 mTLR4·mMD-2 and hTLR4·hMD-2 after 6 h with 5 ng/ml LPSBC and LPSBCΔAra. Stimulation for 6 h with E. coli LPS was used as the control. The data are pooled from three independent experiments done in triplicate. Bars indicate S.D.; significance was calculated in comparison with stimulation with E. coli LPS (*, p < 0.05; **, p < 0.01). Curly brackets indicate significance calculated comparing LPSBC and LPSBCΔAra (*, p < 0.05; **, p < 0.01). NS, no stimulation.
FIGURE 3.
FIGURE 3.
Lipid A activation of murine and human TLR4·MD-2 complexes. A, NF-κB activation upon stimulation of HEK293 mTLR4·mMD-2 after 6 h with LABC and LABCΔAra. Stimulations for 6 h with E. coli LPS, hexa-acylated lipid A, and lipid IVA were used as controls. The data are pooled from three independent experiments done in triplicate. Bars indicate S.D.; significance was calculated in comparison with stimulation with hexa-acylated E. coli lipid A (*, p < 0.05; **, p < 0.01; ***, p < 0.001); curly brackets indicate significance calculated comparing LPSBC and LPSBCΔAra (**p < 0.01). B, NF-κB activation upon stimulation of HEK293 hTLR4·hMD-2 after 6 h with LABC and LABCΔAra. Stimulations for 6 h with E. coli LPS, hexa-acylated lipid A, and lipid IVA were used as controls. The data are pooled from three independent experiments done in triplicate. Bars indicate S.D.; significance was calculated in comparison with stimulation with hexa-acylated E. coli lipid A (*, p < 0.05; ***, p < 0.001); curly brackets indicate significance calculated comparing LPSBC and LPSBCΔAra (*, p < 0.05). NS, no stimulation.
FIGURE 4.
FIGURE 4.
B. cenocepacia LPSBCΔAra effects on the E. coli LPS agonist activity. The potential antagonist activity of LPSBC and LPSBCΔAra on hexa-acylated E. coli LPS was assayed. NF-κB activation upon stimulation of HEK293 hTLR4 after 1 h with LPSBC (1, 10, and 100 ng/ml) and LPSBCΔAra (1, 10, and 100 ng/ml) followed by exposure to E. coli LPS (1 and 10 ng/ml) for 4 h is shown. The data are pooled from three independent experiments done in triplicate. Bars indicate S.D.; significance was calculated in comparison with stimulation with E. coli LPS (1 and 10 ng/ml) (*, p < 0.05; **, p < 0.01). NS, no stimulation.
FIGURE 5.
FIGURE 5.
Proinflammatory and endotoxic potential of LPSBC in C57Bl/6 mice. From three to five mice per group were challenged via intraperitoneal injection with 300 μg/mouse LPS from E. coli and P. aeruginosa RP73, LPSBC, and LPSBCΔAra. TNF-α levels in sera were quantified after 5 h of treatment. Treatment with sterile saline solution was used as control (Ctrl). The data are pooled from two independent experiments. Bars indicate mean ± S.D. Statistical analysis was made for pair wise comparisons (*, p < 0.05; **, p < 0.01).
FIGURE 6.
FIGURE 6.
B. cenocepacia LPS acylation pattern is responsible for the NF-κB activation. NF-κB activation upon stimulation of HEK293 hTLR4·hMD-2 after 6 h with LPSBC and LPSBCΔAra is shown. Stimulation for 6 h with E. coli LPS was used as the control. The same protocol was used to stimulate HEK293 hTLR4·hMD-2 V82F cells. The data are pooled from three independent experiments done in triplicate. Bars indicate S.D.; significance was calculated in comparison with E. coli LPS (*, p < 0.05; **, p < 0.01; ***, p < 0.001). NS, no stimulation.
FIGURE 7.
FIGURE 7.
Lys-122 and Lys-125 in the B. cenocepacia LPS signaling on murine and human TLR4·MD-2 complexes. An NF-κB-luciferase reporter assay stimulating HEK293 hTLR4·hMD-2, HEK293 mTLR4·mMD-2, and mTLR4·hMD-2 after 6 h with LPSBC and LPSBCΔAra was carried out. Stimulations for 6 h with E. coli LPS and with lipid IVA were used as controls. The same protocol was used to stimulate HEK293 mTLR4·mMD-2 E1222K and HEK293 mTLR4·mMD-2 E122K/L125K cells. The data are pooled from two independent experiments done in triplicate. Bars indicate S.D.; statistical analysis was calculated for pairwise comparisons (*, p < 0.05; ***, p < 0.001). NS, no stimulation.
FIGURE 8.
FIGURE 8.
Predicted binding mode of the LPSBC core to hTLR4·MD-2. The computational model from docking followed by MDS is shown. LPSBC docked to MD-2 is shown in Corey-Pauling-Koltun colors. Superimposed fatty acids chains from E. coli lipid A are shown in different colors. Some representative residues from the MD-2 binding site are represented with carbon atoms in green.
FIGURE 9.
FIGURE 9.
Predicted binding mode of the LPSBC core to hTLR4·MD-2. Details of LPSBC (Corey-Pauling-Koltun colors) docked to MD-2 are shown. Superimposed fatty acids chains from E. coli lipid A are shown with carbon atoms in blue.
FIGURE 10.
FIGURE 10.
Predicted binding mode of the LPSBC core to hTLR4·MD-2. Detail of some H-bond interactions between the LPSBC inner core and TLR4·MD-2 involving Tyr-102 is shown. LPSBC is represented in Corey-Pauling-Koltun colors, and MD-2 protein is represented in green.
FIGURE 11.
FIGURE 11.
Superimposition of best dock results of LPSBC core. The docking was obtained using AutoDock Vina (depicted in red) and E. coli LPS core from Protein Data Bank code 3fxi (depicted in green). TLR4 is not shown for the sake of clarity.
FIGURE 12.
FIGURE 12.
Predicted binding mode of the LPSBC core to hTLR4·MD-2. The computational model from docking followed by MDS is shown. Left panel, three-dimensional model of the dimer of LPSBC core in complex with TLR4·MD-2. Right panel, detail of the dimer of LPSBC inner core in complex with TLR4·MD-2.
FIGURE 13.
FIGURE 13.
Predicted binding mode of the LPSBC core to hTLR4·MD-2. Details of some interactions between the LPSBC inner core and TLR4·MD-2 from the computational model are shown.

References

    1. Janeway C. A., Jr., Medzhitov R. (2002) Innate immune recognition. Annu. Rev. Immunol. 20, 197–216 - PubMed
    1. Gay N. J., Gangloff M. (2007) Structure and function of Toll receptors and their ligands. Annu. Rev. Biochem. 76, 141–165 - PubMed
    1. Broz P., Monack D. M. (2013) Newly described pattern recognition receptors team up against intracellular pathogens. Nat. Rev. Immunol. 13, 551–565 - PubMed
    1. Nagai Y., Akashi S., Nagafuku M., Ogata M., Iwakura Y., Akira S., Kitamura T., Kosugi A., Kimoto M., Miyake K. (2002) Essential role of MD-2 in LPS responsiveness and TLR4 distribution. Nat. Immunol. 3, 667–672 - PubMed
    1. Angus D. C., Linde-Zwirble W. T., Lidicker J., Clermont G., Carcillo J., Pinsky M. R. (2001) Epidemiology of severe sepsis in the United States: analysis of incidence, outcome, and associated costs of care. Crit. Care Med. 29, 1303–1310 - PubMed

Publication types

MeSH terms

LinkOut - more resources