. 2015 Aug 28;290(35):21365-75.
doi: 10.1074/jbc.M115.669895. Epub 2015 Jul 9.

Structural Basis for Antigen Recognition by Transglutaminase 2-specific Autoantibodies in Celiac Disease

Affiliations

Structural Basis for Antigen Recognition by Transglutaminase 2-specific Autoantibodies in Celiac Disease

Xi Chen et al. J Biol Chem. .

Abstract

Antibodies to the autoantigen transglutaminase 2 (TG2) are a hallmark of celiac disease. We have studied the interaction between TG2 and an anti-TG2 antibody (679-14-E06) derived from a single gut IgA plasma cell of a celiac disease patient. The antibody recognizes one of four identified epitopes targeted by antibodies of plasma cells of the disease lesion. The binding interface was identified by small angle x-ray scattering, ab initio and rigid body modeling using the known crystal structure of TG2 and the crystal structure of the antibody Fab fragment, which was solved at 2.4 Å resolution. The result was confirmed by testing binding of the antibody to TG2 mutants by ELISA and surface plasmon resonance. TG2 residues Arg-116 and His-134 were identified to be critical for binding of 679-14-E06 as well as other epitope 1 antibodies. In contrast, antibodies directed toward the two other main epitopes (epitopes 2 and 3) were not affected by these mutations. Molecular dynamics simulations suggest interactions of 679-14-E06 with the N-terminal domain of TG2 via the CDR2 and CDR3 loops of the heavy chain and the CDR2 loop of the light chain. In addition there were contacts of the framework 3 region of the heavy chain with the catalytic domain of TG2. The results provide an explanation for the biased usage of certain heavy and light chain gene segments by epitope 1-specific antibodies in celiac disease.

Keywords: antibody; celiac disease; epitope mapping; mutagenesis; small-angle x-ray scattering (SAXS); surface plasmon resonance (SPR); transglutaminase.


Figures

FIGURE 1.
FIGURE 1.
Small angle x-ray scattering data. Shown are scattering data and theoretical fits of the complex (pink), TG2-GDP (gray), and the Fab fragment (green). Shown are the scattering intensities I(q) as the functions of the scattering vector q (q = 4πsin(θ)/λ,where 2θ is the scattering angle, and λ is the wavelength). The profiles have been shifted along the y axis for better visualization.
FIGURE 2.
FIGURE 2.
Rigid body models of TG2-GTP in complex with 679-14-E06 Fab fragment obtained by SASREF. A, the models of 17 individual rounds of SASREF were clustered into six groups (a–f). TG2-GTP is colored in gray, and the light and heavy chains of the Fab fragment are colored in green and blue, respectively. The model used for further analysis is labeled with a red asterisk. B, structural overlay of all models composing group f. C, superposition of the representative rigid body model of group f with the ab initio model for the complex (pink beads).
FIGURE 3.
FIGURE 3.
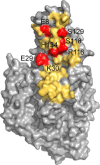
Visualization of footprint on TG2 by the 679-14-E06 Fab fragment as indicated by SASREF. Residues of TG2, which in the representative rigid body model of group f are within 5 Å distance to residues of the 679-14-E06 Fab fragment, are colored in yellow. Residues selected for mutagenesis analysis are colored in red. The residues Glu-29, Lys-30, Arg-116, Ser-118, Ser-129, and His-134 are within 5 Å distance, whereas residue Glu-8 has a 6 Å distance to the Fab fragment.
FIGURE 4.
FIGURE 4.
Binding of antibody 679-14-E06 to mutants of TG2 as assessed by ELISA. Titration curves showing binding of the antibody to the TG2 mutants E8Q, E29Q, K30E, K30A, R116A, S118A, S129A, and H134A compared of WT TG2. Experiments have been performed at least twice.
FIGURE 5.
FIGURE 5.
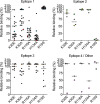
Binding of a panel of monoclonal antibodies to TG2 mutants as assessed by ELISA. Binding of a panel of antibodies reactive with epitope 1, 2, 3, or 4 was tested against the TG2 mutants R19S, K30A, R116A, and H134A. Shown are signals normalized against those obtained with WT TG2. The open circles represent an anti-TG2 antibody that was not assigned to epitope 1–4, and diamonds represent antibodies analyzed in the SPR study. The symbols for the two epitope 1 antibodies 679-14-E06 and 693-10-B06 are shown in red and blue, respectively. Symbols representing antibodies 693-1-A03 and 763-4-B06 recognizing epitope 2 are colored yellow and green. Symbols for the epitope 3 antibodies 763-4-A06 and 763-4-E05 are shown in orange and gray, and symbols for 693-1-D03, which recognizes epitope 4, are shown in violet. Horizontal lines indicate medians. Results from one of three independent experiments are shown.
FIGURE 6.
FIGURE 6.
Binding of monoclonal antibodies to mutants of TG2 as assessed by surface plasmon resonance. The antibodies tested are representative for antibodies reactive to epitopes 1–4. The sensorgrams depict relative binding of WT and mutant TG2 variants after injection over immobilized anti-TG2 autoantibodies. Shown are representative sensorgrams from one of two experiments.
FIGURE 7.
FIGURE 7.
Both heavy and light chain of 679-14-E06 are involved in binding of epitope 1. Heavy and light chains were swapped between antibodies reactive (679-14-E06) and not reactive (679-14-A04) to TG2. A, Coomassie-stained SDS-PAGE gels showing 679-14-E06H/679-14-A04L and 679-14-A04H/679-14-E06L antibodies under reducing and non-reducing conditions (white lines show the borders of different lanes). B, reactivity of the antibodies 679-14-E06, 679-14-A04, 679-14-E06H/679-14-A04L, and 679-14-A04H/679-14-E06L to TG2 as monitored by ELISA. Shown are the results from one of two independent experiments.
FIGURE 8.
FIGURE 8.
Structure models derived from molecular dynamics simulation of the interaction between TG2 and the Fab fragment of 679-14-E06. The ribbon overlay of the backbone for four states of the MD trajectory is shown in the box. The residues engaged in the binding between the Fab and TG2 of one of the states are shown as sticks. TG2 is colored in gray, whereas the light chain and heavy chain of the Fab fragment are colored in green and blue, respectively. The surrounding close-up views depict overlays of four states and show the side chains of the amino acid residues engaged in binding. Red spheres represent water molecules.
FIGURE 9.
FIGURE 9.
Involvement of the TG2 residues Asp-191 and Lys-265 in the epitope of 679-14-E06 and other epitope 1 antibodies. A and B, binding of antibody 679-14-E06 to the TG2 mutants D191A and K265A as assessed by ELISA and SPR. The ELISA and SPR experiments were done at least twice. C, testing of the binding to the TG2 mutant D191A by a panel of anti-TG2 antibodies reactive with epitope 1, 2, 3, or 4. Shown are signals normalized against those obtained with WT TG2. The gray point represents the antibody 679-14-E06, and the open circles represent anti-TG2 antibodies that were not assigned to epitope 1–4. Horizontal lines indicate medians.
FIGURE 10.
FIGURE 10.
Structure from molecular dynamics simulation revealing the involvement of the water network around residue His-134 in interaction with the heavy chain of 679-14-E06. At the binding interface a network of water molecules surrounds the histidine residue. This water network is disrupted by replacing histidine with alanine.

References

    1. Abadie V., Sollid L. M., Barreiro L. B., Jabri B. (2011) Integration of genetic and immunological insights into a model of celiac disease pathogenesis. Annu. Rev. Immunol. 29, 493–525 - PubMed
    1. Dieterich W., Ehnis T., Bauer M., Donner P., Volta U., Riecken E. O., Schuppan D. (1997) Identification of tissue transglutaminase as the autoantigen of celiac disease. Nat. Med. 3, 797–801 - PubMed
    1. Di Niro R., Mesin L., Zheng N. Y., Stamnaes J., Morrissey M., Lee J. H., Huang M., Iversen R., du Pré M. F., Qiao S. W., Lundin K. E., Wilson P. C., Sollid L. M. (2012) High abundance of plasma cells secreting transglutaminase 2-specific IgA autoantibodies with limited somatic hypermutation in celiac disease intestinal lesions. Nat. Med. 18, 441–445 - PMC - PubMed
    1. Husby S., Koletzko S., Korponay-Szabó I. R., Mearin M. L., Phillips A., Shamir R., Troncone R., Giersiepen K., Branski D., Catassi C., Lelgeman M., Mäki M., Ribes-Koninckx C., Ventura A., Zimmer K. P., ESPGHAN Working Group on Coeliac Disease Diagnosis, ESPGHAN Gastroenterology Committee, and European Society for Pediatric Gastroenterology, Hepatology, and Nutrition (2012) European Society for Pediatric Gastroenterology, Hepatology, and Nutrition guidelines for the diagnosis of coeliac disease. J. Pediatr. Gastroenterol. Nutr. 54, 136–160 - PubMed
    1. Dieterich W., Laag E., Schöpper H., Volta U., Ferguson A., Gillett H., Riecken E. O., Schuppan D. (1998) Autoantibodies to tissue transglutaminase as predictors of celiac disease. Gastroenterology 115, 1317–1321 - PubMed

Publication types

MeSH terms