. 2015 Aug 21;290(34):20865-20879.
doi: 10.1074/jbc.M115.662155. Epub 2015 Jul 9.

The Steroidogenic Enzyme AKR1C3 Regulates Stability of the Ubiquitin Ligase Siah2 in Prostate Cancer Cells

Affiliations

The Steroidogenic Enzyme AKR1C3 Regulates Stability of the Ubiquitin Ligase Siah2 in Prostate Cancer Cells

Lingling Fan et al. J Biol Chem. .

Abstract

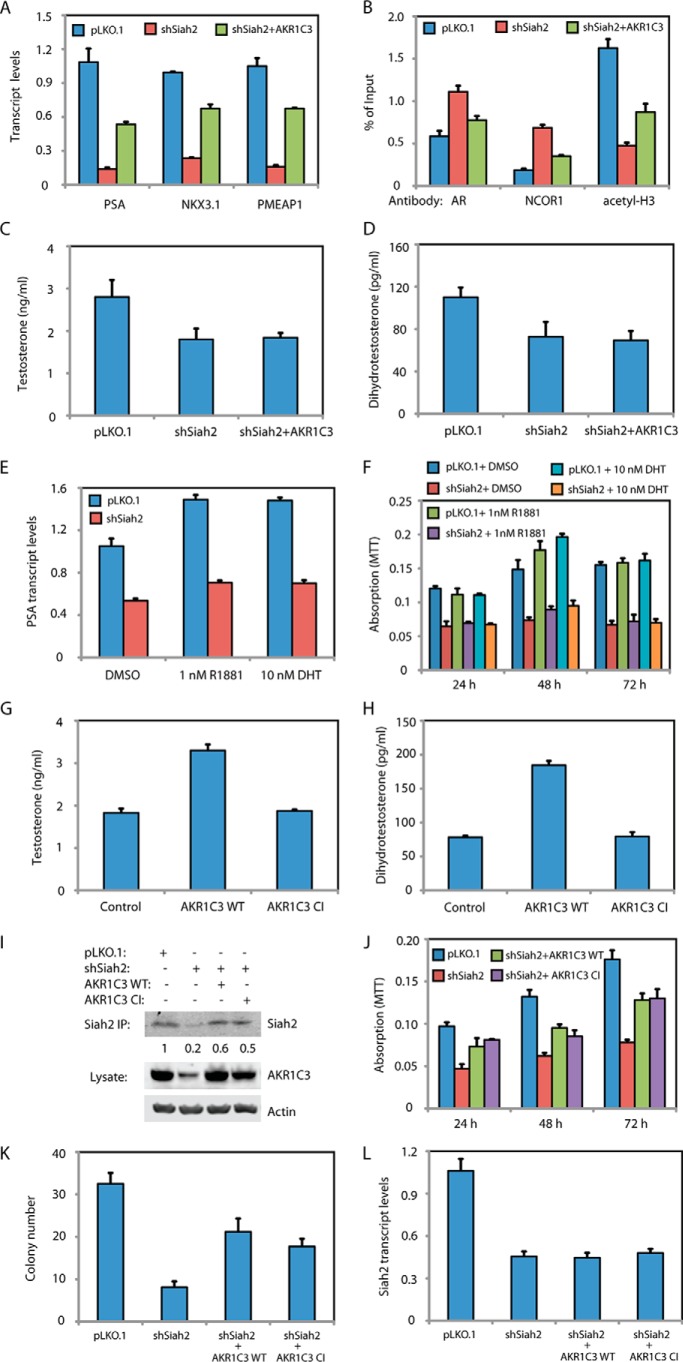
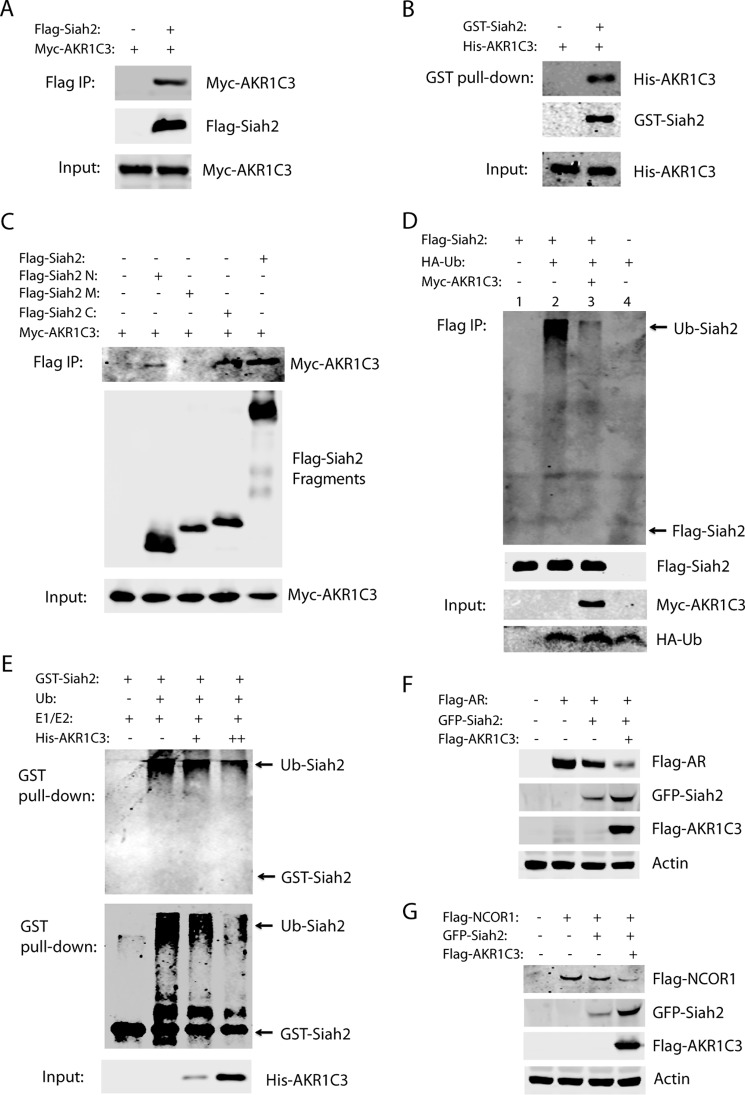
Re-activation of androgen receptor (AR) activity is the main driver for development of castration-resistant prostate cancer. We previously reported that the ubiquitin ligase Siah2 enhanced AR transcriptional activity and prostate cancer cell growth. Among the genes we found to be regulated by Siah2 was AKR1C3, which encodes a key androgen biosynthetic enzyme implicated in castration-resistant prostate cancer development. Here, we found that Siah2 inhibition in CWR22Rv1 prostate cancer cells decreased AKR1C3 expression as well as intracellular androgen levels, concomitant with inhibition of cell growth in vitro and in orthotopic prostate tumors. Re-expression of either wild-type or catalytically inactive forms of AKR1C3 partially rescued AR activity and growth defects in Siah2 knockdown cells, suggesting a nonenzymatic role for AKR1C3 in these outcomes. Unexpectedly, AKR1C3 re-expression in Siah2 knockdown cells elevated Siah2 protein levels, whereas AKR1C3 knockdown had the opposite effect. We further found that AKR1C3 can bind Siah2 and inhibit its self-ubiquitination and degradation, thereby increasing Siah2 protein levels. We observed parallel expression of Siah2 and AKR1C3 in human prostate cancer tissues. Collectively, our findings identify a new role for AKR1C3 in regulating Siah2 stability and thus enhancing Siah2-dependent regulation of AR activity in prostate cancer cells.

Keywords: androgen; androgen receptor; prostate cancer; transcription regulation; ubiquitin ligase.


Figures

FIGURE 1.
FIGURE 1.
A, effect of Siah2 KD on AKR1C3 protein levels. Indicated PCa cell lines were transduced with pLKO.1 (1) or shSiah2 (2) and maintained in media containing 5% CS-FBS for 48 h. Cells were either treated or not treated with 1 nm R1881 for 24 h and analyzed by Western blotting with antibodies to AKR1C3 and tubulin, which served as a loading control. B, effect of exogenous androgen (R1881) on AKR1C3 transcript levels in PCa cells. Indicated cells were maintained in media containing 5% CS-FBS for 48 h and then either treated or not treated with 1 nm R1881 for 24 h. Cells were analyzed for AKR1C3 transcripts by qRT-PCR. R1881 treatment reduced AKR1C3 transcript levels in LNCaP and Rv1 cells (p < 0.05) but not in PC3 or DU145 cells (p > 0.1). C, effect of Siah2 KD on AKR1C3 protein levels in xenograft tumors. Nude mice harboring Rv1 xenograft tumors (pLKO.1 or shSiah2) were either castrated or sham-castrated for 2 weeks. Tumor tissues (n = 3/group) were analyzed by Western blotting with AKR1C3 or tubulin antibodies. D, effect of Siah2 KD on AKR1C3 transcript levels in Rv1 cells. Cells were treated and analyzed as in B. Siah2 KD in Rv1 cells reduced AKR1C3 and PSA transcript levels without (p < 0.01 for Siah2 or PSA and p < 0.005 for AKR1C3) or with (p < 0.005 for Siah2 or AKR1C3 and p < 0.05 for PSA) R1881 treatment. E, effect of Siah2 KD on AKR1C3 transcripts in xenograft tumors. The xenograft tumors described in C were analyzed by qRT-PCR for Siah2, AKR1C3, or PSA transcripts. Siah2 KD reduced AKR1C3 and PSA transcript levels in control (p < 0.005 for AKR1C3 and p < 0.001 for PSA or Siah2) or castrated (p < 0.005 for Siah2 or AKR1C3 and p < 0.05 for PSA) mice. F and G, effect of Siah2 KD on AKR1C3 transcript levels in DU145 (F) and PC3 cells (G). Indicated PCa cells were treated and analyzed as in B. F, Siah2 KD in DU145 cells reduced AKR1C3 transcript levels without (p < 0.005 for Siah2 or AKR1C3) or with (p < 0.005 for Siah2 and p < 0.01 for AKR1C3) R1881 treatment. G, Siah2 KD in PC3 cells had no effect on AKR1C3 transcript levels without (p < 0.01 for Siah2 and p > 0.1 for AKR1C3) or with (p < 0.01 for Siah2 and p > 0.1 for AKR1C3) R1881 treatment. H, effect of AR KD on AKR1C3 transcript levels. Rv1 cells (pLKO.1 or shAR) were treated as in B and analyzed by qRT-PCR for AR, AKR1C3, or PSA transcripts. AR KD in Rv1 cells reduced PSA transcript levels but not AKR1C3 without (p < 0.005 for AR, p < 0.05 for PSA, p > 0.1 for AKR1C3) or with (p < 0.005 for AR or PSA and p > 0.1 for AKR1C3) R1881 treatment.
FIGURE 2.
FIGURE 2.
A, AKR1C3 re-expression in Siah2 KD cells. Siah2 KD Rv1 cells were transduced with lentivirus harboring AKR1C3. Cells (control pLKO.1, shSiah2, or shSiah2 + AKR1C3) were analyzed by Western blotting with AKR1C3 and tubulin antibodies. B and C, effect of AKR1C3 re-expression on proliferation of Siah2 KD cells. Rv1 cells in A were maintained in media containing either FBS (B) or CS-FBS (C) and assayed for proliferation at indicated time points. Siah2 KD inhibited the growth of Rv1 cells in FBS media (pLKO.1 versus shSiah2: p < 5 × 10⁻⁴ at 24 h, p < 10−5 at 48 h, and p < 5 × 10⁻⁶ at 72 or 96 h) or CS-FBS media (pLKO.1 versus shSiah2: p < 5 × 10⁻⁶ at 24 or 96 h, p < 10−3 at 48 h, and p < 10−4 at 72 h). AKR1C3 re-expression partly promoted growth of Siah2 KD Rv1 cells in FBS media (shSiah2 versus shSiah2 + AKR1C3: p < 5 × 10⁻⁴ at 24 or 72 h, p < 5 × 10⁻³ at 48 h, and p < 5 × 10⁻⁶ at 96 h) or CS-FBS media (shSiah2 versus shSiah2 +AKR1C3: p < 5 × 10⁻⁵ at 24 or 96 h, p < 0.05 at 48 h, and p < 0.001 at 72 h). D, effect of AKR1C3 re-expression on colony formation by Siah2 KD cells. Rv1 cells in A were maintained in soft agar for 3 weeks, and colony number per-field was determined. The colony formation was reduced upon Siah2 KD (pLKO.1 versus shSiah2: p < 5 × 10⁻⁶) but was partly increased upon re-expression of AKR1C3 (shSiah2 versus shSiah2 + AKR1C3: p < 5 × 10⁻⁵). E, effect of AKR1C3 re-expression on orthotopic prostate tumor formation by Siah2 KD cells. Rv1 cells in A were injected into dorsal prostates of nude mice. Three weeks later, tumors were monitored and weighed (n = 6 for each group). The tumor weight was decreased upon Siah2 KD (pLKO.1 versus shSiah2: p < 5 × 10⁻⁴) but was partly increased upon re-expression of AKR1C3 (shSiah2 versus shSiah2 + AKR1C3: p < 0.05). F, effect of AKR1C3 re-expression on proliferation or apoptosis of Siah2 KD Rv1 cells in orthotopic prostate tumors. Paraffin sections derived from indicated tumors were analyzed by staining with Ki67 (a proliferation marker) and active caspase-3 (an apoptosis marker). Staining was visualized by DAB (brown) plus a hematoxylin counterstain (blue). G, quantification of Ki67 and active caspase-3 staining shown in F. The number of positively stained nuclei and total nuclei was determined in five random high power fields. The percentage of positively stained cells for Ki67 was reduced upon Siah2 KD (pLKO.1 versus shSiah2: p < 0.005) but was partly increased upon re-expression of AKR1C3 (shSiah2 versus shSiah2 + AKR1C3: p < 0.05). The percentage of positively stained cells for active caspase-3 was increased upon Siah2 KD (pLKO.1 versus shSiah2: p < 0.001) but was partly decreased upon re-expression of AKR1C3 (shSiah2 versus shSiah2 + AKR1C3: p < 0.05).
FIGURE 3.
FIGURE 3.
A, effect of AKR1C3 re-expression in Siah2 KD Rv1 cells on AR target gene expression. Indicated cells were analyzed by qRT-PCR for PSA, NKX3.1, or PMEPA1 transcripts. Siah2 KD reduced the transcript level of these AR targets (pLKO.1 versus shSiah2: p < 0.01 for PSA, p < 5 × 10⁻⁵ for NKX3.1, and p < 0.005 for PMEPA1). Re-expression of AKR1C3 partly increased these AR targets (shSiah2 versus shSiah2 + AKR1C3: p < 0.005 for PSA or NKX3.1 and p < 0.0005 for PMEPA1). B, effect of AKR1C3 re-expression in Siah2 KD cells on association of AR, NCOR1, or acetylated histone H3 (acetyl-H3) with the PSA enhancer (androgen-response element) based on ChIP analysis using indicated antibodies. Siah2 KD increased the amount of AR and NCOR1 and decreased acetyl-H3 (pLKO.1 versus shSiah2: p < 0.05 for AR and p < 0.005 for NCOR1 or acetyl-H3). Re-expression of AKR1C3 partly decreased the amount of AR and NCOR1 and increased acetyl-H3 (shSiah2 versus shSiah2 + AKR1C3: p < 0.05 for AR or acetyl-H3 and p < 0.01 for NCOR1). C and D, analysis of intracellular testosterone and dihydrotestosterone levels. Rv1 cells were maintained in media containing 5% CS-FBS for 3 days and subjected to ELISA for T or DHT. Siah2 KD reduced the level of T or DHT (pLKO.1 versus shSiah2: p < 0.05). Re-expression of AKR1C3 in the Siah2 KD Rv1 cells could not increase the level of T or DHT (shSiah2 versus shSiah2 +AKR1C3: p > 0.1). E, effect of androgens on PSA transcript levels in Siah2 KD Rv1 cells. Cells were maintained in media containing 5% CS-FBS for 48 h, followed by incubation with DMSO vehicle, 1 nm R1881 or 10 nm DHT for 24 h, and then analyzed by qRT-PCR for PSA transcripts. Siah2 KD reduced the PSA transcript level in any condition (pLKO.1 versus shSiah2: p < 0.001 for DMSO or 10 nm DHT and p < 0.005 for 1 nm R1881). F, effect of androgens on proliferation of Siah2 KD Rv1 cells. Cells were maintained in media containing 5% CS-FBS with DMSO vehicle, 1 nm R1881, or 10 nm DHT. Cells were analyzed by an MTT assay at the indicated time points. Compared with pLKO.1 control, Siah2 KD reduced cell proliferation at any condition (DMSO: p < 5 × 10⁻⁴ at 24 h, p < 0.001 at 48 h, and p < 5 × 10⁻⁵ at 72 h; 1 nm R1881: p < 5 × 10⁻³ at 24 or 48 h and p < 5 × 10⁻⁴ at 72 h. 10 nm DHT: p < 5 × 10⁻⁵ at 24 h, p < 5 × 10⁻⁴ at 48 h, and p < 1 × 10⁻⁴ at 72 h). G and H, effect of AKR1C3 overexpression on the intracellular T (G) or DHT (H). Rv1 cells were transduced with the indicated lentiviral constructs, maintained, and analyzed as in C and D. Compared with control, overexpression of WT AKR1C3 increased the levels of T (p < 0.01) or DHT (p < 0.005), whereas overexpression of mutant AKR1C3 had no effect on either T or DHT (p > 0.1). I, re-expression of wild-type (WT) or catalytically inactive (CI) mutant AKR1C3 in Siah2 KD Rv1 cells. Siah2 was precipitated from indicated cells using Siah2 antibodies and analyzed by Western blotting with Siah2 antibodies. Relative intensity of Siah2 bands is shown at the bottom of the blot. Cell lysates were blotted with AKR1C3 or actin antibodies. IP, immunoprecipitation. J, effect of re-expression of mutant AKR1C3 on proliferation of Siah2 KD Rv1 cells. Indicated cells were maintained in media containing 5% CS-FBS and analyzed by an MTT assay at the indicated time points. Cell proliferation was reduced upon Siah2 KD (pLKO.1 versus shSiah2: p < 5 × 10⁻⁴ at 24, 48, or 72 h) but was partly increased upon re-expression of either WT AKR1C3 (shSiah2 versus shSiah2 + AKR1C3: p < 0.05 at 24 h, p < 0.001 at 48 h, and p < 0.01 at 72 h) or mutant AKR1C3 (shSiah2 versus shSiah2 + AKR1C3: p < 5 × 10⁻⁴ at 24 h and p < 0.005 at 48 or 72 h). K, re-expression of mutant AKR1C3 on colony formation by Siah2 KD Rv1 cells. Indicated cells were maintained in soft agar for 3 weeks, and the number of colonies per field was determined. The colony formation was reduced upon Siah2 KD (pLKO.1 versus shSiah2: p < 5 × 10⁻¹⁵). Compared with Siah2 KD, re-expression of either WT AKR1C3 (p < 5 × 10⁻¹⁰) or mutant AKR1C3 (p < 1 × 10⁻¹⁰) partly increased colony formation. L, effect of AKR1C3 re-expression on Siah2 transcript levels. Indicated Rv1 cells were analyzed by qRT-PCR for Siah2 transcripts. Compared with Siah2 KD, re-expression of WT AKR1C3 (p > 0.1) or mutant AKR1C3 (p > 0.1) had no effect on the Siah2 transcript level.
FIGURE 4.
FIGURE 4.
A, effect of AKR1C3 overexpression on ectopically expressed Siah2. GFP-Siah2 and FLAG-AKR1C3 were co-expressed in 293T cells, and 24 h later cells were analyzed by Western blotting with GFP, FLAG, or tubulin antibodies. B, effect of AKR1C3 overexpression on endogenous Siah2 levels. Rv1 cells were transfected with pcDNA control or FLAG-AKR1C3 plasmids. After 24 h, Siah2 was precipitated with Siah2 antibodies and analyzed by Western blotting using Siah2 antibodies. Lysates were analyzed by Western blotting with FLAG or actin antibodies. C, effect of AKR1C3 overexpression on Siah2 transcript levels. Rv1 cells in B were analyzed by qRT-PCR for Siah2 transcripts. Overexpression of FLAG-AKR1C3 had no effect on the Siah2 transcript level (p > 0.1). D, effect of AKR1C3 KD on Siah2 protein levels. Rv1 cells were transduced with control pLKO.1 or AKR1C3 shRNA and maintained in the media containing 5% CS-FBS for 48 h. Cells were then either treated or not treated with 1 nm R1881 for 24 h. Siah2 was precipitated and analyzed as in B. Relative intensity of Siah2 bands is shown at the bottom of the blot. E, effect of AKR1C3 KD on Siah2 transcript levels. Rv1 cells in D were analyzed by qRT-PCR for Siah2 transcripts. Compared with pLKO.1 control, AKR1C3 KD had no effect on Siah2 transcript levels with (p > 0.1) or without (p > 0.1) R1881 treatment. F, effect of AKR1C3 KD on Siah2 protein levels in DU145 or PC3 cells. AKR1C3 was knocked down using one of two different shRNAs (sh-1 or sh-2). After 48 h, Siah2 was analyzed as in D. G, effect of AKR1C3 KD on Siah2 transcript levels in DU145 or PC3 cells. Cells in F were analyzed by qRT-PCR for Siah2 transcripts. Compared with pLKO.1 control, knockdown of AKR1C3 with either of the two shRNAs had no effect on the Siah2 transcript level in DU145 (p > 0.1) or PC3 (p > 0.1) cells. H, effect of AKR1C3 overexpression on levels of Siah2 RING mutant. FLAG-AKR1C3 was co-expressed with GFP-Siah2 (WT or RING mutant) in 293T cells, and cells were analyzed by Western blotting with GFP, FLAG, or tubulin antibodies. The ratio between Siah2 and tubulin is shown at the bottom of the blot. I, half-life of ectopically expressed Siah2 following AKR1C3 overexpression. 293T cells were co-transfected with GFP-Siah2 and FLAG-AKR1C3 and 24 h later treated with cycloheximide (50 μg/ml). Cell lysates were collected at the indicated time points and analyzed by Western blotting with GFP, FLAG, or actin antibodies. The ratio between Siah2 and actin is shown at the bottom of the blot. J, effect of overexpression of the CI mutant AKR1C3 on ectopically expressed Siah2. 293 T cells were co-transfected with GFP-Siah2 and Myc-AKR1C3 (WT or CI mutant) and analyzed 24 h later by Western blotting with GFP, Myc, or tubulin antibodies. K, effect of AKR1C3 overexpression on the stability of endogenous Siah2. Rv1 cells were transfected with FLAG-AKR1C3 and treated with cycloheximide as in I. Siah2 was immunoprecipitated from samples at the indicated time points and analyzed by Western blotting with Siah2 antibodies. The relative intensity of Siah2 bands is shown at bottom of the blot. The input samples were blotted with FLAG or tubulin antibodies. IP, immunoprecipitation.
FIGURE 5.
FIGURE 5.
A, interaction of ectopically expressed Siah2 and AKR1C3. Myc-AKR1C3 and FLAG-Siah2 were co-expressed in 293T cells. FLAG-Siah2 was precipitated with anti-FLAG M2 beads, and bound proteins were analyzed by Western blotting with FLAG or Myc antibodies. B, Siah2/AKR1C3 interaction in vitro. GST-Siah2 and His-AKR1C3 were purified from E. coli and mixed. GST-Siah2 was pulled down using glutathione beads, and bound proteins were analyzed by Western blotting with GST or His antibodies. C, interaction of AKR1C3 and Siah2 fragments. 293T cells were transfected with full-length Myc-AKR1C3 and N-terminal (N), middle region (M), or C-terminal (C) fragments of FLAG-Siah2. FLAG-Siah2 fragments were precipitated with anti-FLAG M2 beads, and bound proteins were analyzed by Western blotting with Myc or FLAG antibodies. Input protein was blotted with Myc antibodies. D, effect of AKR1C3 on Siah2 self-ubiquitination. FLAG-Siah2 and HA-ubiquitin (Ub) were co-expressed with or without Myc-AKR1C3 in 293T cells. FLAG-Siah2 was precipitated with anti-FLAG M2 beads, and analyzed by Western blotting with HA or FLAG antibodies. The input protein was blotted with Myc or HA antibodies. E, effect of AKR1C3 on Siah2 self-ubiquitination in vitro. For an in vitro ubiquitination reaction, GST-Siah2 was incubated with E1, E2, and ubiquitin in the presence of increasing amounts of His-AKR1C3. GST-Siah2 was then pulled down with glutathione beads and analyzed by Western blotting with ubiquitin (upper panel) or GST (middle panel) antibodies. The input protein was blotted with His antibody. F and G, effect of AKR1C3 on Siah2-mediated degradation of AR or NCOR1. FLAG-AR (F) or FLAG-NCOR1 (G) was co-expressed with indicated plasmids in 293T cells. Cell lysates were analyzed by Western blotting with FLAG, GFP, or actin antibodies. IP, immunoprecipitation.
FIGURE 6.
FIGURE 6.
A, representative images of sections of PCa TMA subjected to immunohistochemistry for AKR1C3 (left panels) or Siah2 (right panels). Signals were visualized with DAB, and samples were counterstained with hematoxylin. Top panels, low AKR1C3 or Siah2 staining in BPH. Middle panels, low AKR1C3 or Siah2 staining in low grade PCa. Bottom panels, high expression of AKR1C3 or Siah2 in a CRPC specimen. B and C, quantification of AKR1C3 (B) or Siah2 (C) staining in PCa TMA. Staining was scored as 0 to 3 (0, no staining; 1, weak; 2, moderate; and 3, strong). Shown is the average staining score in BPH; the indicated PCa types were classified by Gleason (G) grade and CRPC. n = 33, 68, 51, 19, and 15 for BPH, G3, G4, G5, and CPRP, respectively. AKR1C3 or Siah2 staining was increased in G3 compared with BPH (p < 0.0001 for AKR1C3 and p < 0.05 for Siah2), in G4 compared with G3 (p < 0.05 for AKR1C3 and p < 5 × 10⁻⁶ for Siah2), in CRPC compared with G5 (p = 0.06 for AKR1C3 and p < 0.01 for Siah2) but decreased in G5 compared with G4 (p < 0.05 for AKR1C3 and p < 0.01 for Siah2). D and E, Kaplan-Meier curve analysis of PCa patients with high or low AKR1C3 staining (D) or with high or low Siah2 staining (E) for PSA recurrence after surgery or radiation therapy. For AKR1C3 or Siah2 staining, scores of 0 or 1 were classified as low expression, and scores of 2 or 3 as high. AKR1C3 high or Siah2 high groups had a quicker PSA recurrence (p < 0.001 for AKR1C3 low versus AKR1C3 high and p = 0.05 for Siah2 low versus Siah2 high).

References

    1. Siegel R., Naishadham D., Jemal A. (2012) Cancer statistics, 2012. CA-Cancer J. Clin. 62, 10–29 - PubMed
    1. Yuan X., Cai C., Chen S., Chen S., Yu Z., Balk S. P. (2014) Androgen receptor functions in castration-resistant prostate cancer and mechanisms of resistance to new agents targeting the androgen axis. Oncogene 33, 2815–2825 - PMC - PubMed
    1. Taylor B. S., Schultz N., Hieronymus H., Gopalan A., Xiao Y., Carver B. S., Arora V. K., Kaushik P., Cerami E., Reva B., Antipin Y., Mitsiades N., Landers T., Dolgalev I., Major J. E., et al. (2010) Integrative genomic profiling of human prostate cancer. Cancer Cell 18, 11–22 - PMC - PubMed
    1. Grasso C. S., Wu Y. M., Robinson D. R., Cao X., Dhanasekaran S. M., Khan A. P., Quist M. J., Jing X., Lonigro R. J., Brenner J. C., Asangani I. A., Ateeq B., Chun S. Y., Siddiqui J., Sam L., et al. (2012) The mutational landscape of lethal castration-resistant prostate cancer. Nature 487, 239–243 - PMC - PubMed
    1. Antonarakis E. S., Lu C., Wang H., Luber B., Nakazawa M., Roeser J. C., Chen Y., Mohammad T. A., Chen Y., Fedor H. L., Lotan T. L., Zheng Q., De Marzo A. M., Isaacs J. T., Isaacs W. B., et al. (2014) AR-V7 and resistance to enzalutamide and abiraterone in prostate cancer. N. Engl. J. Med. 371, 1028–1038 - PMC - PubMed

Publication types

MeSH terms