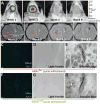
In Vivo Tracking of Human Neural Progenitor Cells in the Rat Brain Using Magnetic Resonance Imaging Is Not Enhanced by Ferritin Expression
- PMID: 26160767
- PMCID: PMC5052815
- DOI: 10.3727/096368915X688614
In Vivo Tracking of Human Neural Progenitor Cells in the Rat Brain Using Magnetic Resonance Imaging Is Not Enhanced by Ferritin Expression
Abstract
Rapid growth in the field of stem cell research has generated a lot of interest in their therapeutic use, especially in the treatment of neurodegenerative diseases. Specifically, human neural progenitor cells (hNPCs), unique in their capability to differentiate into cells of the neural lineage, have been widely investigated due to their ability to survive, thrive, and migrate toward injured tissues. Still, one of the major roadblocks for clinical applicability arises from the inability to monitor these cells following transplantation. Molecular imaging techniques, such as magnetic resonance imaging (MRI), have been explored to assess hNPC transplant location, migration, and survival. Here we investigated whether inducing hNPCs to overexpress ferritin (hNPCs(Fer)), an iron storage protein, is sufficient to track these cells long term in the rat striatum using MRI. We found that increased hypointensity on MRI images could establish hNPC(Fer) location. Unexpectedly, however, wild-type hNPC transplants were detected in a similar manner, which is likely due to increased iron accumulation following transplantation-induced damage. Hence, we labeled hNPCs with superparamagnetic iron oxide (SPIO) nanoparticles to further increase iron content in an attempt to enhance cell contrast in MRI. SPIO-labeling of hNPCs (hNPCs-SPIO) achieved increased hypointensity, with significantly greater area of decreased T2* compared to hNPC(Fer) (p < 0.0001) and all other controls used. However, none of the techniques could be used to determine graft rejection in vivo, which is imperative for understanding cell behavior following transplantation. We conclude that in order for cell survival to be monitored in preclinical and clinical settings, another molecular imaging technique must be employed, including perhaps multimodal imaging, which would utilize MRI along with another imaging modality.
Figures


Similar articles
-
Longitudinal Magnetic Resonance Imaging Tracking of Transplanted Neural Progenitor Cells in the Spinal Cord Utilizing the Bright-Ferritin Mechanism.Stem Cells Transl Med. 2024 Jun 14;13(6):546-558. doi: 10.1093/stcltm/szae016. Stem Cells Transl Med. 2024. PMID: 38457239 Free PMC article.
-
A DNA hybridization system for labeling of neural stem cells with SPIO nanoparticles for MRI monitoring post-transplantation.Biomaterials. 2015 Jun;54:158-67. doi: 10.1016/j.biomaterials.2015.03.017. Epub 2015 Apr 3. Biomaterials. 2015. PMID: 25907049
-
Ferumoxytol Labeling of Human Neural Progenitor Cells for Diagnostic Cellular Tracking in the Porcine Spinal Cord with Magnetic Resonance Imaging.Stem Cells Transl Med. 2017 Jan;6(1):139-150. doi: 10.5966/sctm.2015-0422. Epub 2016 Aug 29. Stem Cells Transl Med. 2017. PMID: 28170192 Free PMC article.
-
Dual contrast magnetic resonance imaging tracking of iron-labeled cells in vivo.Cytotherapy. 2010 Nov;12(7):859-69. doi: 10.3109/14653241003587652. Cytotherapy. 2010. PMID: 20184501 Review.
-
Tracking stem cells with superparamagnetic iron oxide nanoparticles: perspectives and considerations.Int J Nanomedicine. 2017 Jan 25;12:779-793. doi: 10.2147/IJN.S126530. eCollection 2017. Int J Nanomedicine. 2017. PMID: 28182122 Free PMC article. Review.
Cited by
-
MRI-based cell tracking of OATP-expressing cell transplants by pre-labeling with Gd-EOB-DTPA.Res Sq [Preprint]. 2023 Dec 12:rs.3.rs-3698429. doi: 10.21203/rs.3.rs-3698429/v1. Res Sq. 2023. Update in: Mol Imaging Biol. 2024 Apr;26(2):233-239. doi: 10.1007/s11307-024-01904-2. PMID: 38168297 Free PMC article. Updated. Preprint.
-
Nanotechnology for Neuroscience: Promising Approaches for Diagnostics, Therapeutics and Brain Activity Mapping.Adv Funct Mater. 2017 Oct 19;27(39):1700489. doi: 10.1002/adfm.201700489. Epub 2017 Aug 14. Adv Funct Mater. 2017. PMID: 30853878 Free PMC article.
-
Effects of neural stem cell transplantation in Alzheimer's disease models.J Biomed Sci. 2020 Jan 27;27(1):29. doi: 10.1186/s12929-020-0622-x. J Biomed Sci. 2020. PMID: 31987051 Free PMC article. Review.
-
Biogenic Imaging Contrast Agents.Adv Sci (Weinh). 2023 Sep;10(25):e2207090. doi: 10.1002/advs.202207090. Epub 2023 Jul 3. Adv Sci (Weinh). 2023. PMID: 37401173 Free PMC article. Review.
-
Molecular fMRI.J Neurosci. 2016 Apr 13;36(15):4139-48. doi: 10.1523/JNEUROSCI.4050-15.2016. J Neurosci. 2016. PMID: 27076413 Free PMC article. Review.
References
-
- Arbab AS, Bashaw LA, Miller BR, Jordan EK, Lewis BK, Kalish H, Frank JA. Characterization of biophysical and metabolic properties of cells labeled with superparamagnetic iron oxide nanoparticles and transfection agent for cellular MR imaging. Radiology. 2003;229(3):838–846. - PubMed
-
- Bachoud-Levi AC, Remy P, Nguyen JP, Brugieres P, Lefaucheur JP, Bourdet C, Baudic S, Gaura V, Maison P, Haddad B, Boisse MF, Grandmougin T, Jeny R, Bartolomeo P, Dalla Barba G, Degos JD, Lisovoski F, Ergis AM, Pailhous E, Cesaro P, Hantraye P, Peschanski M. Motor and cognitive improvements in patients with Huntington’s disease after neural transplantation. Lancet. 2000;356(9246):1975–1979. - PubMed
-
- Behrstock S, Ebert AD, McHugh J, Vosberg S, Moore J, Schneider B, Capowski E, Hei D, Kordower J, Aebischer P, Svendsen CN. Human neural progenitors deliver glial cell line-derived neurotrophic factor to parkinsonian rodents and aged primates. Gene Ther. 2006;13(5):379–388. - PubMed
Publication types
MeSH terms
Substances
Grants and funding
LinkOut - more resources
Full Text Sources
Other Literature Sources
Medical

