. 2015 Sep 15;6(27):23857-73.
doi: 10.18632/oncotarget.4408.

Lovastatin overcomes gefitinib resistance through TNF-α signaling in human cholangiocarcinomas with different LKB1 statuses in vitro and in vivo

Affiliations

Lovastatin overcomes gefitinib resistance through TNF-α signaling in human cholangiocarcinomas with different LKB1 statuses in vitro and in vivo

Sheng-Huei Yang et al. Oncotarget. .

Abstract

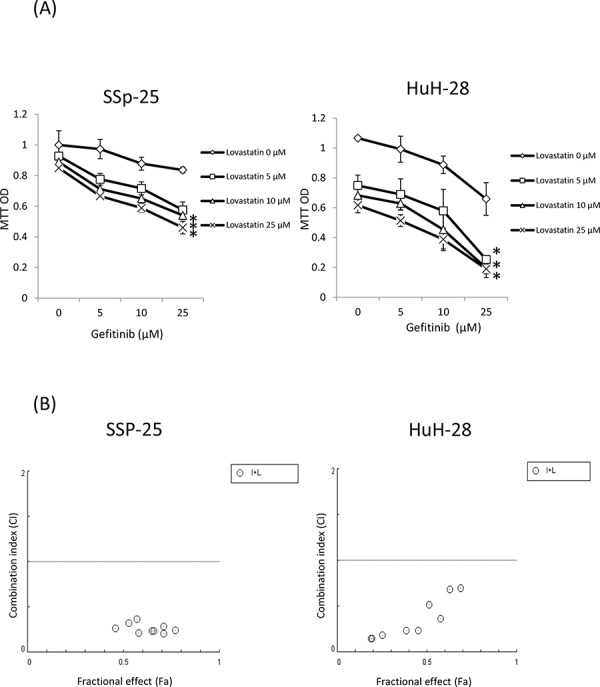
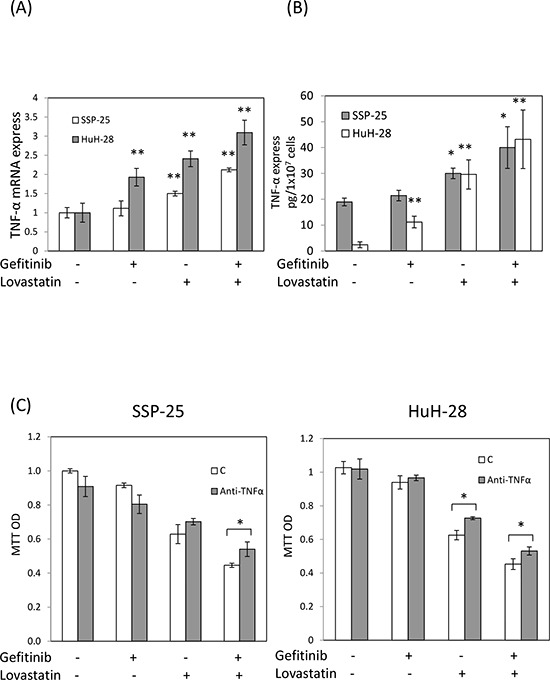
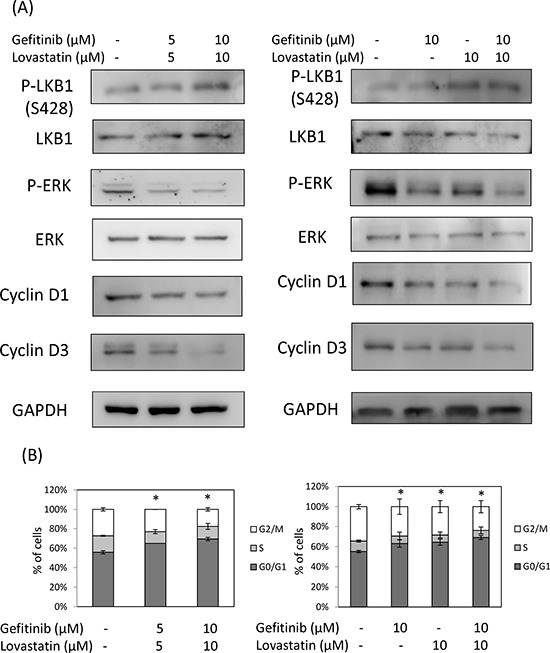
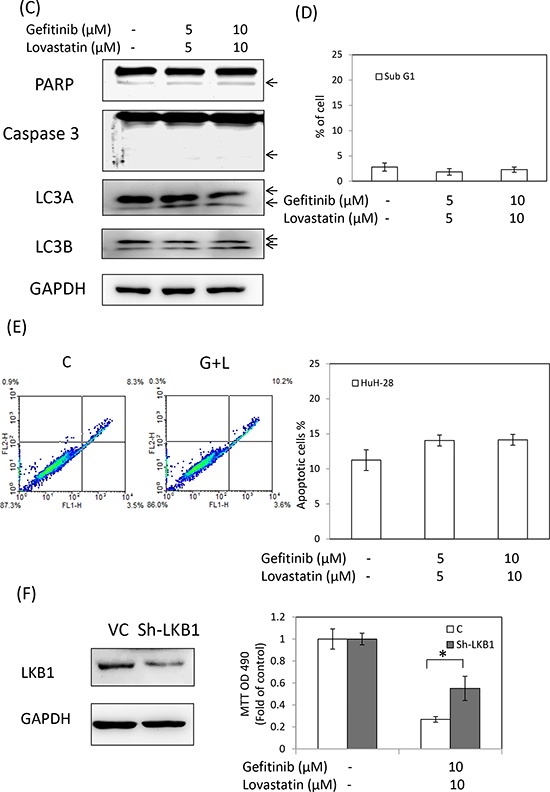
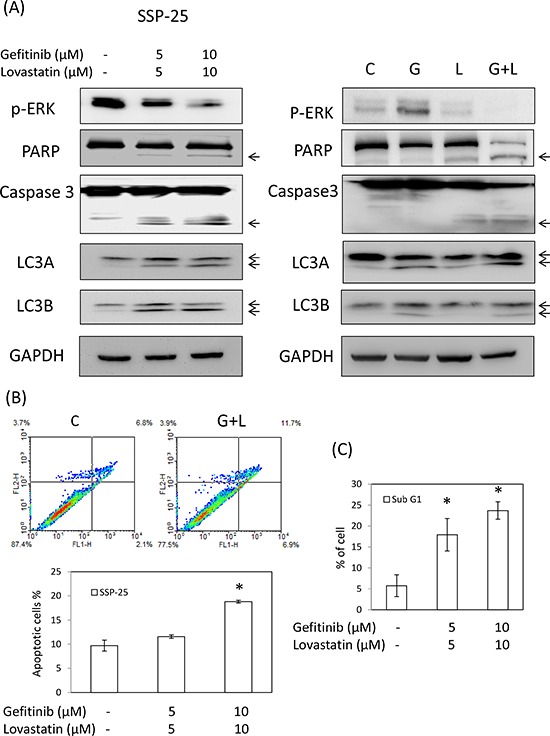
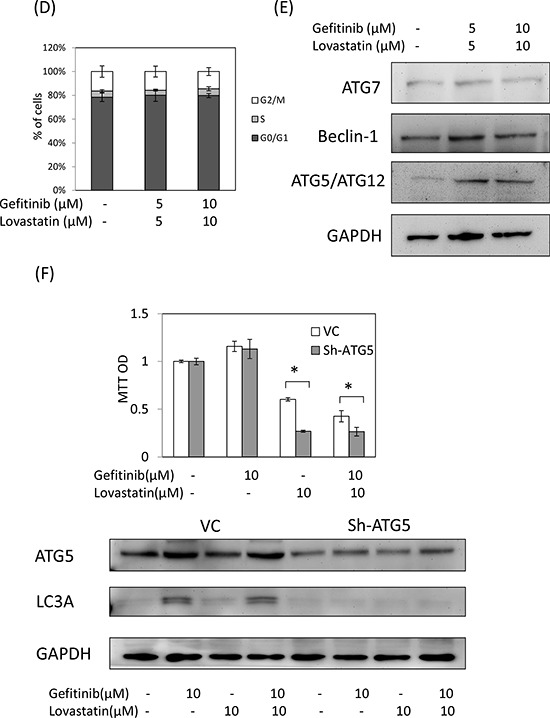
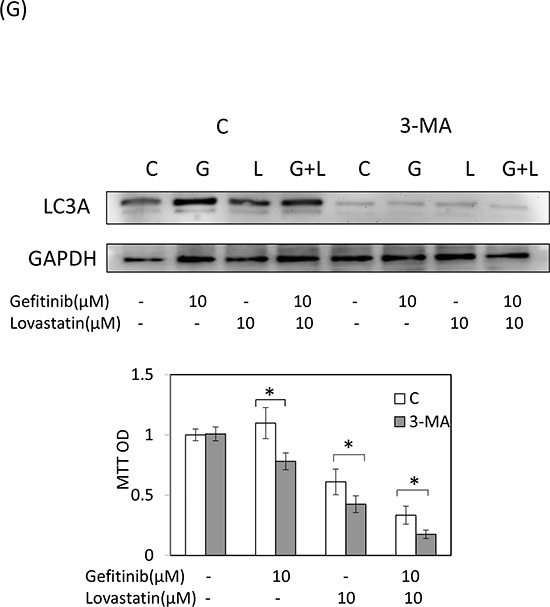
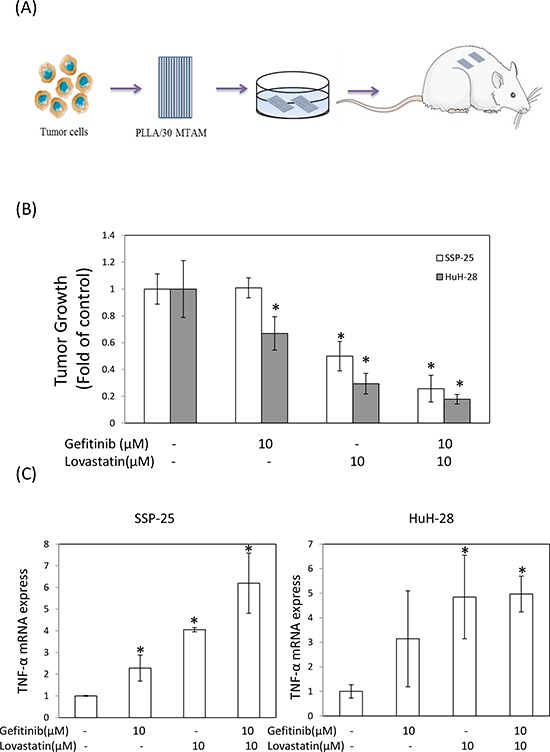
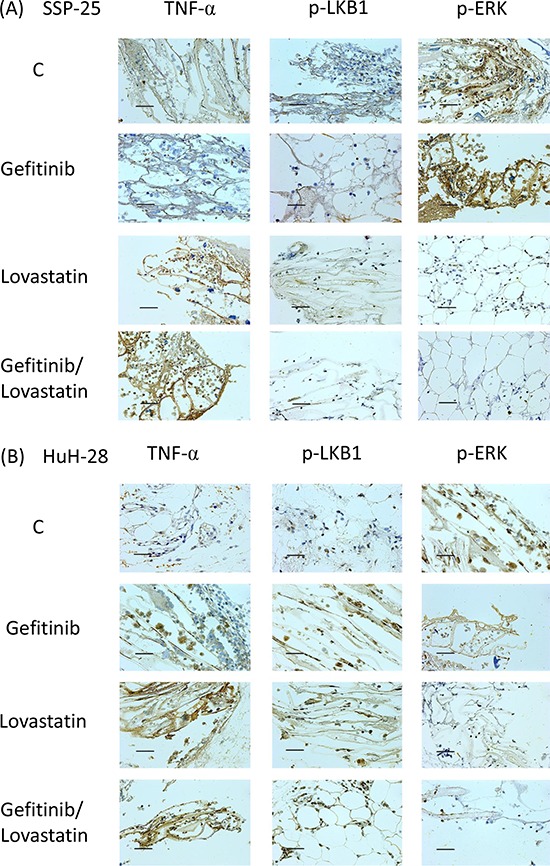
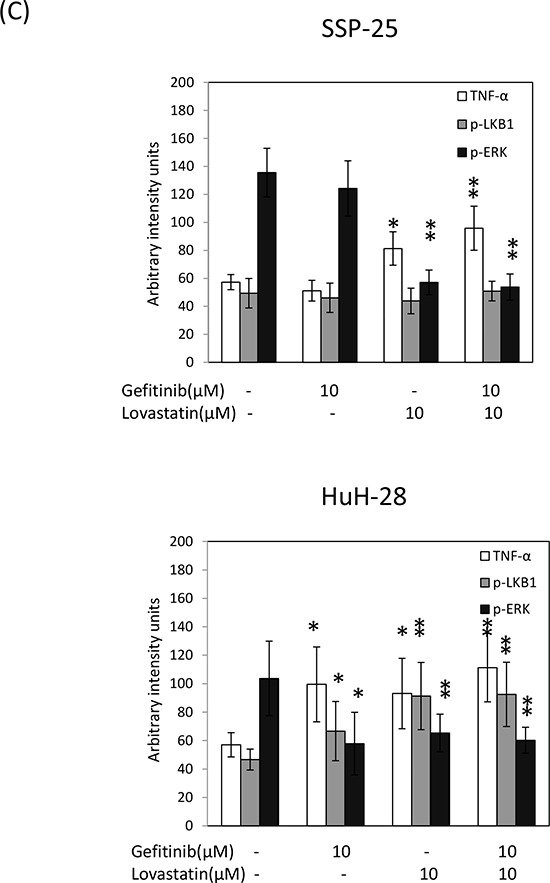
Gefitinib resistance has been shown to complicate cancer therapy. Lovastatin is a proteasome inhibitor that enhances gefitinib-induced antiproliferation in non-small cell lung cancer. The objective of this study is to investigate the mechanism of lovastatin-induced antiproliferation in gefitinib-resistant human cholangiocarcinoma.Two gefitinib-resistant cholangiocarcinoma cell lines, SSP-25 and HuH-28, were used in this study to determine how to compensate gefitinib resistance. The combined effect of these two drugs was examined using the MTT assay, qPCR, immunoblotting, flow cytometry, and in vivo xenograft. Results indicated that lovastatin enhanced TNF-α-induced cell death in vitro. In addition, the combination of lovastatin with gefitinib enhanced accumulation of TNF-α. Furthermore, the treatment induced a synergistic cytotoxic effect and antiproliferation through apoptosis in SSP-25 cells and cell cycle arrest in HuH-28 cells. Reproductive results were also observed in in vivo xenografts. These observations suggest that the combination of gefitinib and lovastatin might have additive antiproliferative effects against gefitinib-resistant cholangiocarcinoma cells. Based on these observations, we concluded that the combination of gefitinib and lovastatin could be used to overcome gefitinib resistance in cholangiocarcinoma cells.

Keywords: cholangiocarcinomas; combination therapy; gefitinib; lovastatin.


Conflict of interest statement

CONFLICTS OF INTEREST

The authors declare no conflict of interest.

Figures

Figure 1
Figure 1. Combined treatment of lovastatin and gefitinib induced antiproliferation in human intrahepatic cholangiocarcinoma SSP-25 and HuH-28 cells
A. SSP-25 and HuH-28 cells grown in 96-well trays were treated with lovastatin (L), gefitinib (G), or their combination (G + L) for 72 hours. Cell viability was detected using the MTT assay. B. Combination index (CI) values were calculated using the cell survival values in CompuSyn software, as described in Materials and Methods. Student's t test was conducted and considered significant at p < 0.05 (*)
Figure 2
Figure 2. Combined treatment of lovastatin and gefitinib induced synergistic effects on the expression of TNF
A. SSP-25 cells and HuH-28 cells (1 × 10⁶/well) were treated with lovastatin (L), gefitinib (G), or their combination (G + L) for 16 hours. Cells were harvested, and total RNA was extracted. The expression of TNF-α mRNA was detected using qPCR, as described in Materials and Methods. B. SSP-25 cells and HuH-28 cells (1 × 10⁷/well) were treated with lovastatin (L), gefitinib (G), or their combination (G + L) for 24 hours. Cells were harvested, and total protein was extracted. The expression of TNF-α expression was detected using TNF-α detect kit, as described in Materials and Methods. C. SSP-25 cells (left panel) or HuH-28 cells (right panel) (1 × 10³/well) pretreated with the anti-TNF-α antibody (0.2 μg/mL; MAB610, R&B systems) for 1 hour were treated with lovastatin (L), gefitinib (G), or their combination (G + L) for 72 hours. Cell viability was detected using the MTT assay. Student's t test was conducted and considered significant at p < 0.05 (*), 0.01 (**).
Figure 3
Figure 3. Combined treatment of lovastatin and gefitinib induced cell cycle arrest in HuH-28 cells
Cells grown in six-well trays were treated with lovastatin (L) and gefitinib (G) for 24 hours. A. Cells were harvested, and total proteins were extracted. The cell cycle-related proteins p-LKB1, LKB1, p-ERK, ERK, cyclin D1, and cyclin D3 were detected using western blotting analyses. B. Cell cycle assay. Cells were harvested and fixed with ethanol. Cells were stained with RNase A/PI at 37°C for 1 hour. Flow cytometry analysis of the DNA content of the cells was performed using a FACSCalibur flow cytometer (Becton Dickinson, USA), and 10 000 events were collected and analyzed using WinMDI 2.9 software. C. Apoptosis and autophagy analysis. Cells were harvested, and total proteins were extracted. The cell cycle-related proteins PARP, caspase3, LC3A and LC3B were detected using western blotting analyses. D. Sub-G1 formation. Cells were harvested and fixed with ethanol. Cells were stained with RNase A/PI at 37°C for 1 hour. Flow cytometry analysis of the DNA content of the cells was performed using a FACSCalibur flow cytometer (Becton Dickinson, USA), and 10 000 events were collected and analyzed using WinMDI 2.9 software. E. Annexin V assay. Cells were harvested and stained by annexin V /Dead Cell Apoptosis Kit (Invitrogen). Flow cytometry analysis of the expression of the cells was performed using a FACSCalibur flow cytometer (Becton Dickinson, USA), and 10 000 events were collected and analyzed using WinMDI 2.9 software. F. HuH-28 cells were stably transfected with shLKB1 plasmid for 72 h, and selection by puromycin. Cells were harvested, and total proteins were extracted. Total LKB1 protein was detected using western blotting analyses. HuH-28 cells stably transfected with shLKB1 plasmid were seeded in a 96-well tray (1 × 10³/well) and were treated with a combination of lovastatin (L) and gefitinib (G) for 72 hours. Cell viability was detected using the MTT assay.
Figure 4
Figure 4. Combined treatment of gefitinib and lovastatin induced apoptosis and autophagy in SSP-25 cells
The cells (1 × 10⁶/well) were seeded in a six-well tray and treated with a combination of gefitinib and lovastatin for 24 hours. Cells were harvested, and total proteins were extracted. A. The apoptosis markers, including the cleavage of caspase-3 and PARP and the autophagy markers LC3A and LC3B, were detected using western blotting analyses. B. Annexin V assay. C. Sub-G1 formation. D. The cell cycle population was detected using flow cytometry. E. The autophagy-related proteins, including beclin-1, ATG7, and ATG5/ATG12 complex, were detected using western blotting analyses. F. SSP-25 cells were stably transfected with shATG5 plasmid for 72 h, and selected by puromycin. Cells were harvested, and total proteins were extracted. Total ATG5 protein was detected using western blotting analyses. SSP-25 cells stably transfected with shATG5 plasmid were seeded in a 96-well tray (1 × 10³/well) and were treated with lovastatin, gefitinib, or their combination for 72 hours. Cell viability was detected using the MTT assay. Student's t test was conducted and considered significant at p < 0.05 (*). G. SSP-25 cells grown in 96-well trays were pre-treated with 3-MA(1 mM) for 1 hr, and treated with lovastatin (L), gefitinib (G), or their combination (G + L) for 72 hours. Cell viability was detected using MTT assay. Autophagy inhibition was detected by western blotting.
Figure 5
Figure 5. Combined treatment of lovastatin and gefitinib induced antitumor growth activity of human intrahepatic cholangiocarcinoma SSP-25 and HuH-28 cells grown in MTAMs and cultivated in mice
A. Schematic representation of the experiment. SSP-25 or HuH-28 cells (1 × 10⁵ cells/mL) grown in MTAMs were implanted subcutaneously into mice for 72 hours, treated with drugs, and then harvested at 72 hours for B. the MTT assays, C. RT-PCR. Student's t test was conducted and considered significant at p < 0.05 (*).
Figure 6
Figure 6. Combined treatment of lovastatin and gefitinib induced the expression of TNFα and inhibited the expression of p-ERK in SSP-25 and HuH-28 cell lines, and increased p-LKB1 in HuH-28 cell lines
A. SSP-25 or B. HuH-28 cells (1 × 10⁵ cells/mL) grown in MTAMs were implanted subcutaneously into mice for 72 hours, treated with the drug, and then harvested after 72 hours; the protein expression was detected using IHC staining. The blue stain is a result of hematoxylin as a nuclear counterstain. Magnification, 400 ×. Scale bar, 20 μm. C. The MTAMs were imaged and calculated with the Image J software. Twenty randomly selected cells were calculated and expressed as the mean ± S.D. of intensity/cells in MTAMs. Student's t test was conducted and considered significant at p < 0.05 (*), 0.01 (**).

Similar articles

Cited by

References

    1. Leone F, Cavalloni G, Pignochino Y, Sarotto I, Ferraris R, Piacibello W, Venesio T, Capussotti L, Risio M, Aglietta M. Somatic mutations of epidermal growth factor receptor in bile duct and gallbladder carcinoma. Clinical cancer research: an official journal of the American Association for Cancer Research. 2006;12:1680–1685. - PubMed
    1. Hsu M, Sasaki M, Igarashi S, Sato Y, Nakanuma Y. KRAS and GNAS mutations and p53 overexpression in biliary intraepithelial neoplasia and intrahepatic cholangiocarcinomas. Cancer. 2013;119:1669–1674. - PubMed
    1. Wu CC, Yu CT, Chang GC, Lai JM, Hsu SL. Aurora-A promotes gefitinib resistance via a NF-kappaB signaling pathway in p53 knockdown lung cancer cells. Biochemical and biophysical research communications. 2011;405:168–172. - PubMed
    1. Massarelli E, Varella-Garcia M, Tang X, Xavier AC, Ozburn NC, Liu DD, Bekele BN, Herbst RS, Wistuba II. KRAS mutation is an important predictor of resistance to therapy with epidermal growth factor receptor tyrosine kinase inhibitors in non-small-cell lung cancer. Clinical cancer research: an official journal of the American Association for Cancer Research. 2007;13:2890–2896. - PubMed
    1. Daines WP, Rajagopalan V, Grossbard ML, Kozuch P. Gallbladder and biliary tract carcinoma: A comprehensive update, Part 2. Oncology. 2004;18:1049–1059. discussion 1060, 1065-1046, 1068. - PubMed

Publication types

MeSH terms