. 2015 Aug 15;142(16):2740-51.
doi: 10.1242/dev.119339. Epub 2015 Jul 9.

Scalloped and Yorkie are required for cell cycle re-entry of quiescent cells after tissue damage

Affiliations

Scalloped and Yorkie are required for cell cycle re-entry of quiescent cells after tissue damage

Joy H Meserve et al. Development. .

Abstract

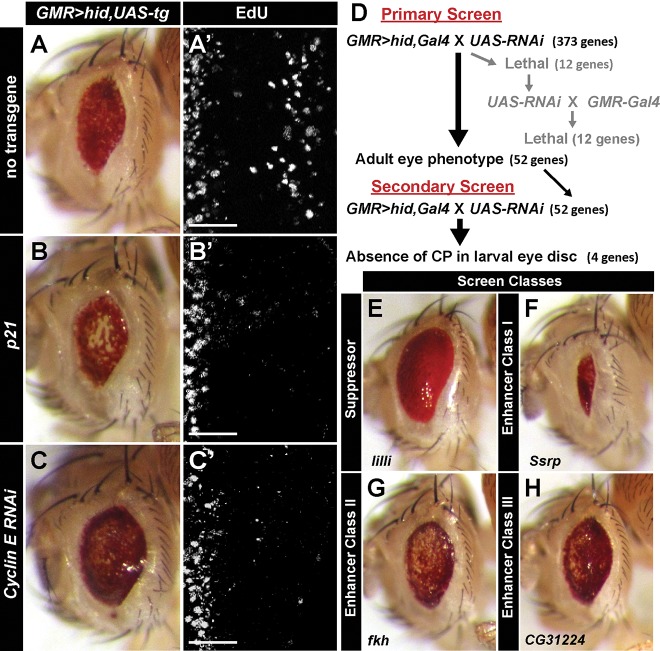
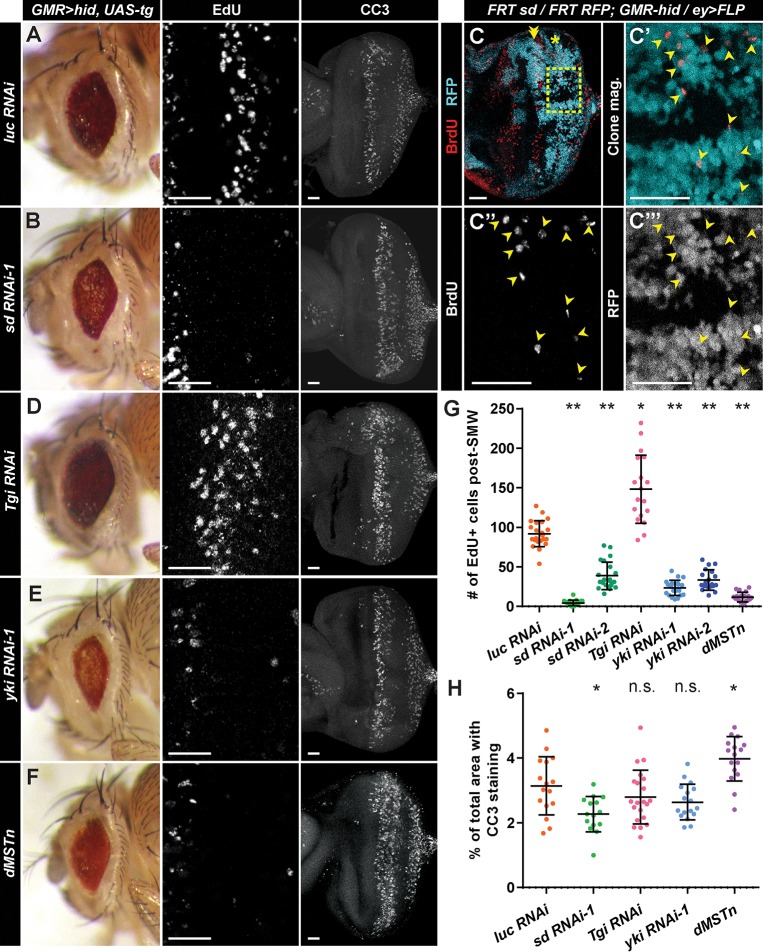
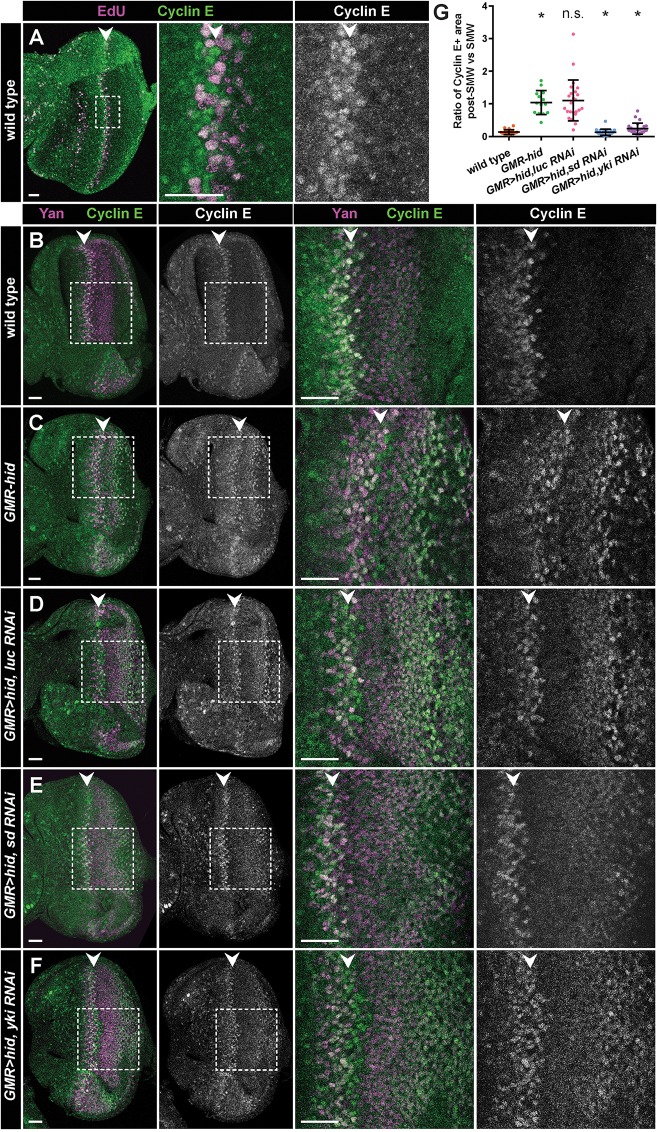
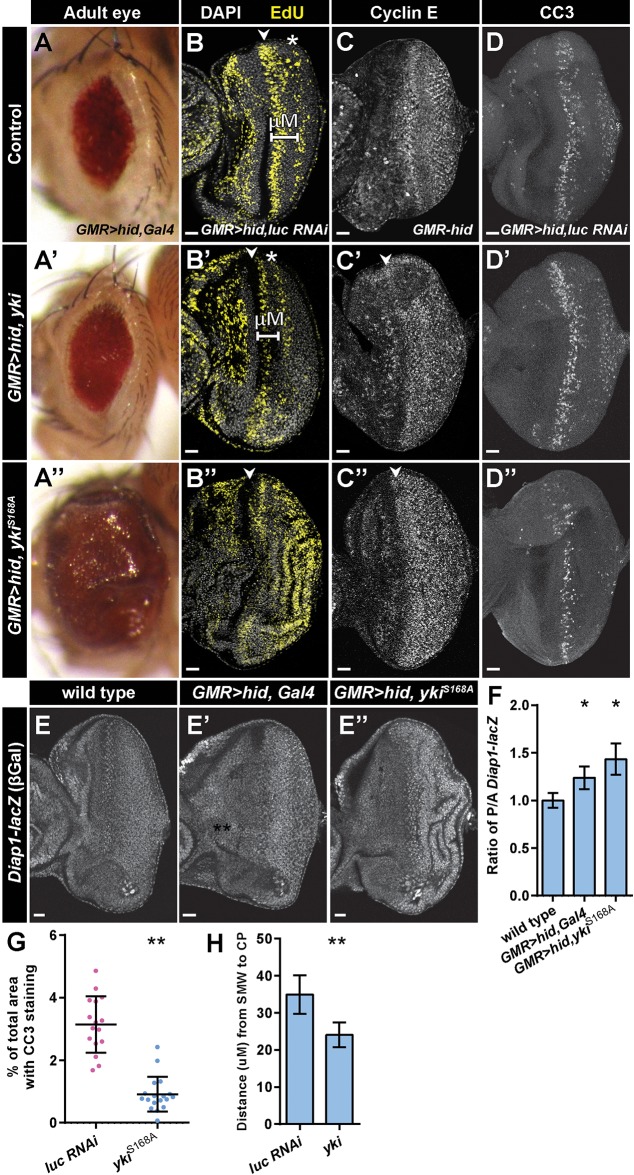
Regeneration of damaged tissues typically requires a population of active stem cells. How damaged tissue is regenerated in quiescent tissues lacking a stem cell population is less well understood. We used a genetic screen in the developing Drosophila melanogaster eye to investigate the mechanisms that trigger quiescent cells to re-enter the cell cycle and proliferate in response to tissue damage. We discovered that Hippo signaling regulates compensatory proliferation after extensive cell death in the developing eye. Scalloped and Yorkie, transcriptional effectors of the Hippo pathway, drive Cyclin E expression to induce cell cycle re-entry in cells that normally remain quiescent in the absence of damage. Ajuba, an upstream regulator of Hippo signaling that functions as a sensor of epithelial integrity, is also required for cell cycle re-entry. Thus, in addition to its well-established role in modulating proliferation during periods of tissue growth, Hippo signaling maintains homeostasis by regulating quiescent cell populations affected by tissue damage.

Keywords: Apoptosis; Cell cycle; Compensatory proliferation; Drosophila; Hippo signaling; Quiescence; Regeneration.


Figures

Fig. 1.
Fig. 1.
Hid expression induces CP in the eye imaginal disc. (A,C,I) Adult eyes of the indicated genotypes. Wild-type (A) is Oregon R. (B,D,J) DAPI (DNA; single confocal slice in gray) and EdU (S phase; projection in yellow) staining of eye imaginal discs, indicating the MF (arrowheads) and the SMW (double arrowheads), respectively. Note that EdU+ cells in the row of cells around the disc (arrows in B) are margin cells and not part of the disc proper. Asterisk denotes CP (D). Boxes indicate areas of magnification shown in B′D′,J′. (E,F,K) Cleaved Caspase-3 (CC3) staining of apoptotic cells in discs of the indicated genotypes. The first (1) and second (2) apoptotic waves are indicated in (F). (G,H) In situ hybridization for hid mRNA in the indicated genotypes. (L) The eye disc, attached to the anterior (A) antennal disc, is composed of undifferentiated, proliferating cells (blue) anterior to the MF (green) and both undifferentiated and differentiated quiescent cells (yellow) posterior (P) to the SMW (red). Cells furthest from the MF (most posterior) are the most differentiated. (M) Quantification of CP in the indicated genotypes. All post-SMW, EdU+ eye disc cells were counted. Each circle represents the number of cells counted for a single disc, and bars represent mean and one standard deviation. For each genotype, n≥22 discs. **P=2.6×10⁻¹⁷. (N) Quantification of percentage of total disc area with CC3 staining. Each circle represents the percentage for a single disc, and bars represent mean and one standard deviation. n>15 discs. **P=2.4×10⁻¹⁴. n.s., not significant. Anterior is oriented to the left. Scale bars: 20 μm.
Fig. 2.
Fig. 2.
Genetic screen for regulators of compensatory proliferation. (A-C′) Adult eyes (A-C) and high magnification view of posterior eye imaginal discs (A′-C′; as in Fig. 1B′) expressing the indicated UAS-transgenes in GMR-hid, GMR-Gal4/+ individuals. (D) Schematic of the RNAi screen. (E-H) Representative examples of the four categories of adult eye phenotypes resulting from the RNAi screen. See also supplementary material Table S1 and Figs S3,S4. Anterior is oriented to the left. Scale bars: 20 μm.
Fig. 3.
Fig. 3.
sd and yki are required for compensatory proliferation. (A,B,D-F) Adult eyes (left panels), high magnification of posterior eye discs stained with EdU (middle panels), and apoptosis as detected by CC3 staining (right panels) in GMR>hid, Gal4 discs expressing the indicated transgenes. luciferase (luc) RNAi is used as a control (A). (C-C‴) Clones of wild-type (RFP+, cyan) and sd mutant (RFP) cells in the GMR-hid background. Boxed area in C indicates area of magnification shown in C′-C‴. Double arrowhead indicates SMW; asterisk indicates CP. Arrowheads indicate BrdU+ cells. (G) Quantification of CP in the GMR>hid, Gal4 background for the indicated UAS-transgenes. Each circle represents the number of cells counted for a single disc, and bars represent mean and one standard deviation. For each genotype, n≥19 discs. (H) Quantification of percentage of total disc area with CC3 staining in the GMR>hid, Gal4 background for the indicated UAS-transgenes. Each circle represents the percentage for a single disc, and bars represent mean and one standard deviation. For each genotype, n≥15 discs. *P≤3×10⁻³, **P≤3×10⁻¹³. n.s., not significant. Anterior is oriented to the left. Scale bars: 20 μm.
Fig. 4.
Fig. 4.
Sd and Yki are required for elevated Cyclin E levels during CP. (A) Eye disc labeled with EdU (magenta) and anti-Cyclin E (green) antibodies. Cyclin E accumulates prior to and during S phase of the SMW (arrowhead). Box in left panel indicates area of magnification in middle and right panels. (B-F) Eye discs of the indicated genotypes stained with anti-Cyclin E (green) and anti-Yan (marker of undifferentiated cells; magenta) antibodies. Boxes indicate areas shown at higher magnification on the right. Arrowheads indicate SMW. (G) Quantification of Cyclin E staining in Yan+ cells of the indicated genotypes. The ratio of post-SMW Cyclin E staining versus SMW Cyclin E staining is displayed (see supplementary Methods for details). Each circle represents the ratio calculated for a single disc, and bars represent mean and one standard deviation. For each genotype, n≥14 discs. *P≤1.8×10⁻⁷. Significance was calculated for wild type (w1118) versus GMR-hid, GMR-hid versus GMR>hid, luc RNAi, GMR>hid, luc RNAi versus GMR>hid, sd RNAi, and GMR>hid, luc RNAi versus GMR>hid, yki RNAi. n.s., not significant. Anterior is oriented to the left. Scale bars: 20 μm.
Fig. 5.
Fig. 5.
Expression of transgenic yki modifies the GMR-hid phenotype. (A-A″) GMR>hid, Gal4 adult eyes (control in A) after expression of yki (A′) or ykiS168A (A″). (B-B″) EdU staining (yellow) in eye discs of the indicated genotypes. Arrowheads indicate SMW. The white bar (B,B′) indicates the distance measured between the SMW and CP (asterisk) (data shown in H). (C-C″) Cyclin E staining of the indicated genotypes. (D-D″) CC3 staining of the indicated genotypes. (E-E″) β-Gal staining of the indicated genotypes detects Diap1-lacZ expression. (F) Quantification of Diap1-lacZ expression by β-Gal staining [ratio of posterior to anterior (P/A) eye disc, normalized to w1118 control] in the indicated genotypes. Error bars represent one standard deviation. *P≤6×10⁻⁴, n≥11 discs. (G) Quantification of percentage of total disc area with post-furrow CC3 staining in GMR>hid, Gal4 eye discs expressing luc RNAi (n=16) or ykiS168A (n=18). Each circle represents the percentage calculated for a single disc, and bars represent mean and one standard deviation. **P=3.64×10⁻⁶. (H) Quantification of the distance between the SMW and CP wave in GMR>hid, Gal4 eye discs expressing luc RNAi (n=25) or yki RNAi (n=22). **P=8.47×10⁻¹¹. Error bars represent one standard deviation. Anterior is oriented to the left. Scale bars: 20 μm.
Fig. 6.
Fig. 6.
Jub and cellular tension regulate compensatory proliferation. (A,B,F,I) Adult eyes (left panels) and high magnification of post-furrow EdU staining (right panels) of the indicated genotypes. (C,D) Jub-GFP (yellow) colocalizes with DE-cadherin (magenta; C) and Futsch/22C10, a marker of neuronal membranes (magenta; D), at the apical surface of post-furrow eye discs. (E) Clones of GMR-hid (no marker) and wild-type (RFP+, magenta) cells expressing Jub-GFP (yellow). Boxes in top panels indicate area of magnification shown in bottom panels. (G,H,J,K) High magnification of post-furrow EdU staining (left panels) and CC3 staining (right panels) of the indicated genotypes. Arrowheads mark the MF. GMR>RokCAT (G) and GMR>Cdc42DN (J) induce CC3-positive apoptotic cells posterior to the MF. Interestingly, apoptotic cells are also observed anterior to the furrow in these discs. The mechanism triggering this apoptosis is unknown, but its absence in GMR>RokCAT, p35 (H) or GMR>Cdc42DN, p35 (K) discs suggests the anterior induction of apoptosis in GMR>RokCAT and GMR>Cdc42DN discs is dependent on apoptosis posterior to the furrow. CC3 staining persists posterior to the furrow after p35 expression (H,K) because undead cells express non-cleaved-caspase epitopes of the anti-CC3 antibodies (Fan and Bergmann, 2010). (L) Quantification of CP in the indicated genotypes. GMR>hid, Gal4 genotypes were compared with GMR>hid, luc RNAi, whereas GMR>Gal4 genotypes were compared with wild type (w1118). Each circle represents the number of cells counted for a single disc, and bars represent mean and one standard deviation. For each genotype, n≥14 discs. *P≤0.02, **P≤1×10⁻⁷. (M) Model for induction of CP in a quiescent epithelium. Text in gray indicates proposed possibilities that have not formally been observed in this study. (1) Hid expression/tissue damage induces apoptosis in a subset of cells. (2) Basal extrusion of apoptotic cells induces apoptotic force (AF), which activates Jub, leading to Wts inhibition. (3) Wts inhibition results in Yki translocating to the nucleus and acting as a transcriptional co-activator for Sd. (4) Sd/Yki induce high levels of Cyclin E, which induces cell cycle re-entry (5). Anterior is oriented to the left. Scale bars: 20 μm.

Similar articles

Cited by

References

    1. Aragona M., Panciera T., Manfrin A., Giulitti S., Michielin F., Elvassore N., Dupont S. and Piccolo S. (2013). A mechanical checkpoint controls multicellular growth through YAP/TAZ regulation by actin-processing factors. Cell 154, 1047-1059. 10.1016/j.cell.2013.07.042 - DOI - PubMed
    1. Baker N. E. and Yu S.-Y. (2001). The EGF receptor defines domains of cell cycle progression and survival to regulate cell number in the developing Drosophila eye. Cell 104, 699-708. 10.1016/S0092-8674(01)00266-5 - DOI - PubMed
    1. Bandura J. L., Jiang H., Nickerson D. W. and Edgar B. A. (2013). The molecular chaperone Hsp90 is required for cell cycle exit in Drosophila melanogaster. PLoS Genet. 9, e1003835 10.1371/journal.pgen.1003835 - DOI - PMC - PubMed
    1. Bayarmagnai B., Nicolay B. N., Islam A. B. M. M. K., Lopez-Bigas N. and Frolov M. V. (2012). Drosophila GAGA factor is required for full activation of the dE2f1-Yki/Sd transcriptional program. Cell Cycle 11, 4191-4202. 10.4161/cc.22486 - DOI - PMC - PubMed
    1. Bedelbaeva K., Snyder A., Gourevitch D., Clark L., Zhang X.-M., Leferovich J., Cheverud J. M., Lieberman P. and Heber-Katz E. (2010). Lack of p21 expression links cell cycle control and appendage regeneration in mice. Proc. Natl. Acad. Sci. USA 107, 5845-5850. 10.1073/pnas.1000830107 - DOI - PMC - PubMed

Publication types

MeSH terms