. 2015 Oct 1;24(19):5416-32.
doi: 10.1093/hmg/ddv266. Epub 2015 Jul 9.

Cln1 gene disruption in mice reveals a common pathogenic link between two of the most lethal childhood neurodegenerative lysosomal storage disorders

Affiliations

Cln1 gene disruption in mice reveals a common pathogenic link between two of the most lethal childhood neurodegenerative lysosomal storage disorders

Goutam Chandra et al. Hum Mol Genet. .

Abstract

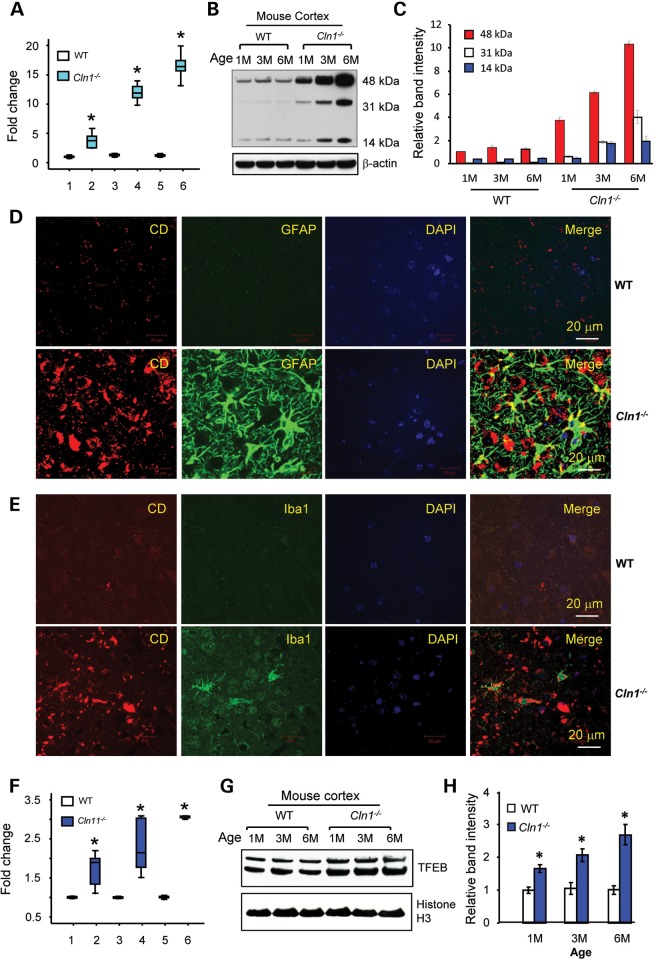
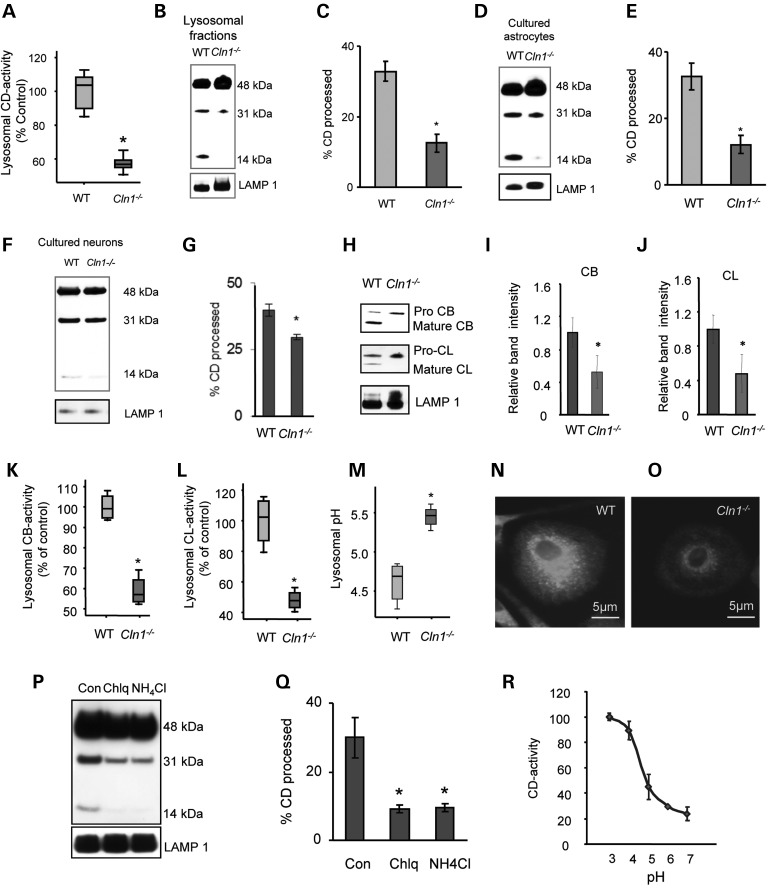
Neurodegeneration is a devastating manifestation in the majority of >50 lysosomal storage disorders (LSDs). Neuronal ceroid lipofuscinoses (NCLs) are the most common childhood neurodegenerative LSDs. Mutations in 13 different genes (called CLNs) underlie various types of NCLs, of which the infantile NCL (INCL) and congenital NCL (CNCL) are the most lethal. Although inactivating mutations in the CLN1 gene encoding palmitoyl-protein thioesterase-1 (PPT1) cause INCL, those in the CLN10 gene encoding cathepsin D (CD) underlie CNCL. PPT1 is a lysosomal thioesterase that cleaves the thioester linkage in S-acylated proteins required for their degradation by lysosomal hydrolases like CD. Thus, PPT1 deficiency causes lysosomal accumulation of these lipidated proteins (major constituents of ceroid) leading to INCL. We sought to determine whether there is a common pathogenic link between INCL and CNCL. Using biochemical, histological and confocal microscopic analyses of brain tissues and cells from Cln1(-/-) mice that mimic INCL, we uncovered that Cln10/CD is overexpressed. Although synthesized in the endoplasmic reticulum, the CD-precursor protein (pro-CD) is transported through endosome to the lysosome where it is proteolytically processed to enzymatically active-CD. We found that despite Cln10 overexpression, the maturation of pro-CD to enzymatically active-CD in lysosome was disrupted. This defect impaired lysosomal degradative function causing accumulation of undegraded cargo in lysosome leading to INCL. Notably, treatment of intact Cln1(-/-) mice as well as cultured brain cells derived from these animals with a thioesterase-mimetic small molecule, N-tert-butyl-hydroxylamine, ameliorated the CD-processing defect. Our findings are significant in that they define a pathway in which Cln1 mutations disrupt the maturation of a major degradative enzyme in lysosome contributing to neuropathology in INCL and suggest that lysosomal CD deficiency is a common pathogenic link between INCL and CNCL.


Figures

Figure 1.
Figure 1.
Overexpression of Cln10/Ctsd gene in the cerebral cortex of Cln1−/− mice. (A) CD-mRNA levels as assessed by qRT-PCR using total RNA from the cerebral cortices of 1-, 3- and 6-month-old Cln1−/− mice and those of their WT littermates. 1. WT 1 month; 2. Cln1−/− 1 month; 3. WT 3 months; 4. Cln1−/− 3 months; 5. WT 6 months; 6. Cln1−/− 6 months (n = 5 animals in each group, *P < 0.05). (B) Western blot analyses of CD using total homogenates of cortical tissues from WT mice and those of their Cln1−/− littermates. 1M, 1 month; 3M, 3 months; 6M, 6 months. (C) Quantitation of the CD-protein bands in the western blot. (D) Colocalization of CD with astrocyte marker, GFAP, in cortical tissue sections of the brain from 6-month-old WT and Cln1−/− mice (n = 3). (E) Colocalization of CD with microglial marker, Iba1, in cortical section brains from WT and Cln1−/− mice (n = 3 animals in each group). (F) Expression of Transcription factor EB (TFEB)-mRNA in cerebral cortices of WT and Cln1−/− mice determined by qRT-PCR. 1. 1-Month-old WT; 2. 1-month-old Cln1−/−; 3. 3-month-old WT; 4. 3-month-old Cln1−/−; 5. 6-month-old WT; 6. 6-month-old Cln1−/− (n = 5 per age group, *P < 0.05). (G) Western blot analysis of TFEB in cortical homogenates from WT and Cln1−/− mouse brain, respectively. (H) Densitometric quantitation of the TFEB-protein bands in western blots (n = 3 separate experiments, *P < 0.05).
Figure 2.
Figure 2.
Oxidative stress upregulates TFEB-mediating CD overexpression. (A) The levels of TFEB-mRNA in WT astrocytes subjected to oxidative stress by H2O2 (400 µm for 4 h) treatment (n = 3 independent experiments, *P < 0.05). (B) TFEB-protein levels in WT astrocytes treated with H2O2. (C) Densitometric quantitation of the TFEB-protein blot (n = 3, *P < 0.05). (D) The levels of CD-mRNA in WT astrocytes subjected to oxidative stress as indicated above (n = 3 experiments, *P < 0.05). (E) CD-protein levels in WT astrocytes subjected to oxidative stress. (F) Densitometric quantitation of CD-protein bands in the immunoblot (n = 3 experiments, *P < 0.05). (G) TFEB immunoblot after the WT astrocytes were treated with control or TFEB-shRNA followed by induction of oxidative stress. (H) Quantitation of the TFEB immunoblot (n = 3 experiments, *P < 0.05 with respect to control; **P < 0.05 with respect to scrambled-shRNA + H2O2); (I) CD immunoblot and its densitometric quantifications after the WT astrocytes were treated with control. (J) TFEB-shRNA followed by induction of oxidative stress (n = 3 experiments, *P < 0.05 with respect to control, **P < 0.05 with respect to scrambled-shRNA + H2O2).
Figure 3.
Figure 3.
Elevated pH disrupts CD maturation in lysosome suppressing CD activity. (A) Lysosomal fractions isolated from brain tissues of Cln1−/− mice and those of their WT littermates were analyzed for CD-enzyme activity (n = 4 animals in each group, *P < 0.05). (B) CD-protein levels in isolated lysosomal fractions from WT and Cln1−/− mice brain cortex. (C) Percentage CD processing as analyzed from the CD-protein blot as (density of 31 kDa band + 14 kDa band)/total CD band intensities (n = 4 animals, *P < 0.05). (D) The levels of CD protein in the lysosomal fractions from primary cultures of astrocytes isolated from cerebral cortices of WT and Cln1−/− pups. (E) Percentage CD processing as analyzed from the CD-protein blot (n = 3 independent experiments, *P < 0.05). (F) CD-protein levels in the lysosomal fractions from primary neuronal cells isolated from cerebral cortices of WT and Cln1−/− embryos. (G) Percentage CD processing in lysosomal fractions from primary neuronal cells (n = 3 independent experiments, *P < 0.05). (H) The levels of mature-CB and -CL in lysosomal fractions obtained from cortical tissues from WT and Cln1−/− mice. (I) Densitometric quantitation of mature-CB-protein bands in western blots (n = 4, *P < 0.05). (J) Densitometric quantitation of CL-protein bands in western blots (n = 4, *P < 0.05). (K) Enzymatic activities of CB in the lysosomal fractions isolated from Cln1−/− mouse cerebral cortex (n = 4 animals, *P < 0.05). (L) Enzymatic activity of CL in the lysosomal fractions isolated from Cln1−/− mouse cerebral cortex (n = 4 animals, *P < 0.05). (M) Lysosomal pH in WT and Cln1−/− astrocytes as measured by Oregon green-dextran and Tetramethylrhodamine (TMR)-dextran (n = 3 separate experiments, *P < 0.05). (N) Fluorescence images of WT astrocytes after 10 min of loading with Lysosensor green DND-189 (n = 10). (O) Fluorescence images of Cln1−/− astrocytes after 10 min of loading with Lysosensor green DND-189 (n = 10). (P) Levels of pro- and mature-CD proteins in lysosomal fractions isolated from WT astrocytes treated with Chlq or NH4Cl. (Q) Percentage CD processing as calculated from the CD immunoblot (n = 3 experiments, *P < 0.05). (R) Dependence of CD activity on pH (n = 3 experiments).
Figure 4.
Figure 4.
Impaired lysosomal proteolysis in cultured astrocytes from Cln1−/− mice. (A) Levels of α-synuclein, a specific substrate of CD, in the purified lysosomal fraction of brain tissues from WT and Cln1−/− littermates. (B) Quantitation of protein bands in α-synuclein immunoblot (n = 4 animals in each group, *P < 0.05). (C) [3H]-leucine incorporation into long-lived intracellular proteins in cultured astrocytes from WT and Cln1−/− mice (n = 4 experiments). (D) Measurement of radioactive long-lived protein degradation in WT and Cln1−/− astrocytes 24 h after [3H]-leucine labeling. During the chase period, cells were incubated in serum-containing or serum-free media. 1. WT astrocytes in serum-containing media; 2. WT astrocytes in serum-free media; 3. Cln1−/− astrocytes in serum-containing media and 4. Cln1−/− astrocytes in serum-free media (*P < 0.05, n = 4 experiments). (E) Quantitative evaluation of proteolysis in astrocytes from WT and Cln1−/− mice, respectively, following 24 h culture in serum-free or serum-containing media. *P < 0.05, n = 4 experiments. (F) Lysosomal protein accumulation in the brain of 6-month-old Cln1−/− mice compared with that of their WT littermates. (G) Densitometric quantitation of the numbered bands (designated 1–9) in F (western blot), n = 4 animals in each group, *P < 0.05. (H) Levels of pro- and mature-CD in total lysates from WT and Cln1−/− astrocytes. (I) Quantitation of the CD immunoblot (n = 3 experiments, *P < 0.05). (J) The levels of CD from conditioned media from culturing Cln1−/− astrocytes, prelabeled with [35S]-methionine. 1. WT (0 h); 2. Cln1−/− (0 h); 3. WT (1 h); 4. Cln1−/− (1 h); 5. WT (3 h); 6. Cln1−/− (3 h); 7. WT (6 h) and 8. Cln1−/− (6 h). (K) Densitometric analysis of the CD immunoblot (n = 3 independent experiment, *P < 0.05 compared with WT control at 1 h). (L) Cln1−/− astrocytes were treated with vehicle or with GM6001, labeled with [35S]-methionine and chased for 6 h with unconditioned media supplemented with non-radioactive cysteine and methionine. 1. WT; 2. Cln1−/− treated with vehicle (control) and 3. Cln1−/− mice treated with GM6001. (M) Percentage CD processing as analyzed from the CD immunoblot (n = 3 per treatment group, *P < 0.05). (N) Detection of CB in conditioned media from cultured WT and Cln1−/− astrocytes (n = 3).
Figure 5.
Figure 5.
Secreted CD in conditioned media from Cln1−/− astrocyte culture is neurotoxic. (A) Schematic depiction of the experimental design. Cultured neurons from WT mice were either untreated or treated with unconditioned media only or with media conditioned by culturing WT or Cln1−/− astrocytes for 12 h. (B) Viability of the neurons was tested using MTT assay. 1. Untreated; 2. media only; 3. conditioned media from WT astrocytes; 4. conditioned media from Cln1−/− astrocytes (n = 3 experiments, *P < 0.05). (C) Conditioned culture media from growing Cln1−/− astrocytes were mixed with agarose beads alone or agarose beads conjugated with CD antibody or with non-specific IgG (control). (D) Neurons from WT mice were treated with the conditioned media for 12 h before performing the MTT assay. 1, Untreated; 2, conditioned media from Cln1−/− astrocytes; 3, conditioned media from Cln1−/− astrocytes + bead only; 4, conditioned media from Cln1−/− astrocytes + non-specific IgG; 5, conditioned media from Cln1−/− astrocytes + CD antibody (n = 3 experiments, *P < 0.05).
Figure 6.
Figure 6.
NtBuHA ameliorates lysosomal maturation of pro-CD in cellula and in vivo. (A) Lysosomal pH of untreated and NtBuHA-treated astrocytes from Cln1−/− mice measured using Oregon green-dextran and TMR-dextran (n = 3 independent experiment, *P < 0.05). (B) Fluorescence imaging of lysosomal pH of untreated astrocytes from Cln1−/− mice loaded with lysosensor DND-189. (C) Fluorescence imaging of lysosomal pH of NtBuHA-treated astrocytes from Cln1−/− mice loaded with lysosensor DND-189. (D) Levels of pro-CD as well as mature-CD in the lysosomal fractions of WT, untreated and NtBuHA-treated Cln1−/− astrocyte. (E) Percentage CD processing calculated from CD immunoblot (n = 3 experiments, *P < 0.05 with respect to WT control, **P < 0.05 with respect to untreated Cln1−/− mice). (F) Western blot analysis showing pro- and mature-CD-protein bands in lysosomal fraction from brain tissues of untreated Cln1−/− mice. (G) Western blot analysis showing pro- and mature-CD-protein bands in lysosomal fraction from brain tissues of Cln1−/− mice treated with NtBuHA (1 mm in drinking water) for 3 months (from 3 months of age until they reached 6 months of age) (n = 5 animals, *P < 0.05). (HJ) Enzyme activities of CD, CB and CL, respectively, in lysosomes of untreated and NtBuHA-treated Cln1−/− mice. 1. Untreated Cln1−/− and 2. NtBuHA-treated Cln1−/− (*P < 0.05; n = 4 animals).
Figure 7.
Figure 7.
Treatment with NtBuHA improves lysosomal proteolysis. (A and B) Levels of α-synuclein and its quantitation in lysosomes isolated from cortical tissues of WT mice and those of untreated- and NtBuHA-treated Cln1−/− mice (n = 3 experiments) (*P < 0.05 with respect to WT control, **P < 0.05 with respect to untreated Cln1−/− mice). (C) Evaluation of long-lived protein degradation 24 h after [3H]-leucine labeling of untreated or NtBuHA-treated astrocytes from Cln1−/− mice. Astrocytes were treated with 1 mm NtBuHA for 7 days. 1. Untreated Cln1−/− cells in serum-containing media; 2. untreated Cln1−/− cells in serum-free media; 3. NtBuHA-treated Cln1−/− cells in serum-containing media; 4. NtBuHA-treated Cln1−/− cells in serum-free media (*P < 0.05, n = 3 experiments). (D) Cln1−/− astrocytes were treated with NtBuHA (1 mm) and labeled with [3H]-leucine. The ratio of proteolysis 24 h after removal of serum compared with serum-replete condition in untreated or NtBuHA-treated Cln1−/− astrocytes are presented. 1. Untreated Cln1−/− and 2. NtBuHA-treated Cln1−/− (*P < 0.05, n = 3). (E) Levels of lysosomal proteins in the brains of 6-month-old WT, untreated or NtBuHA-treated Cln1−/− mice. Three-month-old Cln1−/− mice were continuously treated with NtBuHA from 3 months of age until they were 6 months old before sacrifice. (F) Densitometric quantification of the protein bands (numerically designated as 1–9) in panel (n = 4 experiments, *P < 0.05). (G) Model explaining the pathway of pro-CD to mature-CD maturation in lysosome of WT mice (left panel) and Cln1−/− littermates (right panel). Under normal circumstances, pro-CD is proteolytically processed by the catalytic action of CB and CL, whereas in Cln1−/− mice, suppression of CB and CL activities impaired processing of pro-CD to mature-CD causing accumulation of undegraded cargo in lysosome. Thus, despite overexpression of the CD gene in Cln1−/− mice, CD deficiency in lysosome contributes to pathogenesis.

Similar articles

Cited by

References

    1. de Duve C. (1983) Lysosomes revisited. Eur. J. Biochem., 137, 391–397. - PubMed
    1. Harris H., Rubinzstein D.C. (2011) Control of autophagy as a therapy for neurodegenerative disease. Nat. Rev. Neurol., 8, 108–117. - PubMed
    1. Nixon R.A. (2013) The role of autophagy in neurodegenerative disease. Nat. Med., 19, 983–997. - PubMed
    1. Platt F.M., Boland B., van der Spoel A.C. (2012) The biology of disease: lysosomal storage disorders: the cellular impact of lysosomal dysfunction . J. Cell Biol., 199, 723–734. - PMC - PubMed
    1. Proia R.L., Wu Y.-P. (2004) Blood to brain to the rescue. J. Clin. Invest., 113, 1108–1110. - PMC - PubMed

Publication types