

IMMUNOLOGY. An interactive reference framework for modeling a dynamic immune system
- PMID: 26160952
- PMCID: PMC4537647
- DOI: 10.1126/science.1259425
IMMUNOLOGY. An interactive reference framework for modeling a dynamic immune system
Abstract
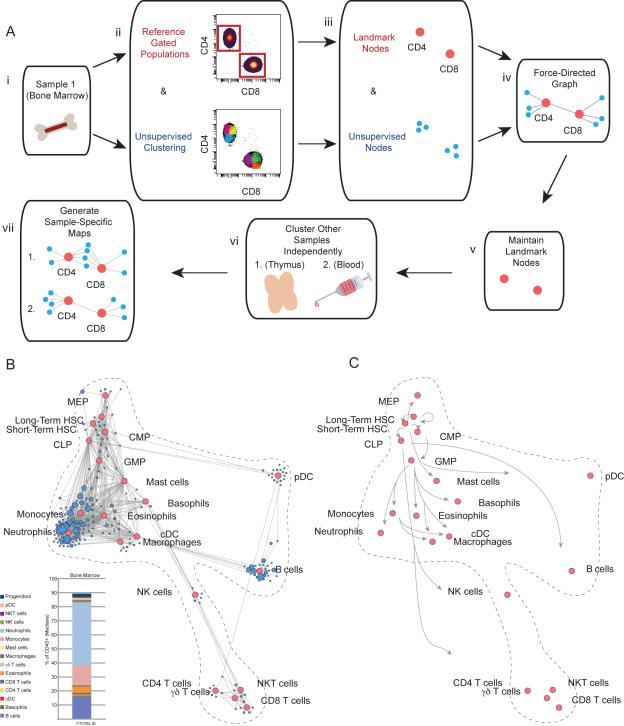
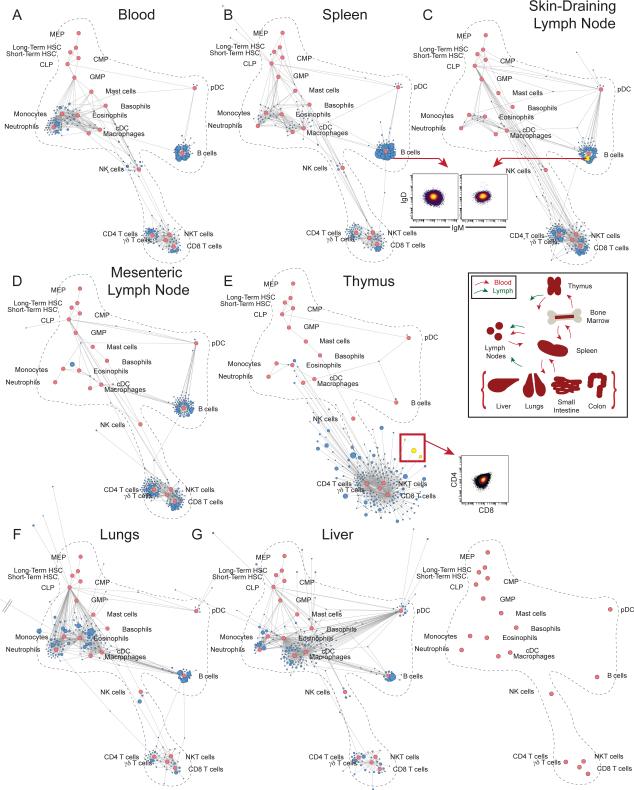
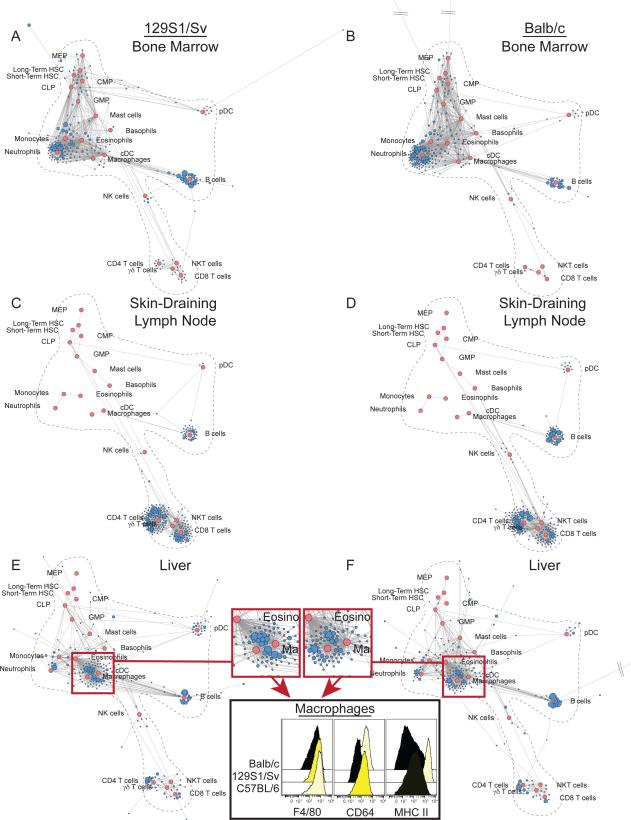
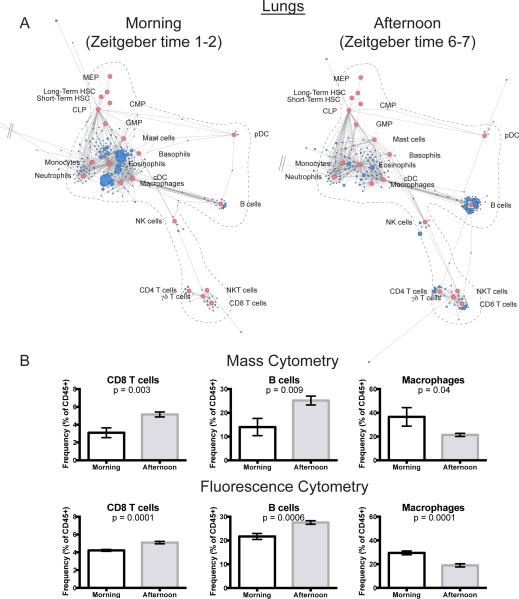
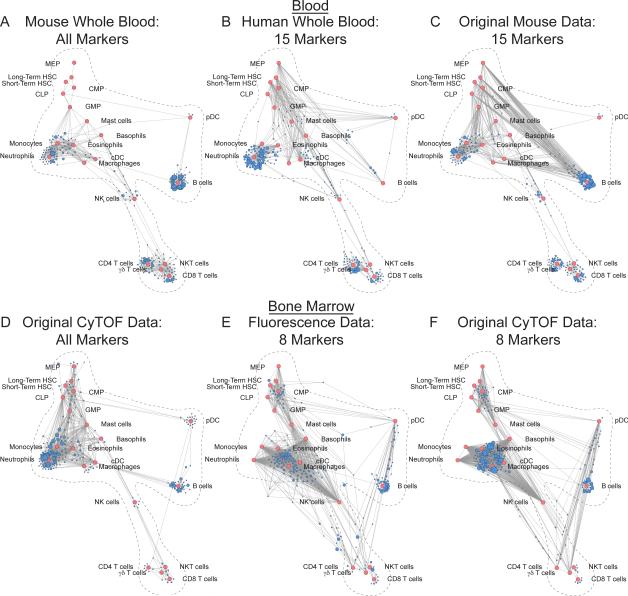
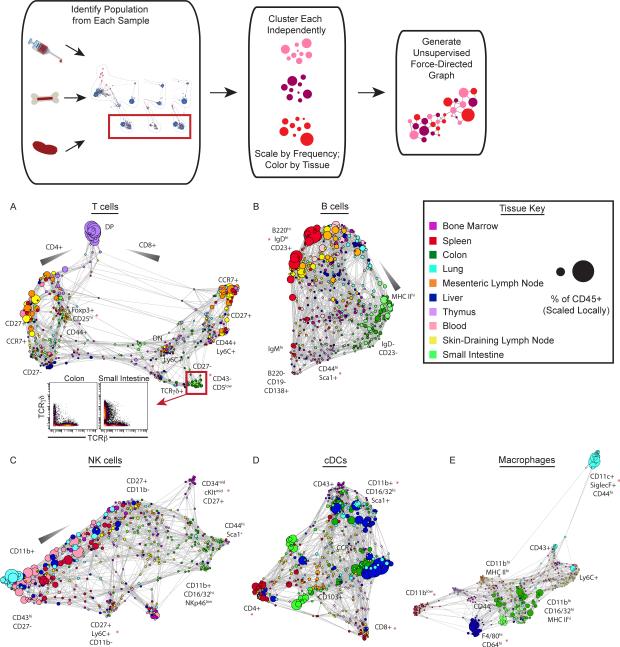
Immune cells function in an interacting hierarchy that coordinates the activities of various cell types according to genetic and environmental contexts. We developed graphical approaches to construct an extensible immune reference map from mass cytometry data of cells from different organs, incorporating landmark cell populations as flags on the map to compare cells from distinct samples. The maps recapitulated canonical cellular phenotypes and revealed reproducible, tissue-specific deviations. The approach revealed influences of genetic variation and circadian rhythms on immune system structure, enabled direct comparisons of murine and human blood cell phenotypes, and even enabled archival fluorescence-based flow cytometry data to be mapped onto the reference framework. This foundational reference map provides a working definition of systemic immune organization to which new data can be integrated to reveal deviations driven by genetics, environment, or pathology.
Copyright © 2015, American Association for the Advancement of Science.
Figures
References
-
- Hulett HR, Bonner WA, Barrett J, Herzenberg LA. Cell sorting: automated separation of mammalian cells as a function of intracellular fluorescence. Science. 1969;166:747–749. - PubMed
-
- Herzenberg LA, Herzenberg LA. Toward a layered immune system. Cell. 1989;59:953–954. - PubMed
-
- Mahnke Y, Chattopadhyay P, Roederer M. Publication of optimized multicolor immunofluorescence panels. Cytometry. 2010;77A:814–818. - PubMed
-
- Aderem A, Hood L. Immunology in the post-genomic era. Nature Immunology. 2001;2:373–375. - PubMed
Publication types
MeSH terms
Grants and funding
- HHSN272201200028C/PHS HHS/United States
- F32 GM093508-01/GM/NIGMS NIH HHS/United States
- 201303028/PHS HHS/United States
- R01 NS089533/NS/NINDS NIH HHS/United States
- R01 GM109836/GM/NIGMS NIH HHS/United States
- HHSF223201210194C/PHS HHS/United States
- R01 DK082537/DK/NIDDK NIH HHS/United States
- R33 CA183654/CA/NCI NIH HHS/United States
- 5-24927/PHS HHS/United States
- R01 CA130826/CA/NCI NIH HHS/United States
- HHSN272200700038C/PHS HHS/United States
- RFA CA 09-009/CA/NCI NIH HHS/United States
- P01 CA034233-22A1/CA/NCI NIH HHS/United States
- 5R01AI073724/AI/NIAID NIH HHS/United States
- U54 CA143907/CA/NCI NIH HHS/United States
- PN2 EY018228/EY/NEI NIH HHS/United States
- P01 CA034233/CA/NCI NIH HHS/United States
- K99GM104148-01/GM/NIGMS NIH HHS/United States
- F31 CA189331/CA/NCI NIH HHS/United States
- HHSN268201000034C/HL/NHLBI NIH HHS/United States
- U19 AI057229/AI/NIAID NIH HHS/United States
- S10 RR027582/RR/NCRR NIH HHS/United States
- PN2EY018228 0158 G KB065/EY/NEI NIH HHS/United States
- U19 AI100627/AI/NIAID NIH HHS/United States
- R01CA184968/CA/NCI NIH HHS/United States
- F32 GM093508/GM/NIGMS NIH HHS/United States
- T32 GM007276/GM/NIGMS NIH HHS/United States
- 7500108142/PHS HHS/United States
- N01-HV-00242/HV/NHLBI NIH HHS/United States
- T32 AI007328/AI/NIAID NIH HHS/United States
- T32GM007276/GM/NIGMS NIH HHS/United States
- 1R01GM109836/GM/NIGMS NIH HHS/United States
- U54CA149145/CA/NCI NIH HHS/United States
- 1R01CA130826/CA/NCI NIH HHS/United States
- K99 GM104148/GM/NIGMS NIH HHS/United States
- Howard Hughes Medical Institute/United States
- P01 HL075462/HL/NHLBI NIH HHS/United States
- R01 CA163441/CA/NCI NIH HHS/United States
- 5U54CA143907/CA/NCI NIH HHS/United States
- F31CA189331/CA/NCI NIH HHS/United States
- R01 AI073724/AI/NIAID NIH HHS/United States
- U54 CA149145/CA/NCI NIH HHS/United States
- HHSN272200700038C/AI/NIAID NIH HHS/United States
- R01 DK096038/DK/NIDDK NIH HHS/United States
- R33 CA183692/CA/NCI NIH HHS/United States
- R01 CA184968/CA/NCI NIH HHS/United States
- RFA CA 09-011/CA/NCI NIH HHS/United States
- R00 GM104148/GM/NIGMS NIH HHS/United States
- U01 CA141468/CA/NCI NIH HHS/United States
- 1U19AI100627/AI/NIAID NIH HHS/United States
- 1R01NS089533/NS/NINDS NIH HHS/United States
LinkOut - more resources
Full Text Sources
Other Literature Sources
Medical
