. 2014 Jun;61(3):1126-1135.
doi: 10.1109/TNS.2014.2304853.

High-Resolution Anamorphic SPECT Imaging

Affiliations

High-Resolution Anamorphic SPECT Imaging

Heather L Durko et al. IEEE Trans Nucl Sci. 2014 Jun.

Abstract

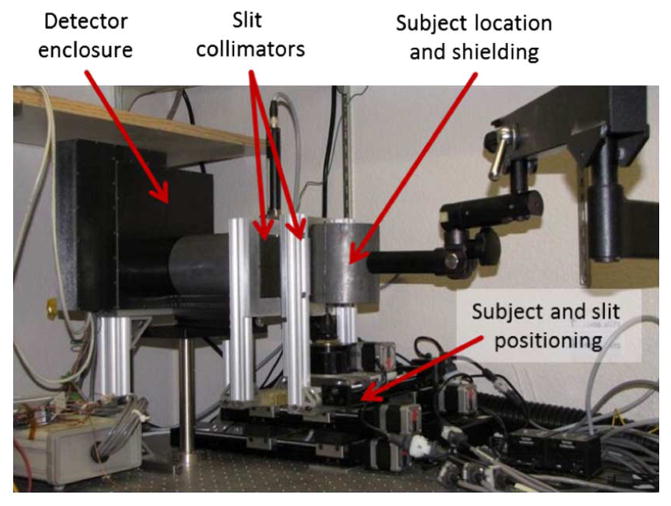
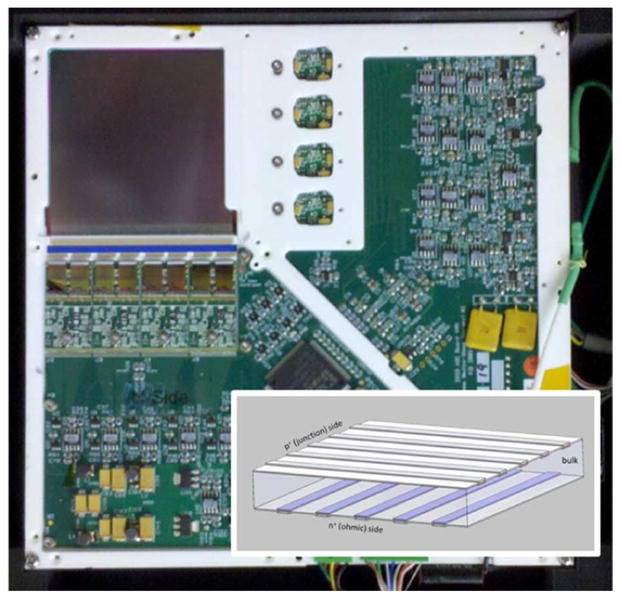
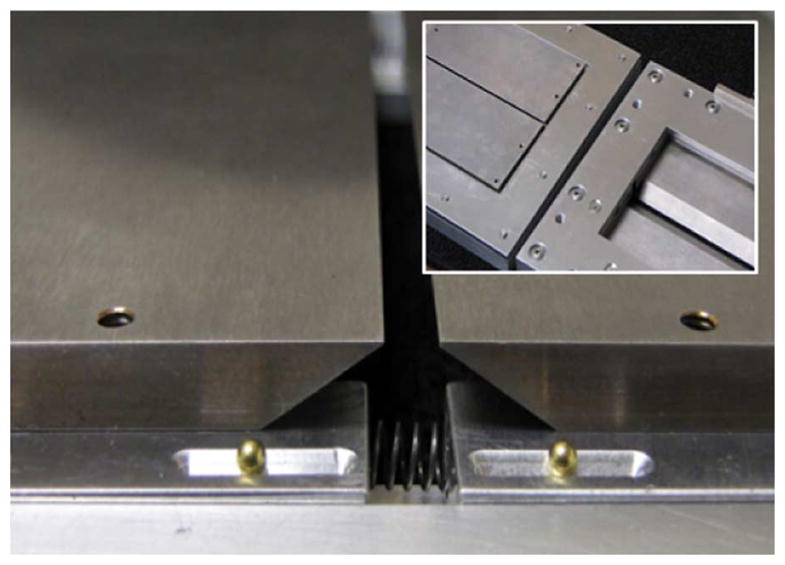
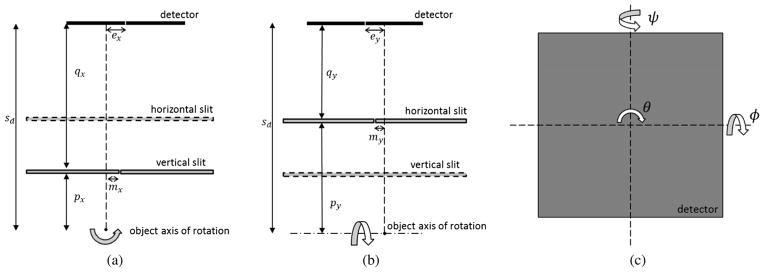
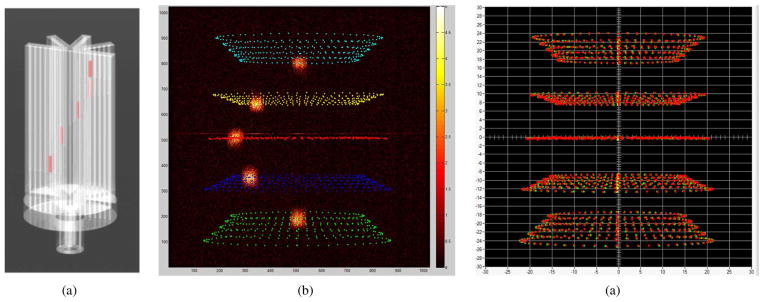
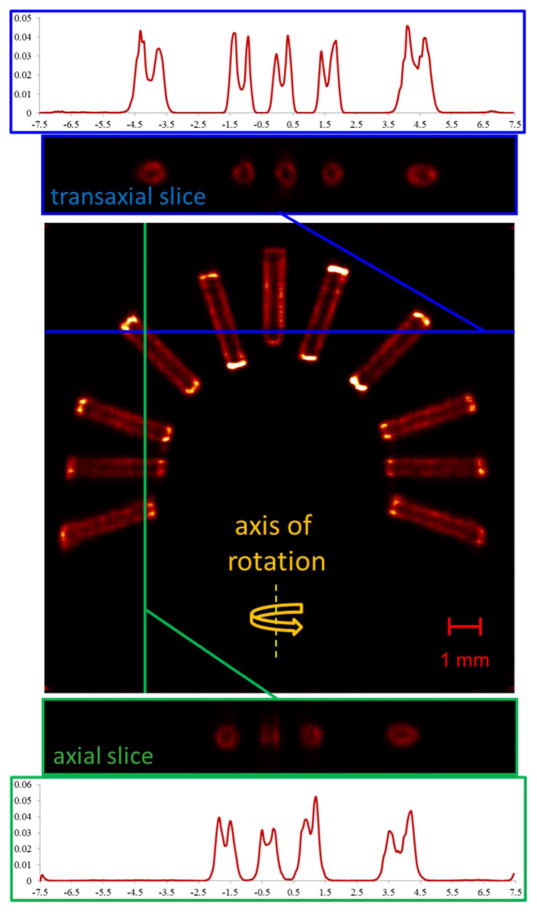
We have developed a gamma-ray imaging system that combines a high-resolution silicon detector with two sets of movable, half-keel-edged copper-tungsten blades configured as crossed slits. These apertures can be positioned independently between the object and detector, producing an anamorphic image in which the axial and transaxial magnifications are not constrained to be equal. The detector is a 60 mm × 60 mm, one-millimeter-thick, one-megapixel silicon double-sided strip detector with a strip pitch of 59 μm. The flexible nature of this system allows the application of adaptive imaging techniques. We present system details; calibration, acquisition, and reconstruction methods; and imaging results.

Keywords: 103Pd; 125I; Adaptive; DSSD; SPECT; anamorphic imaging; crossed slits; double-sided strip detector; low energy; silicon; small animal.


Figures

Fig. 1
Fig. 1
A simplified diagram of a crossed-slit aperture configuration demonstrates the effects of anamorphic imaging. Separated slits decouple the magnification in the x and y directions. The resulting image has a different aspect ratio than that of the object.
Fig. 2
Fig. 2
A photograph of the anamorphic SPECT system. Two orthogonal slits are adjusted independently to permit maximum magnification of the object onto the high-resolution DSSD.
Fig. 3
Fig. 3
Inset: schematic illustrating the orientation of the conducting strips in a double-sided strip detector. The high-resolution silicon DSSD combines the information from 1024 crossed strips on each side of the detector to offer true megapixel resolution and list-mode photon counting.
Fig. 4
Fig. 4
Schematic for the triggering logic for a single ASIC channel. Two separate arms are used to extract timing and energy information from the signal induced on a conducting strip.
Fig. 5
Fig. 5
Internal structure of the brachytherapy seeds used in these experiments (a). These seeds are described in Section IV-B. Rapid-prototyping techniques permit the design and fabrication of test phantoms in which the seeds can be arranged in known and repeatable positions. The phantom shown in (b) was imaged through our system to demonstrate the intrinsic resolution of the DSSD for slit widths of 50 μm (c) and 250 μm (d).
Fig. 6
Fig. 6
The adjustable copper-tungsten slit design allows precise control over the aperture width. Inset: both sides of the entire slit housing. The slits were designed with half-keel edges to permit the slits to come into contact, forming a rectangular pinhole with equal x and y magnifications.
Fig. 7
Fig. 7
Diagram of the geometric parameters used in the forward model. Separate geometric parameters are determined by the vertical slit (a) and horizontal slit (b) with respect to the defined center of the FOV and center point of the detector. Detector rotation parameters (c), shown as seen from the object position, are defined with respect to the center point of the detector. We also estimate 10 nuisance parameters to compensate for small offsets in the calibration phantom. The complete set of geometric parameters used in the calibration procedure are compiled in Table V.
Fig. 8
Fig. 8
A Solidworks rendering of the geometric phantom used during calibration (a). The phantom allows five 4.7 mm long, 800 μm diameter cylindrical 125I brachytherapy rods to be inserted into holes at predetermined heights and radial distances from the center of the phantom to represent an object’s s5)ize. In this example, we acquired five sets of calibration data, each obtained with five rods located at a radial distance of 6 mm from the center of rotation and vertically separated in 7.5 mm increments. The phantom was imaged in 6-degree steps over 360 degrees. A total of N = 5 beads × 5 magnifications × 60 angular projections = 1500 centroid positions (superimposed over a single projection image) extracted from brachytherapy rod projections form the data set from which the geometric parameters are extracted (b). A contracting-grid algorithm employs maximum-likelihood methods to minimize the difference between measured (red) and estimated centroid positions (green) (c).
Fig. 9
Fig. 9
During reconstruction, the required elements of the H matrix are computed on the fly in the GPU. One computational block considers a subset of pixels containing a single PSF (blue); each thread within the block computes the estimated irradiance detected at one pixel (red).
Fig. 10
Fig. 10
Cross-sectional slices through a reconstruction of 11 brachytherapy rods in the custom phantom shown in Figure IV-C. The acquisition axis of rotation is indicated on the coronal slice of the reconstruction (yellow). Transaxial slices (blue) through the volume demonstrate slightly higher resolution than axial slices (green), though the internal structure of the rods is evident at all rod orientations. The 255 × 255× 255-voxel reconstruction was performed on 60 15-minute projections acquired with 250 μm slits using five iterations of OSEM with five subsets.
Fig. 11
Fig. 11
Gaussian profiles simulating aperture blur are convolved with the activity profile of the 125I brachytherapy rod, modeled with a 5 μm layer of activity coating a 395 μm diameter silver rod. These simulated image slices (color) are compared with the reconstructed data points, shown in black. The valleys of the axial (a) and transaxial (b) cross-sections suggest approximate resolutions of ~225 μm and ~175 μm, respectively. The data sets were reconstructed with 58.8 μm voxels from 60 projections with 10 iterations of five-subset OSEM.
Fig. 12
Fig. 12
ADC values from the triggered channel and its adjacent strips are used to estimate the detected energy and remove common-mode fluctuations (a). Smoothed and normalized energy spectra for four isotopes on one p-side strip (b). The median energy resolution at the monoenergetic 241Am peak is 9.24% at 59.54 keV. Calibrated energy spectra allows discrimination between events from 125I and 103Pd. Energy information calculated from the list-mode acquisition data is used to parse events from each side of the detector before gamma-ray absorptions are identified. Each resulting data set is reconstructed separately and recombined in post-processing. A multi-energy reconstruction of 125I and 103Pd brachytherapy rods (c). The 255 ×255 ×255-voxel reconstruction was performed on 60 10-minute projections acquired with 250 μm slits using five iterations of OSEM with five subsets.

Similar articles

Cited by

References

    1. Peterson TE, Furenlid LR. SPECT detectors: The Anger Camera and beyond. Phys Med Biol. 2011;56:R145–182. - PMC - PubMed
    1. Abbott MB, DeClerk YA, Chen YC, Furenlid LR, Wilson DW, Stevenson GD, Whitaker MK, Woolfenden JM, Moats RA, Barrett HH. 100-micron resolution SPECT imaging of a neuroblastoma tumor model. Mol Imag. 2006;5:214.
    1. Miller BW, Furenlid LR, Moore SK, Barber HB, Nagarkar VV, Barrett HH. System integration of FastSPECT III, a dedicated SPECT rodent-brain imager based on BazookaSPECT detector technology. Proc IEEE Nuclear Science Symp Conf Rec. 2009:4004–4008. - PMC - PubMed
    1. van der Have F, Vastenhouw B, Ramakers RM, Branderhorst W, Krah JO, Ji C, Staelens SG, Beekman FJ. U-SPECT-II: An ultra-high-resolution device for molecular small-animal imaging. J Nucl Med. 2009;50(4):599–605. - PubMed
    1. Schramm NU, Ebel G, Engeland U, Schurrat T, Behe M, Behr TM. High-resolution SPECT using multipinhole collimation. IEEE Trans Nucl Sci. 2003 Jun;50(3):315–320.

LinkOut - more resources