

Higher Knee Flexion Moment During the Second Half of the Stance Phase of Gait Is Associated With the Progression of Osteoarthritis of the Patellofemoral Joint on Magnetic Resonance Imaging
- PMID: 26161626
- PMCID: PMC4718079
- DOI: 10.2519/jospt.2015.5859
Higher Knee Flexion Moment During the Second Half of the Stance Phase of Gait Is Associated With the Progression of Osteoarthritis of the Patellofemoral Joint on Magnetic Resonance Imaging
Abstract
Study design: Controlled laboratory study, longitudinal design.
Objective: To examine whether baseline knee flexion moment or impulse during walking is associated with the progression of osteoarthritis (OA) with magnetic resonance imaging of the patellofemoral joint (PFJ) at 1 year.
Background: Patellofemoral joint OA is highly prevalent and a major source of pain and dysfunction. The biomechanical factors associated with the progression of PFJ OA remain unclear.
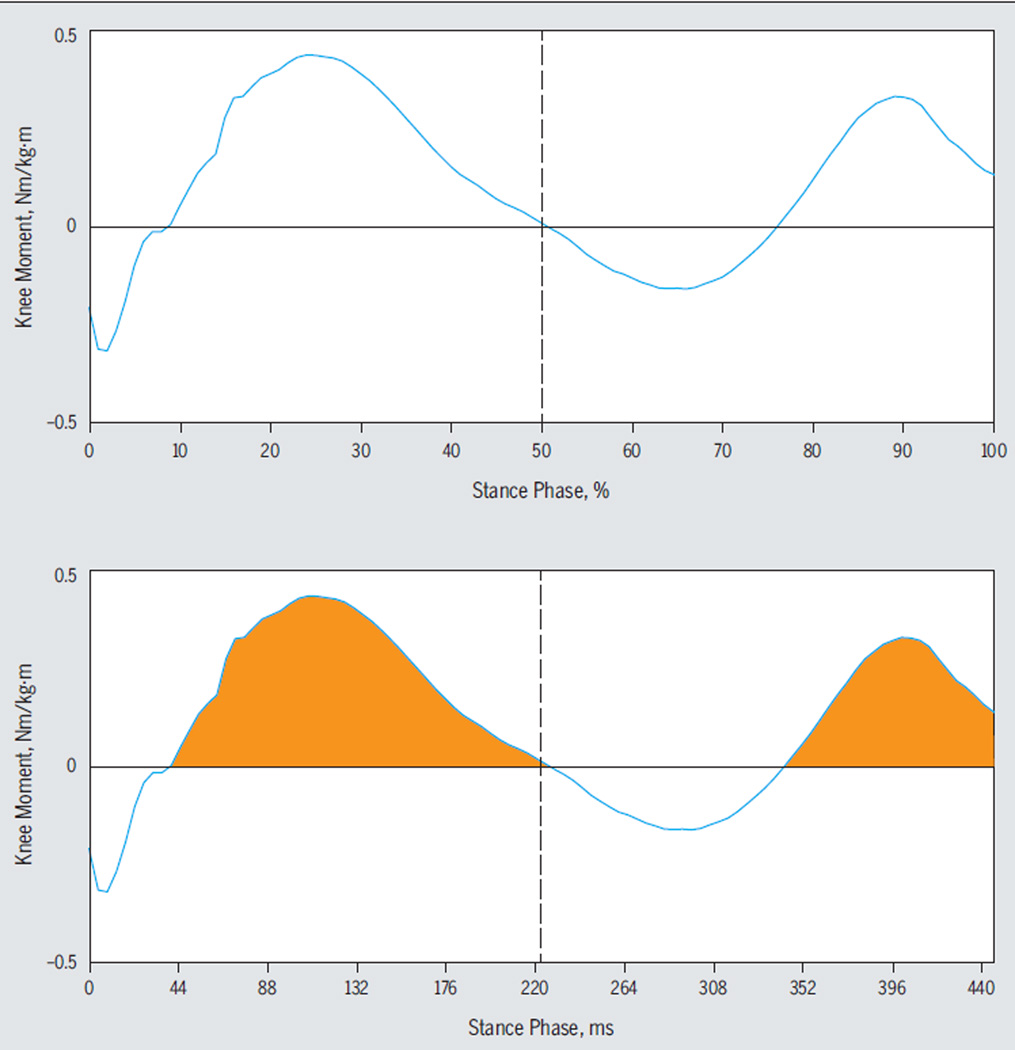
Methods: Three-dimensional gait analyses were performed at baseline. Magnetic resonance imaging of the knee (high-resolution, 3-D, fast spin-echo sequence) was used to identify PFJ cartilage and bone marrow edema-like lesions at baseline and a 1-year follow-up. The severity of PFJ OA progression was defined using the modified Whole-Organ Magnetic Resonance Imaging Score when new or increased cartilage or bone marrow edema-like lesions were observed at 1 year. Peak external knee flexion moment and flexion moment impulse during the first and second halves of the stance phase of gait were compared between progressors and nonprogressors, and used to predict progression after adjusting for age, sex, body mass index, and presence of baseline PFJ OA.
Results: Sixty-one participants with no knee OA or isolated PFJ OA were included. Patellofemoral joint OA progressors (n = 10) demonstrated significantly higher peak knee flexion moment (P = .01) and flexion moment impulse (P = .04) during the second half of stance at baseline compared to nonprogressors. Logistic regression showed that higher peak knee flexion moment during the second half of the stance phase was significantly associated with progression at 1 year (adjusted odds ratio = 3.3, P = .01).
Conclusion: Peak knee flexion moment and flexion moment impulse during the second half of stance are related to the progression of PFJ OA and may need to be considered when treating individuals who are at risk of or who have PFJ OA.
Keywords: WORMS; bone marrow lesions; cartilage; gait; kinetics.
Figures

References
-
- Alizai H, Virayavanich W, Joseph GB, et al. Cartilage lesion score: comparison of a quantitative assessment score with established semiquantitative MR scoring systems. Radiology. 2014;271:479–487. http://dx.doi.org/10.1148/radiol.13122056. - DOI - PMC - PubMed
-
- Andriacchi TP, Favre J. The nature of in vivo mechanical signals that influence cartilage health and progression to knee osteoarthritis. Curr Rheumatol Rep. 2014;16:463. http://dx.doi.org/10.1007/s11926-014-0463-2. - DOI - PubMed
-
- Baum T, Joseph GB, Arulanandan A, et al. Association of magnetic resonance imaging-based knee cartilage T2 measurements and focal knee lesions with knee pain: data from the Osteoarthritis Initiative. Arthritis Care Res (Hoboken) 2012;64:248–255. http://dx.doi.org/10.1002/acr.20672. - DOI - PMC - PubMed
-
- Baum T, Stehling C, Joseph GB, et al. Changes in knee cartilage T2 values over 24 months in subjects with and without risk factors for knee osteoarthritis and their association with focal knee lesions at baseline: data from the Osteoarthritis Initiative. J Magn Reson Imaging. 2012;35:370–378. http://dx.doi.org/10.1002/jmri.22834. - DOI - PMC - PubMed
-
- Bennell KL, Bowles KA, Wang Y, Cicuttini F, Davies- Tuck M, Hinman RS. Higher dynamic medial knee load predicts greater cartilage loss over 12 months in medial knee osteoarthritis. Ann Rheum Dis. 2011;70:1770–1774. http://dx.doi.org/10.1136/ard.2010.147082. - DOI - PubMed
Publication types
MeSH terms
Grants and funding
LinkOut - more resources
Full Text Sources
Other Literature Sources
Medical