. 2015 Jul 10;10(7):e0131705.
doi: 10.1371/journal.pone.0131705. eCollection 2015.

Immediate Epileptogenesis after Kainate-Induced Status Epilepticus in C57BL/6J Mice: Evidence from Long Term Continuous Video-EEG Telemetry

Affiliations

Immediate Epileptogenesis after Kainate-Induced Status Epilepticus in C57BL/6J Mice: Evidence from Long Term Continuous Video-EEG Telemetry

Sreekanth Puttachary et al. PLoS One. .

Abstract

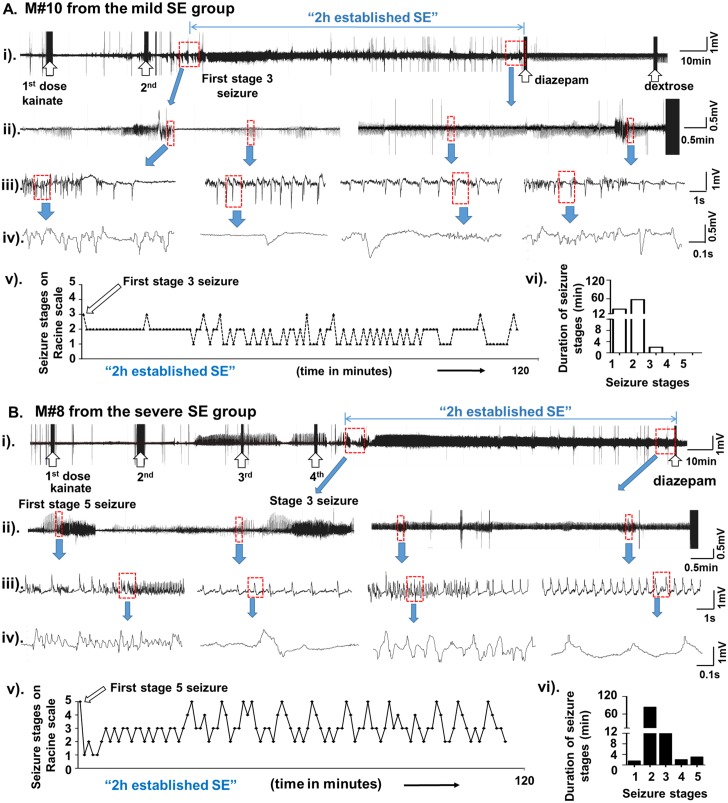
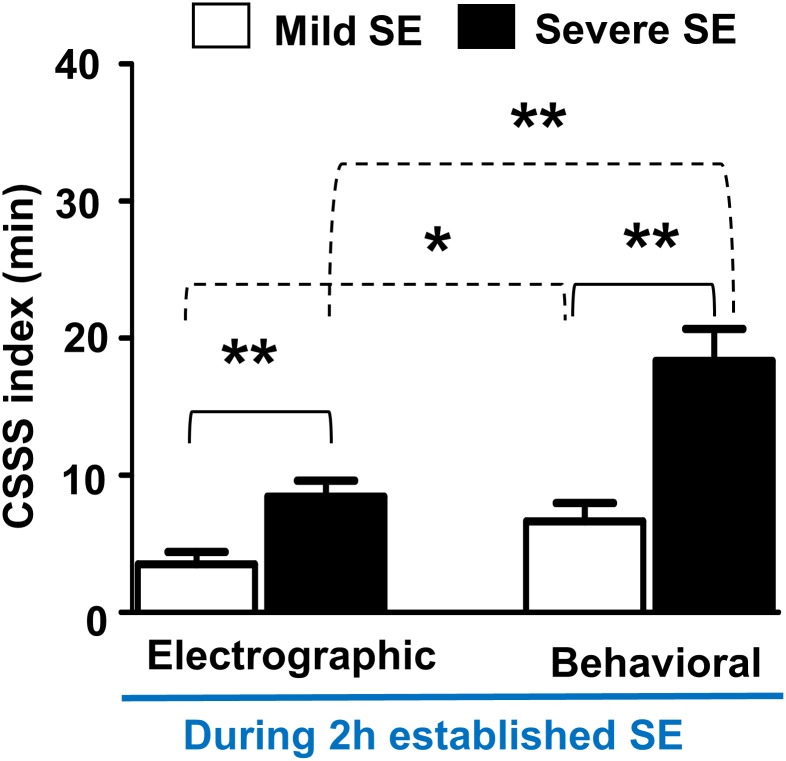
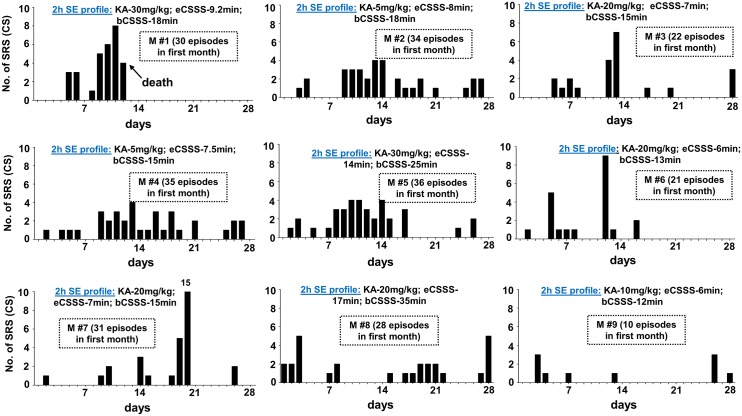
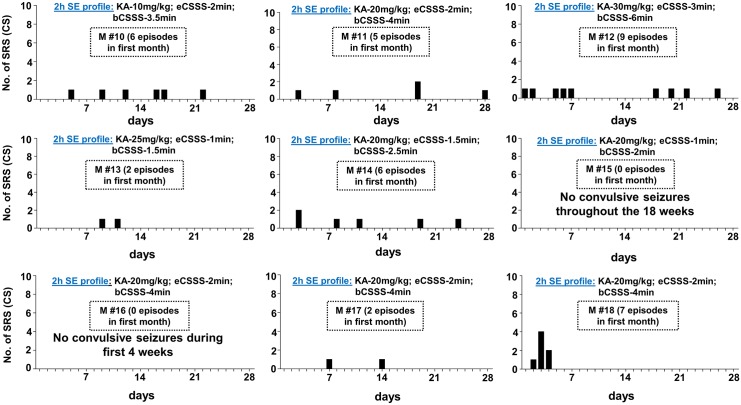
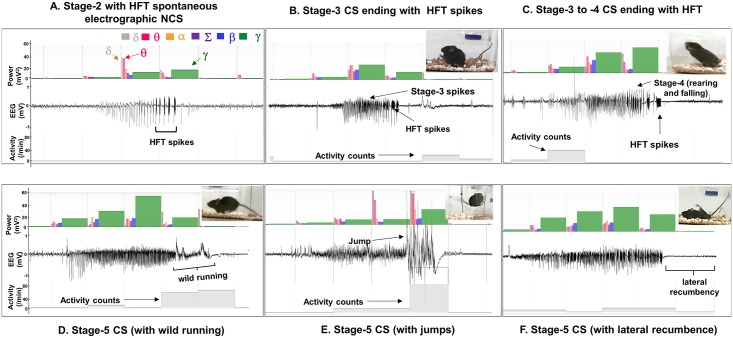
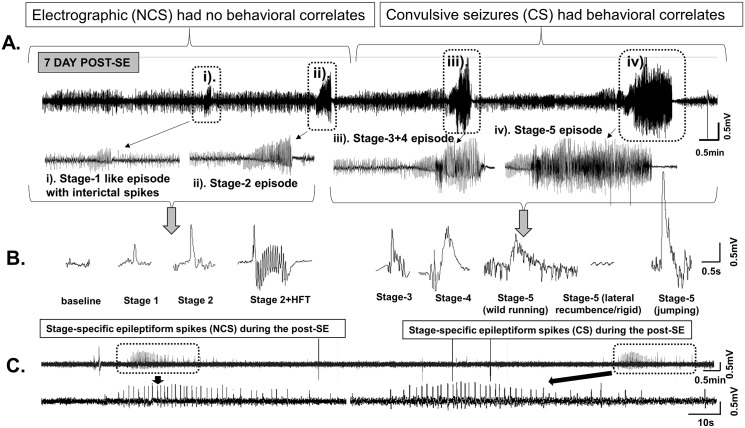
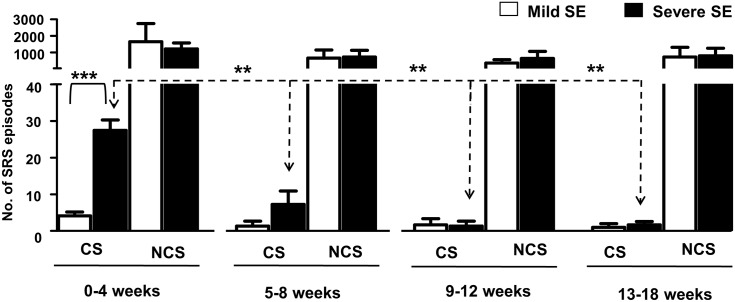
The C57BL/6J mouse as a model of seizure/epilepsy is challenging due to high mortality and huge variability in response to kainate. We have recently demonstrated that repeated administration of a low dose of kainate by intraperitoneal route can induce severe status epilepticus (SE) with 94% survival rate. In the present study, based on continuous video-EEG recording for 4-18 weeks from epidurally implanted electrodes on the cortex, we demonstrate that this method also induces immediate epileptogenesis (<1-5 days post-SE). This finding was based on identification of two types of spontaneous recurrent seizures; behavioral convulsive seizures (CS) and electrographic nonconvulsive seizures (NCS). The identification of the spontaneous CS, stage 3-5 types, was based on the behaviors (video) that were associated with the EEG characteristics (stage 3-5 epileptiform spikes), the power spectrum, and the activity counts. The electrographic NCS identification was based on the stage 1-2 epileptiform spike clusters on the EEG and their associated power spectrum. Severe SE induced immediate epileptogenesis in all the mice. The maximum numbers of spontaneous CS were observed during the first 4-6 weeks of the SE and they decreased thereafter. Mild SE also induced immediate epileptogenesis in some mice but the CS were less frequent. In both the severe and the mild SE groups, the spontaneous electrographic NCS persisted throughout the 18 weeks observation period, and therefore this could serve as a chronic model for complex seizures. However, unlike rat kainate models, the C57BL/6J mouse kainate model is a unique regressive CS model of epilepsy. Further studies are required to understand the mechanism of recovery from spontaneous CS in this model, which could reveal novel therapeutic targets for epilepsy.


Conflict of interest statement

Competing Interests: The authors have declared that no competing interests exist.

Figures

Fig 1
Fig 1. A (i to iv) and B (i to iv) are the representative EEG traces obtained during mild and severe SE, respectively, in this study.
The behavioral scoring (Racine scale stages from 1 to 5) for these mice during the 2 hours established SE (v) and the duration of each stage was quantified (vi). The upward open arrows indicate the injections given [kainate (5 mg/kg)- first two arrows in A (i), and first four arrows in B (i); diazepam and dextrose at the other end of the trace]. The first episode of stage-3 seizure in the mild SE group (A, after the second dose of kainate) or the stage 5 in the severe SE group (B, after the fourth dose of kainate) is shown on the EEG traces (i and ii). The expanded EEG trace from the very end of the established SE, prior to the diazepam treatment, is shown in the panel (ii). A further expanded EEG traces are also shown in panels (iii) and (iv). The first stage 3 (in mild group) or the stage 5 (in the severe group) marked the beginning of the 2 hours established SE. During the 2 hour period, the mouse [panel A, (v)] had stage 2 seizures continuously for first 30 minutes with a second episode of stage-3 seizure half-way through and changed to the stage-1 seizure. Beyond this point, the remaining 90 minutes, the mouse (panel A) had continuous seizures ranging from stage-1 to stage-3. The exact amount of time spent at each stage is given in the panel (vi), likewise for the mouse in the severe SE group (panel B). During the 2 hour period, the mouse (panel B) had a brief stage-1 seizures followed by continuous stage 2–5 seizures during the remaining period of 2 hours (v). The exact amount of time the mouse spent at each stage is given in the panel vi.
Fig 2
Fig 2. Behavioral and electrographic CSSS indices comparison between the severe and the mild SE groups during the 2 hours established SE.
The CSSS indices for both behavioral and electrographic seizures were significantly higher in the severe SE group, when compared to the mild SE group (**p = 0.0047, electrographic CSSS; **p = 0.0011, behavioral CSSS; n = 9, Mann-Whitney test). There was almost 50% difference between the electrographic and the behavioral CSSS indices in both groups (*p = 0.037 for the mild group, **p = 0.0023 for the severe group, Mann-Whitney test).
Fig 3
Fig 3. The frequency of spontaneous behavioral CS occurrence during the first 4 weeks of post-SE in the severe SE group.
The 2 hour established SE profile, and the total numbers of spontaneous CS episodes/day during the first 4 weeks of post-SE are given for each mouse. All mice in the severe group had continuous stage-1 or 2 seizures for >40 min during the 2 hours established SE. There is no correlation between the amount of kainate received and the motor seizure latent period, and the numbers of spontaneous CS episodes. eCSSS = electrographic CSSS index (in min); bCSSS = behavioral CSSS index (in min).
Fig 4
Fig 4. The frequency of spontaneous behavioral CS occurrence during the first 4 weeks of post-SE in the mild SE group.
The 2 hour established SE profile, and the total numbers of spontaneous behavioral CS are given for each mouse. All mice in the mild group also had continuous stage-1 or 2 seizures for > 40 min during the 2 hours established SE (an example is shown in Fig 1). As in the severe SE group, there was no correlation between the amount of kainate given and the motor seizure latent period, and the number of CS episodes. Two mice did not become epileptic during first 4 weeks. eCSSS = electrographic CSSS index (in min); bCSSS = behavioral CSSS index (in min).
Fig 5
Fig 5. Types of spontaneous electrographic NCS (A) and behavioral CS episodes (B-F) observed during the first 4 weeks.
(A) The stage-2 type of spontaneous electrographic NCS ending with the HFT spikes had no behavioral correlates. Five types of spontaneous behavioral CS were identified. (B) the stage-3 type ending with the HFT spikes (C) the stage-3 to -4 type episode ending with the HFT spikes, (D-F) the stage-5 episodes preceded by the stage-3 and -4 type spikes with wild running (D) or without wild running and/or ending with lateral recumbence/rigidity (F), which is characterized by low amplitude spikes on the EEG compared to the baseline. (E) The stage-5 episode was preceded by the stage-3 and -4 types followed by several jumps and may end with lateral recumbence/rigidity. In all the spontaneous CS types, the stage-3 component increases the gamma power while, the increase in the activity counts corresponds to the movements due to seizures during this period. The gamma power decreases in the stage-5 except during jumping and wild running, which also coincides with the increased activity counts.
Fig 6
Fig 6. The EEG features of the spontaneous electrographic NCS and behavioral CS.
A. A 20min EEG trace from the mouse at 7d post-SE. A pattern of the stage-1 and the stage-2 type NCS episodes (with no behavioral correlates unlike during the SE) preceded the stage 3–5 behavioral CS episodes. After 4 weeks, the stage 3–5 episodes were reduced, however the stage-1 and -2 continued to persist. B. The spike characteristics during the post-SE period. The HFT spikes reduced after the 4 weeks in all types of seizures in both the mild and severe SE groups. An example of an electrographic NCS on its own (without progressing to stage 3–5 seizure) is also shown in the panel C- a 20min trace showing spontaneous electrographic NCS of stage 2 type spiking at 32 day post-SE (from the severe SE group). Such electrographic NCS episodes persisted throughout the 18 weeks in the severe and the mild groups.
Fig 7
Fig 7. Comparison of the spontaneous behavioral CS and the spontaneous electrographic NCS occurrence in the severe and mild SE groups from 0–18 weeks.
There was a significant increase in the number of behavioral CS episodes during the first 4 weeks in the severe SE group when compared to the mild SE group (***p = 0.0004, Mann-Whitney test, n = 9 each). The spontaneous CS in the severe group significantly reduced during 5–8 weeks or 9–12 weeks or 13–18 weeks when compared to 0–4 weeks (p = 0.0026, Kruskal-Wallis test). However, there was no significant difference in the spontaneous behavioral CS in the mild group across different time points. Further, spontaneous electrographic NCS episodes did not significantly change between the two groups at any time point and continued to exist throughout the 18 weeks period.

Similar articles

Cited by

References

    1. Scharfman HE. The neurobiology of epilepsy. Curr Neurol Neurosci Rep. 2007;7(4):348–54. Epub 2007/07/10. . - PMC - PubMed
    1. Reddy DS, Kuruba R. Experimental Models of Status Epilepticus and Neuronal Injury for Evaluation of Therapeutic Interventions International Journal of Molecular Sciences. 2013;14(9):18284–318. 10.3390/ijms140918284 - DOI - PMC - PubMed
    1. Rao MS, Hattiangady B, Reddy DS, Shetty AK. Hippocampal neurodegeneration, spontaneous seizures, and mossy fiber sprouting in the F344 rat model of temporal lobe epilepsy. J Neurosci Res. 2006;83(6):1088–105. Epub 2006/02/24. 10.1002/jnr.20802 . - DOI - PubMed
    1. Buckmaster PS. Laboratory animal models of temporal lobe epilepsy. Comp Med. 2004;54(5):473–85. Epub 2004/12/04. . - PubMed
    1. Galanopoulou AS, Kokaia M, Loeb JA, Nehlig A, Pitkanen A, Rogawski MA, et al. Epilepsy therapy development: technical and methodologic issues in studies with animal models. Epilepsia. 2013;54 Suppl 4:13–23. Epub 2013/08/09. 10.1111/epi.12295 . - DOI - PMC - PubMed

Publication types

MeSH terms

LinkOut - more resources