. 2015 Jul 10;10(7):e0132934.
doi: 10.1371/journal.pone.0132934. eCollection 2015.

Insulin Regulates the Activity of the High-Affinity Choline Transporter CHT

Affiliations

Insulin Regulates the Activity of the High-Affinity Choline Transporter CHT

Katherine J Fishwick et al. PLoS One. .

Abstract

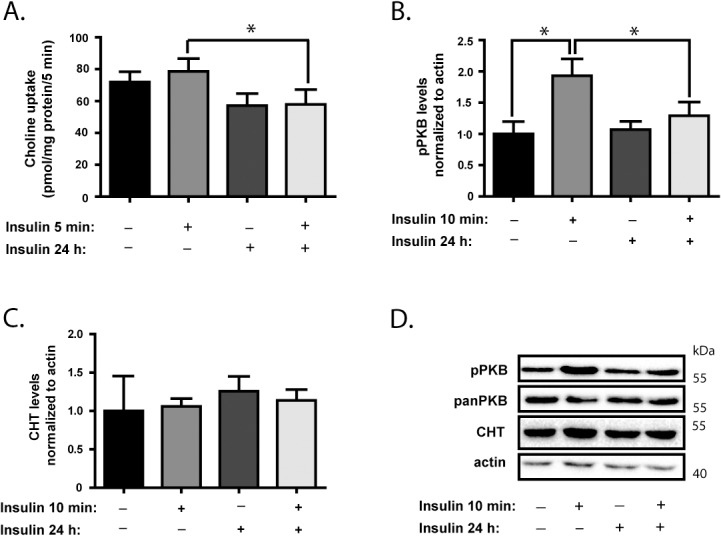
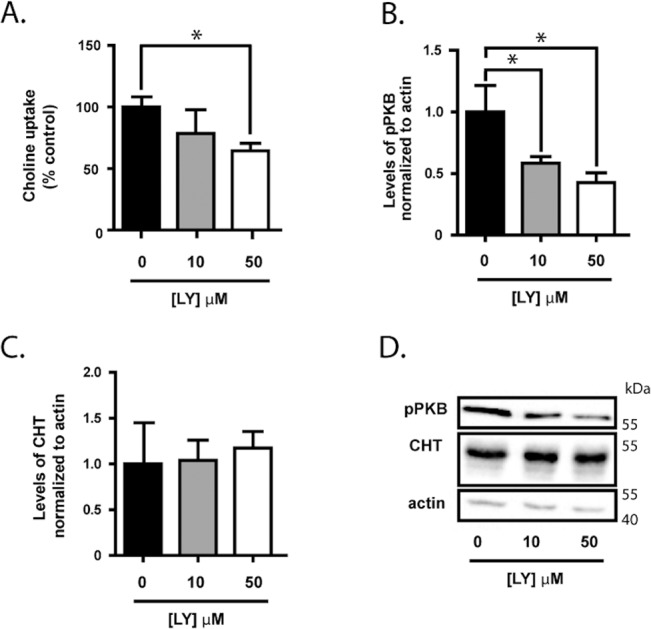
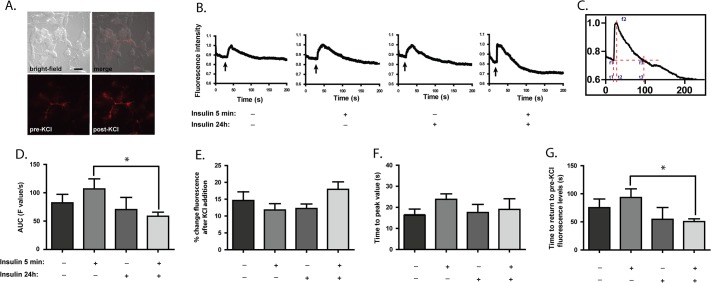
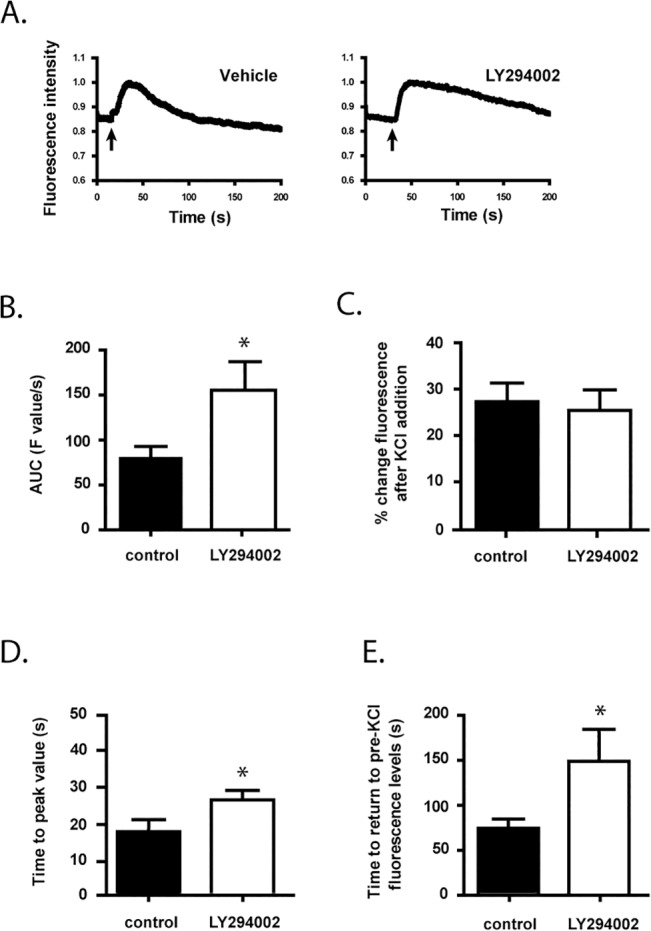
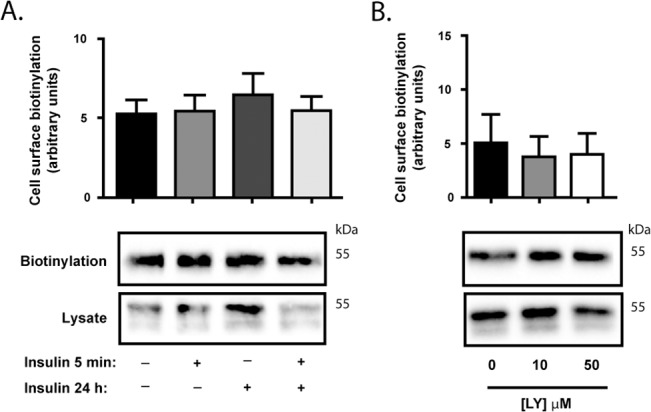
Studies in humans and animal models show that neuronal insulin resistance increases the risk of developing Alzheimer's Disease (AD), and that insulin treatment may promote memory function. Cholinergic neurons play a critical role in cognitive and attentional processing and their dysfunction early in AD pathology may promote the progression of AD pathology. Synthesis and release of the neurotransmitter acetylcholine (ACh) is closely linked to the activity of the high-affinity choline transporter protein (CHT), but the impact of insulin receptor signaling and neuronal insulin resistance on these aspects of cholinergic function are unknown. In this study, we used differentiated SH-SY5Y cells stably-expressing CHT proteins to study the effect of insulin signaling on CHT activity and function. We find that choline uptake activity measured after acute addition of 20 nM insulin is significantly lower in cells that were grown for 24 h in media containing insulin compared to cells grown in the absence of insulin. This coincides with loss of ability to increase phospho-Protein Kinase B (PKB)/Akt levels in response to acute insulin stimulation in the chronic insulin-treated cells. Inhibition of phosphatidylinositol-4,5-bisphosphate 3-kinase (PI3-kinase) in cells significantly lowers phospho-PKB/Akt levels and decreases choline uptake activity. We show total internal reflection microscopy (TIRF) imaging of the dynamic movement of CHT proteins in live cells in response to depolarization and drug treatments. These data show that acute exposure of depolarized cells to insulin is coupled to transiently increased levels of CHT proteins at the cell surface, and that this is attenuated by chronic insulin exposure. Moreover, prolonged inhibition of PI3-kinase results in enhanced levels of CHT proteins at the cell surface by decreasing their rate of internalization.


Conflict of interest statement

Competing Interests: The authors have declared that no competing interests exist.

Figures

Fig 1
Fig 1. SH-SY5Y cells are responsive to acute insulin stimulation and altered insulin signaling impacts choline uptake by CHT.
Differentiated SH-SY5Y cells stably expressing FLAG-tagged CHT proteins (SY5Y-CHT cells) were grown for 24 h in either control media or media containing 20 nM insulin, then either vehicle (water) or an additional 20 nM insulin was added acutely prior to analysis. Panel A. HC-3-sensitive choline uptake activity was determined as the difference between uptake in the absence minus the presence of 1 μM HC-3, and data are calculated as pmol / mg protein per 5 min for 7 independent experiments in this graph. There was negligible HC-3-sensitive choline uptake into non-transfected SH-SY5Y cells or cells that expressed the empty vector pcDNA3.1 (data not shown). Panels B-D. Following this treatment paradigm, cells were lysed for immunoblot analysis of the levels of phospho-PKB/Akt (Ser473), which is activated by insulin receptor signaling, pan-PKB/Akt, CHT protein and actin. The anti-CHT antibody used can detect both endogenous CHT and FLAG-tagged CHT proteins expressed in these cells. Panel B. Densitometric analysis of pPKB/Akt levels were normalized to sample actin levels for 9 independent experiments. Panel C. Densitometric analysis of CHT protein levels were normalized to sample actin levels for 8 independent experiments. Panel D. The representative immunoblots shown are from 5 independent experiments. Data in Panels A to C are expressed as the mean ± SEM, with statistically-significant differences assessed by repeated-measures ANOVA; asterisks denote p ≤ 0.05.
Fig 2
Fig 2. Inhibition of PI3-Kinase alters choline uptake in SH-SY5Y cells.
Cells were treated with the PI3-Kinase inhibitor LY294002 with the concentrations indicated in the Fig Panel A. HC-3-sensitive choline uptake by CHT was measured as indicated in Fig 1 following 5 min exposure of differentiated SY5T-CHT cells to LY294002 treatment. Data are normalized to the control treatment group for n = 3 independent experiments. Panels B-D. Cells were prepared for immunoblot analysis of pPKB/Akt, CHT and actin levels following 5 min treatment with LY294002 from 4 independent experiments. Panel B. Densitometric analysis of pPKB levels were normalized to sample actin levels. Panel C. Densitometric analysis of CHT protein levels were normalized to sample actin levels. Panel D. The representative immunoblots shown are from 4 independent experiments. Data in Panels A to C are expressed as the mean ± SEM, with statistically-significant differences assessed by repeated-measures ANOVA with asterisks denoting p < 0.05.
Fig 3
Fig 3. Dynamics of CHT internalization are altered by acute insulin treatment.
Cells were grown for 24 h with the addition of either vehicle (water) or 20 nM insulin. To facilitate TIRF microscopy, FLAG-CHT was labeled by 20 min incubation at 37°C with AlexaFluor 555-labeled rabbit anti-FLAG antibody, then the cells were washed 3 times with HBSS at the end of this period to remove background non-specific labeling. The initial experiments tested the ability of either acute vehicle or insulin addition to alter total cell fluorescence levels related to the movement of CHT proteins to the cell surface; neither of these treatments caused significant changes in fluorescence levels. Panel A. Bright-field and fluorescence images of cells prior to and after KCl addition with scale bar indicating 20 μm. The imaging protocol was as follows: the culture dish was set on the stage of the TIRF microscope, either insulin or vehicle were added and imaging was started for 30–60 sec, then a small volume of 1 M KCl was applied to the area of the cells by pressure ejection and imaging was continued for a further 3–4 min. Images were captured at 150 nm depth from the coverslip, and experiments were performed at room temperature to reduce the rate of cellular trafficking events being imaged. Panel B. Representative traces of changes in the cellular fluorescence levels over the time course of imaging with various treatments, as indicated. The arrows indicate when KCl was applied to the cells. Panel C. Schematic representation indicating analysis of changes in cell fluorescence in live cells in Panels D – G. Panel D. Area-under-the-curve (AUC) analysis of fluorescence images calculated as the sum of fluorescence values between t1 and t3, analyzed using GraphPad Prism v.5.0. Panel E. Percentage change in cell surface fluorescence levels following K+-depolarization levels, calculated using the formula [(f2-f1)/((f1+f2)/2)*100)]. Panel F. Time-to-peak value calculated as the time at point t2 minus that at point t1. Panel G. Time taken for cell fluorescence to return to baseline values calculated as time point t3 minus time point t2. Typically 2 or 3 regions of interest having high fluorescence corresponding to 2 to 3 individual cells were chosen for analysis per culture dish, with 4 to 5 dishes analyzed per treatment group in 2 or 3 independent experiments. Data in Panels D to G are expressed as the mean ± SEM, with statistically-significant differences assessed by unpaired Student’s t-test; asterisks denote p ≤ 0.05 compared to cells grown in control conditions (absence of 24 h treatment with insulin) and acutely stimulated with insulin.
Fig 4
Fig 4. Dynamics of CHT trafficking are altered by LY294002 treatment.
Cells were grown for 24 h in the presence of either vehicle or 10 μM LY294002 before being imaged by TIRF microscopy. CHT proteins were fluorescently labeled as in Fig 3. The imaging protocol was as follows: the dish was set on the stage of the TIRF microscope and imaging was started for 30–60 sec, then a small volume of 2.5 M KCl was applied to the area of the cells by pressure ejection and imaging was continued for a further 3–4 min. Images were captured at 150 nm depth from the coverslip, and experiments were performed at room temperature. Panel A. Representative traces of changes in the cellular fluorescence levels over the time course of imaging with various treatments, as indicated. The arrows indicate when KCl was applied to the cells. Panel B. Area-under-the-curve (AUC) analysis of fluorescence images was calculated as described in Fig 3. Panel C. Percentage changes in cell surface fluorescence levels following K+-depolarization levels calculated as described in Fig 3. Panel D. Time-to-peak value calculated as described in Fig 3. Panel E. Time taken for cell fluorescence to return to baseline values calculated as described in Fig 3. In these experiments, 1 to 5 regions of interest having high fluorescence corresponding to 1 to 5 individual cells were analyzed per culture dish, with 4 to 5 dishes analyzed per treatment group in 3 independent experiments. Data in Panels B to E are expressed as the mean ± SEM, with statistically-significant differences assessed by unpaired Student’s t-test; asterisks denote p ≤ 0.05.
Fig 5
Fig 5. Cell surface CHT levels are unchanged by altered PI3-Kinase signaling in non-depolarized cells.
Groups of SY5Y-CHT cells were treated with either vehicle or 20 nM insulin for 24 h, then prior to analyzing cell surface CHT levels cells were treated for 5 min with either vehicle, 20 nM insulin or 10 μM LY294002 as indicated. Cells were then cooled to 4°C and biotin added to cells on ice for 1 h before washing and lysing cells. Panel A. Densitometric analysis of immunoblots of biotinylated CHT recovered from cell surface protein biotinylation assays of vehicle or insulin-treated cells were normalized to CHT protein content in total cell lysates. Representative immunoblots for biotinylated CHT and cell lysate samples are shown, with 8 independent experiments analyzed. Panel B. Densitometric analysis of immunoblots of biotinylated CHT recovered from cell surface protein biotinylation assays of vehicle or LY294002-treated cells were normalized to CHT protein content in total cell lysates. Representative immunoblots for biotinylated CHT and cell lysate samples are shown, with 3 independent experiments analyzed. Data are expressed as the mean ± SEM for densitometry, with arbitrary units representing a measure of immunoblot band intensity.

Similar articles

Cited by

References

    1. Hasselmo ME, Giocomo LM. Cholinergic modulation of cortical function. J Mol Neurosci. 2006;30:133–5. - PubMed
    1. Woolf NJ, Butcher LL. Cholinergic systems mediate action from movement to higher consciousness. Behav Brain Res. 2011;221:488–98. 10.1016/j.bbr.2009.12.046 - DOI - PubMed
    1. Francis PT, Palmer AM, Snape M, Wilcock GK. The cholinergic hypothesis of Alzheimer’s disease: a review of progress. J Neurol Neurosurg Psychiatry. 1999;66:137–47. - PMC - PubMed
    1. Ikonomovic MD, Mufson EJ, Wuu J, Cochran EJ, Bennett DA, DeKosky ST. Cholinergic plasticity in hippocampus of individuals with mild cognitive impairment: correlation with Alzheimer's neuropathology. J Alzheimer’s Dis. 2003;5:39–48. - PubMed
    1. Collier B, Katz HS. Acetylcholine synthesis from recaptured choline by a sympathetic ganglion. J Physiol. 1974;238:639–55. - PMC - PubMed

Publication types

MeSH terms