

Cyclin Y Is Involved in the Regulation of Adipogenesis and Lipid Production
- PMID: 26161966
- PMCID: PMC4498623
- DOI: 10.1371/journal.pone.0132721
Cyclin Y Is Involved in the Regulation of Adipogenesis and Lipid Production
Abstract
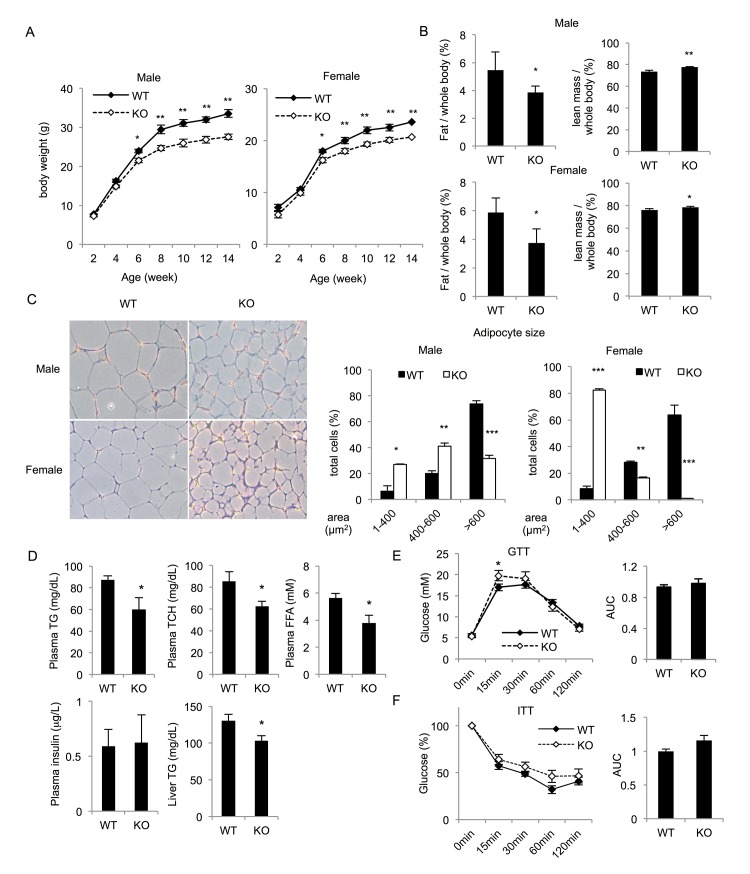
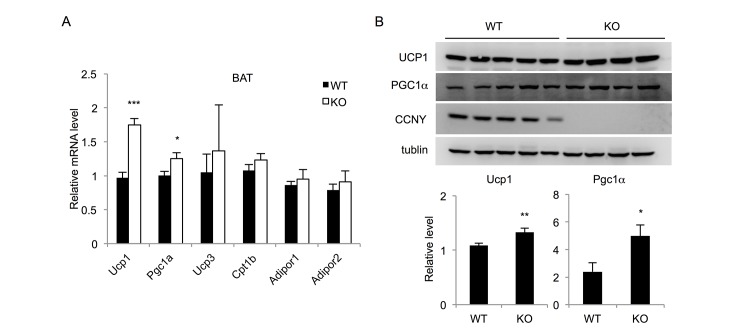
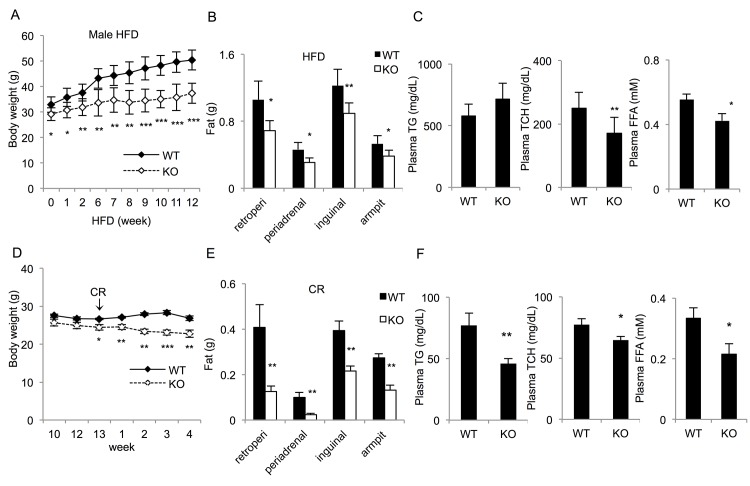
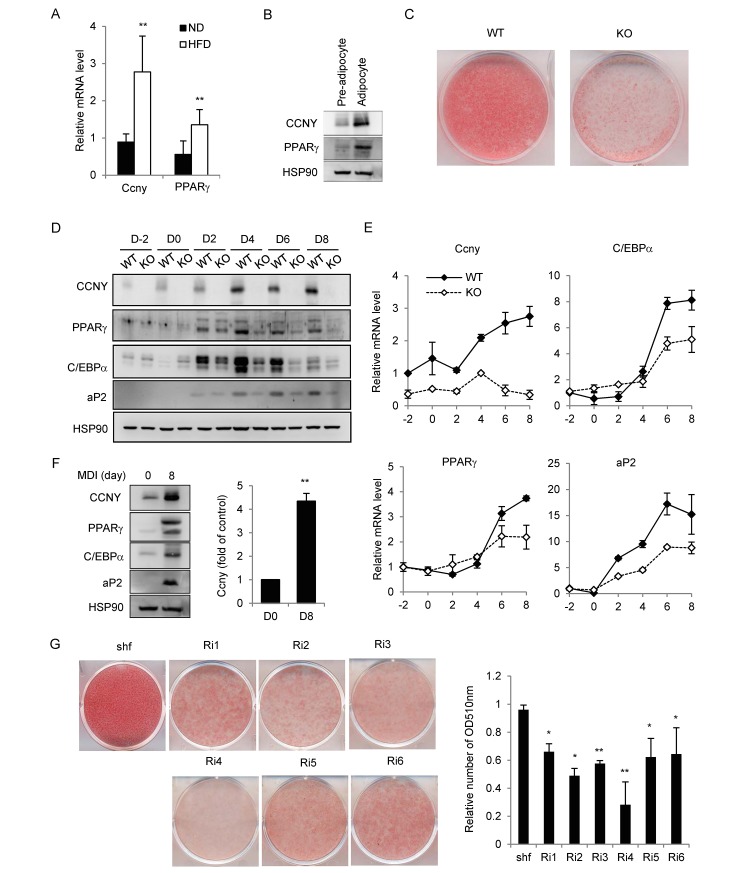
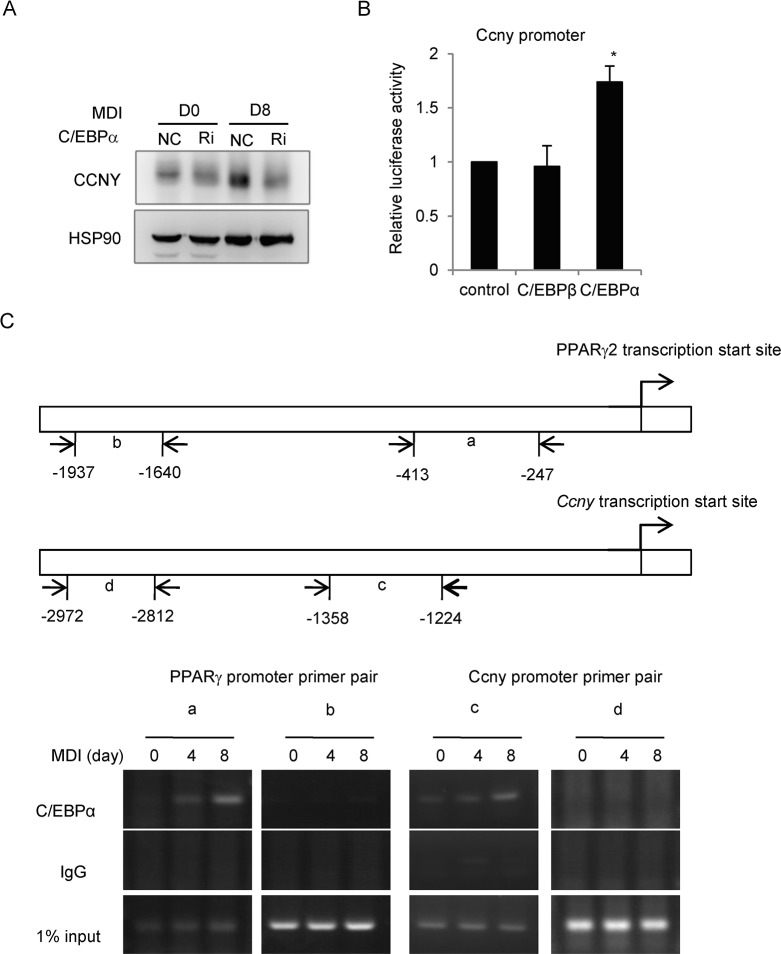
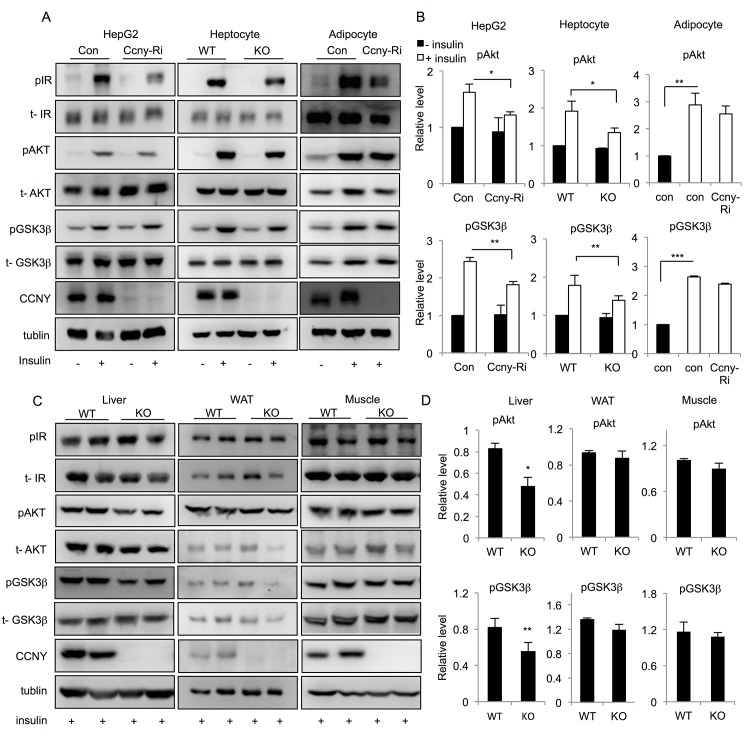
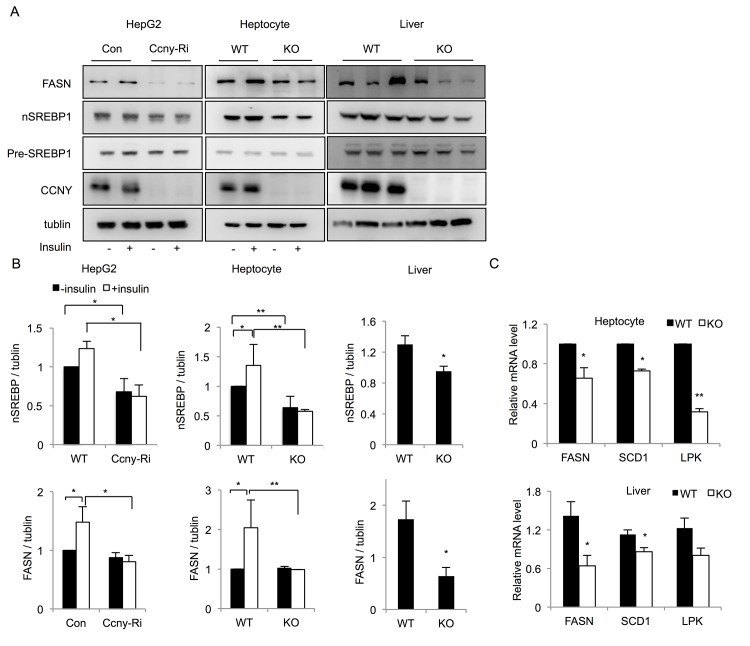
A new member of the cyclin family cyclin Y (CCNY) is involved in the regulation of various physiological processes. In this study, the role of CCNY in energy metabolism was characterized. We found that compared with wild-type (WT) mice, Ccny knockout (KO) mice had both lower body weight and lower fat content. The Ccny KO mice also had a higher metabolic rate, resisted the stress of a high-fat diet, and were sensitive to calorie restriction. The expression levels of UCP1 and PGC1α were significantly higher in the brown adipose tissue (BAT) of the Ccny KO mice than that of the WT littermate controls, whereas there was no significant difference in BAT weight between the WT and the Ccny KO mice. In addition, the down-regulation of Ccny resulted in suppression of white adipocyte differentiation both in vivo and in vitro, while the expression of Ccny was up-regulated by C/EBPα. Furthermore, both hepatocytes and HepG2 cells that were depleted of Ccny were insensitive to insulin stimulation, consistent with the significant inhibition of insulin sensitivity in the liver of the Ccny KO mice, but no significant changes in WAT and muscle, indicating that CCNY is involved in regulating the hepatic insulin signaling pathway. The hepatic insulin resistance generated by Ccny depletion resulted in down-regulation of the sterol-regulatory element-binding protein (SREBP1) and fatty acid synthase (FASN). Together, these results provide a new link between CCNY and lipid metabolism in mice, and suggest that inhibition of CCNY may offer a therapeutic approach to obesity and diabetes.
Conflict of interest statement
Figures
Similar articles
-
Alpinia officinarum inhibits adipocyte differentiation and high-fat diet-induced obesity in mice through regulation of adipogenesis and lipogenesis.J Med Food. 2012 Nov;15(11):959-67. doi: 10.1089/jmf.2012.2286. J Med Food. 2012. PMID: 23126661
-
Green tea (-)-epigallocatechin-3-gallate reduces body weight with regulation of multiple genes expression in adipose tissue of diet-induced obese mice.Ann Nutr Metab. 2009;54(2):151-7. doi: 10.1159/000214834. Epub 2009 Apr 22. Ann Nutr Metab. 2009. PMID: 19390166
-
Impaired adipogenesis in adipose tissue associated with hepatic lipid deposition induced by chronic inflammation in mice with chew diet.Life Sci. 2015 Sep 15;137:7-13. doi: 10.1016/j.lfs.2015.07.013. Epub 2015 Jul 17. Life Sci. 2015. PMID: 26188592
-
The role of cyclin Y in normal and pathological cells.Cell Cycle. 2023 Apr;22(8):859-869. doi: 10.1080/15384101.2022.2162668. Epub 2022 Dec 28. Cell Cycle. 2023. PMID: 36576166 Free PMC article. Review.
-
In Search of New Therapeutic Targets in Obesity Treatment: Sirtuins.Int J Mol Sci. 2016 Apr 19;17(4):572. doi: 10.3390/ijms17040572. Int J Mol Sci. 2016. PMID: 27104517 Free PMC article. Review.
Cited by
-
Cyclin Y-mediated transcript profiling reveals several important functional pathways regulated by Cyclin Y in hippocampal neurons.PLoS One. 2017 Feb 27;12(2):e0172547. doi: 10.1371/journal.pone.0172547. eCollection 2017. PLoS One. 2017. PMID: 28241067 Free PMC article.
-
Role of cell cycle regulators in adipose tissue and whole body energy homeostasis.Cell Mol Life Sci. 2018 Mar;75(6):975-987. doi: 10.1007/s00018-017-2668-9. Epub 2017 Oct 7. Cell Mol Life Sci. 2018. PMID: 28988292 Free PMC article. Review.
-
Diet-MEF2 interactions shape lipid droplet diversification in muscle to influence Drosophila lifespan.Aging Cell. 2020 Jul;19(7):e13172. doi: 10.1111/acel.13172. Epub 2020 Jun 14. Aging Cell. 2020. PMID: 32537848 Free PMC article.
-
Association between DNA Methylation in Whole Blood and Measures of Glucose Metabolism: KORA F4 Study.PLoS One. 2016 Mar 28;11(3):e0152314. doi: 10.1371/journal.pone.0152314. eCollection 2016. PLoS One. 2016. PMID: 27019061 Free PMC article.
-
SREBP-regulated lipid metabolism: convergent physiology - divergent pathophysiology.Nat Rev Endocrinol. 2017 Dec;13(12):710-730. doi: 10.1038/nrendo.2017.91. Epub 2017 Aug 29. Nat Rev Endocrinol. 2017. PMID: 28849786 Review.
References
-
- Stephane Gesta, Yu Hua Tseng, Kahn CR. Developmental origin of fat: tracking obesity to its source. Cell. 2007; 131: 242–256. - PubMed
-
- Muoio DM, Newgard CB. Obesity-related derangements in metabolic regulation. Annu Rev Biochem. 2006; 75: 367–401. - PubMed
-
- Taniguchi CM, Emanuelli B, Kahn CR. Critical nodes in signalling pathways: insights into insulin action. Nat Rev Mol Cell Biol. 2006; 7: 85–96. - PubMed
Publication types
MeSH terms
Substances
LinkOut - more resources
Full Text Sources
Other Literature Sources
Molecular Biology Databases
Research Materials
Miscellaneous
