. 2016 Jan;278(1):114-24.
doi: 10.1148/radiol.2015142141. Epub 2015 Jul 8.

Hepatic MR Elastography: Clinical Performance in a Series of 1377 Consecutive Examinations

Affiliations

Hepatic MR Elastography: Clinical Performance in a Series of 1377 Consecutive Examinations

Meng Yin et al. Radiology. 2016 Jan.

Abstract

Purpose: To assess the technical success rate and diagnostic performance of liver magnetic resonance (MR) elastography.

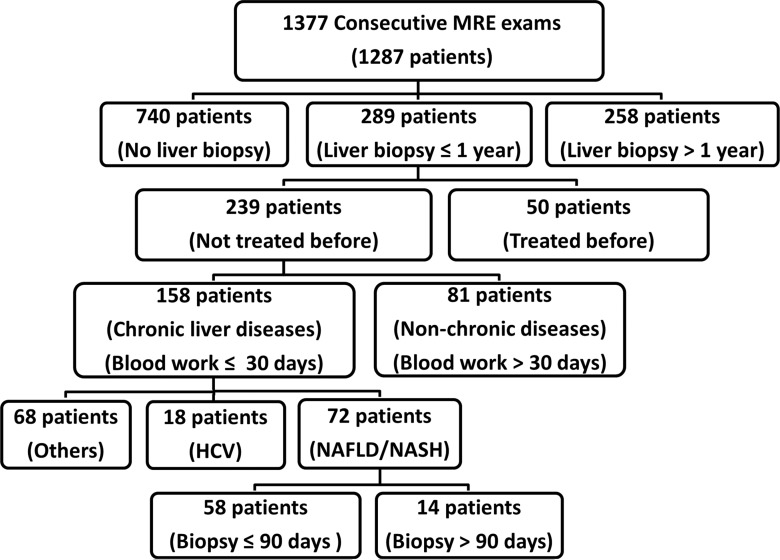
Materials and methods: This retrospective study was approved by the institutional review board with patient informed consent. A total of 1377 consecutive MR elastography examinations performed between 2007 and 2010 in 1287 patients for clinical indications were included. Medical records were used to retrieve liver stiffness as assessed with MR elastography, histologic analysis, blood work, and other liver disease-related information. Nonparametric Kruskal-Wallis tests and analysis of covariance methods were used to evaluate the diagnostic values and relationships of the collected data.

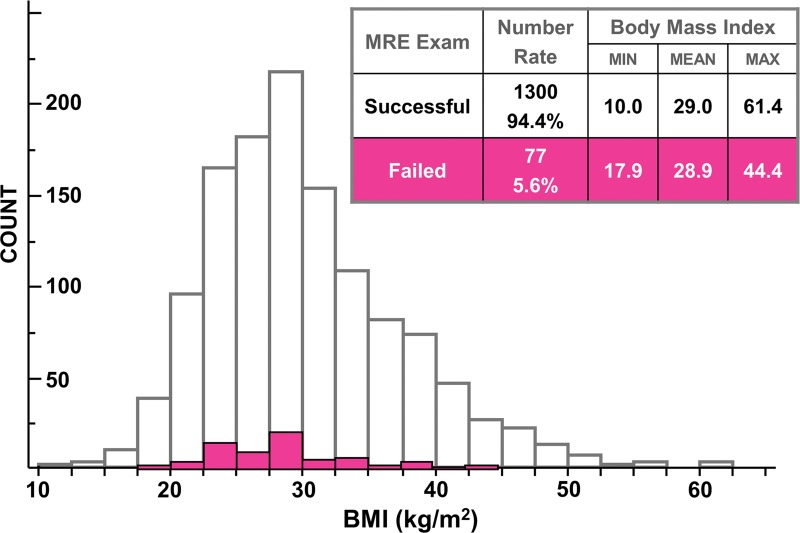
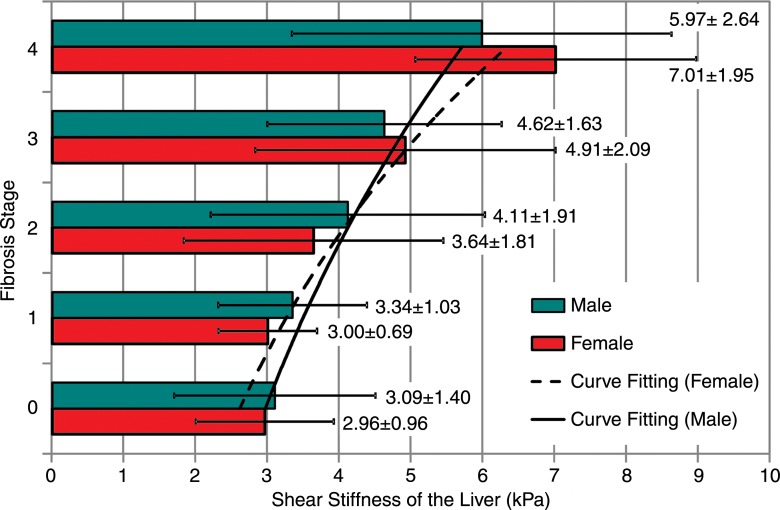
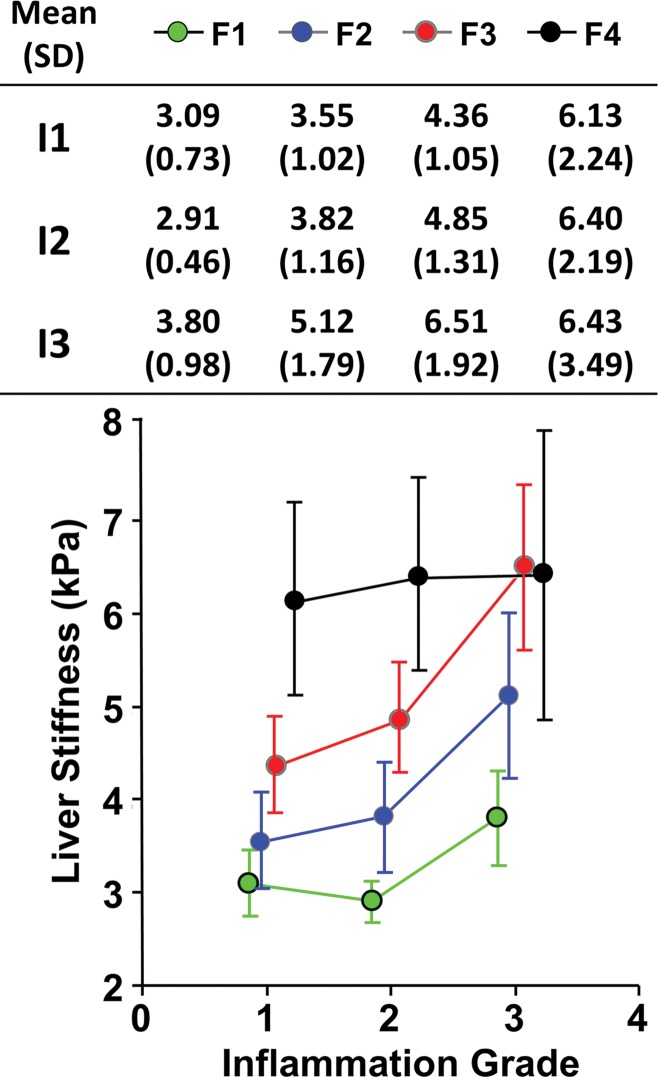
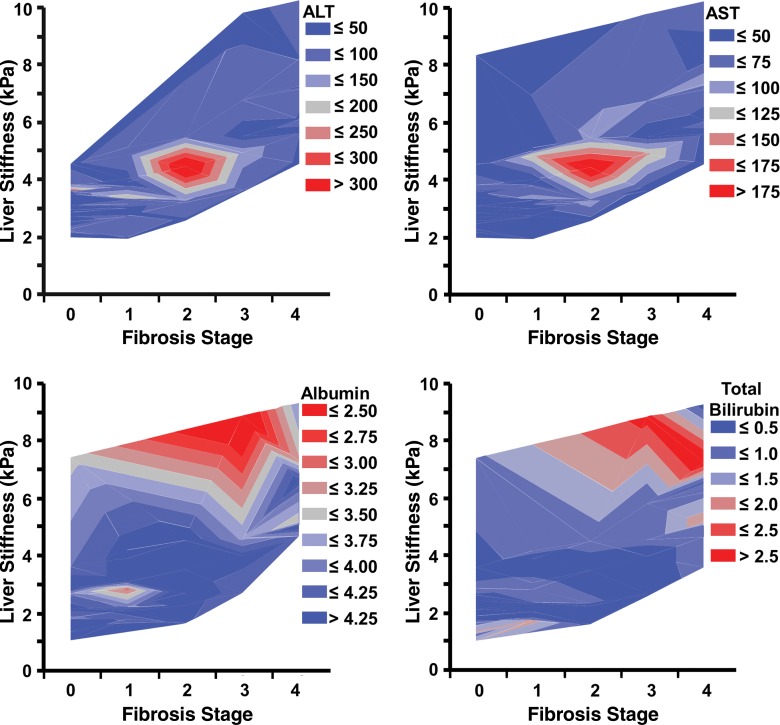
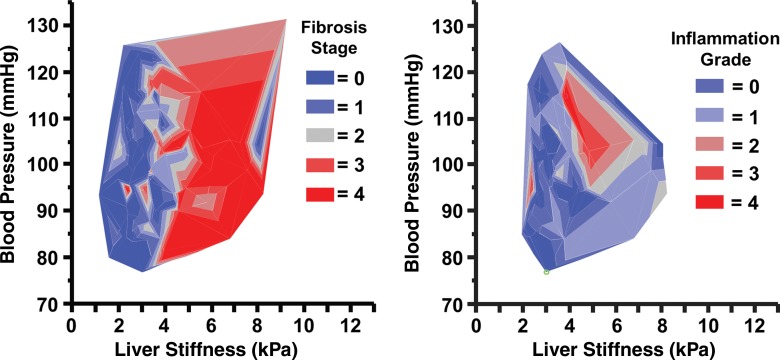
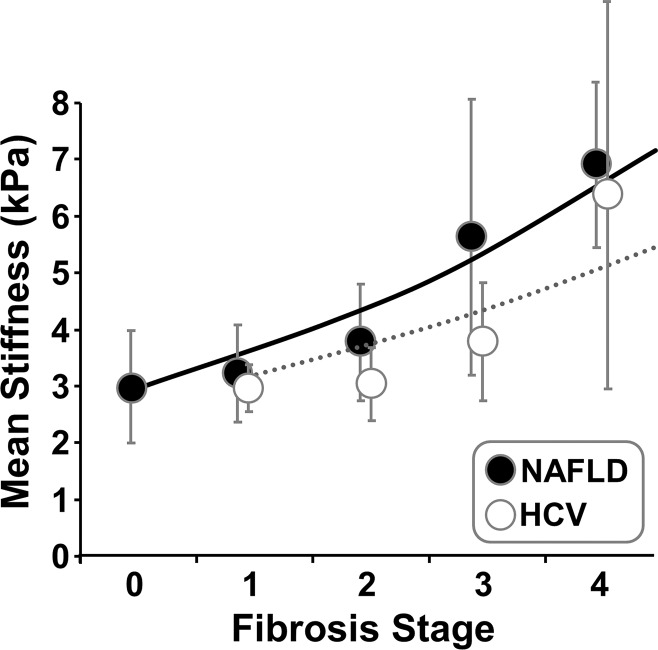
Results: Hepatic MR elastography had a success rate of 94.4% (1300 of 1377 cases) and yielded reproducible measurements (r = 0.9716, P < .0001) in the study cohort, with a complex patient profile and multiple interpreters. Body mass index had no significant effect on success rate (P = .2). In 289 patients who underwent liver biopsy within 1 year of the MR elastography date, mean liver stiffness as assessed with MR elastography was significantly higher in patients with advanced fibrosis (stages F3, F4) than in those with mild to moderate fibrosis (stages F0, F1, F2) (5.93 kPa ± 2.31 [standard deviation] vs 3.35 kPa ± 1.44, P < .0001). Liver stiffness is associated with many factors other than fibrosis extent, including cause of fibrosis (viral hepatitis C vs nonalcoholic fatty liver disease, P = .025), inflammation (severe vs mild to moderate, P = .03), and hepatic metabolic and synthetic function (no fibrosis vs intermediate fibrosis, P ≤ .01).

Conclusion: In a general clinical practice environment, hepatic MR elastography is a robust imaging method with a high success rate in a broad spectrum of patients. It also shows the complex association between liver stiffness and hepatic pathophysiology.


Figures

Figure 1:
Figure 1:
Flowchart of our retrospective study design shows the approach we used to divide our study cohort into several subgroups to retrospectively evaluate the diagnostic performance of MR elastography (MRE).
Figure 2:
Figure 2:
Graph shows distribution and reliability of MR elastography–assessed liver stiffness in 1300 successful examinations. Liver stiffness has a left-skewed broad distribution from 1.1 to 18.8 kPa, with a mean stiffness of 4.12 kPa and a median stiffness of 3.38 kPa. There is good correlation between the on-site radiologists’ readings and the expert reviewers’ readings (r = .9716, P < .0001).
Figure 3:
Figure 3:
Graph shows patient BMI effect on the technical success rate of liver MR elastography (MRE). The BMI distribution in patients with successful liver MR elastography examinations is shown with white bars (25% and 75% quantiles, 24.9 and 33.9 kg/m2, respectively; median, 28.9 kg/m2; mean, 29.9 kg/m2), while BMI distribution in patients with unsuccessful liver MR elastography examinations is shown with pink bars (25% and 75% quantiles, 24.6 and 32.0 kg/m2, respectively; median, 28.3 kg/m2; mean, 28.8 kg/m2). The minimum, mean, and maximum BMI values for successful and unsuccessful liver MR elastography examinations are listed in the inset table. Similar distributions of BMI were observed for both successful and unsuccessful liver MR elastography examinations.
Figure 4:
Figure 4:
A, MR in-phase anatomic image; B, MR elastography wave image; and, C, calculated elastogram in a 60-year-old woman with NASH and a BMI of 61 kg/m2. Shear waves penetrated the 5–8-cm-thick subcutaneous fat over the patient’s chest wall, then propagated through one-third of the liver with acceptable wave amplitude for stiffness calculation.
Figure 5:
Figure 5:
Graph shows effect of sex on MR elastography–assessed liver stiffness. No significant differences were found between men and women for each fibrosis stage (P > .05 for all fibrosis stages). Exponential curve fitting results show the relationship between logarithmic liver stiffness and fibrosis stage in female (dashed line) and male (solid line) patients. Mean liver stiffness and the corresponding standard deviation for each fibrosis stage and sex is shown in the text and error bars. There was no significant effect of sex on the correlation between fibrosis stage and logarithmic stiffness (P = .3).
Figure 6:
Figure 6:
Graph shows the effect of hepatic inflammation on liver stiffness. Mean liver stiffness and the corresponding standard deviation (SD) for different fibrosis stages (F1, F2, F3, and F4) and inflammation grades (I1, I2, I3) are shown in the inset table and by the color-coded dots and error bars (standard deviation). F0 fibrosis was omitted because of an overlap with a previous publication. I4 inflammation also was omitted because data were available in only one patient. The inflammation grade is slightly offset from values in the horizontal axis to allow for visualization of overlapping error bars. Both fibrosis and inflammation cause liver stiffness augmentation, which was seen in patients without treatment before MR elastography and liver biopsy.
Figure 7:
Figure 7:
Graphs show serum marker values in patients with varying degrees of liver fibrosis. Patients with intermediate liver fibrosis (stage F1–F3) and liver stiffness (3.5–5.0 kPa) had the highest alanine aminotransferase (ALT) and aspartate aminotransferase (AST) values when compared with patients with advanced fibrosis. Patients with advanced liver fibrosis (stage F4) and liver stiffness higher than 6.0 kPa had a decreased albumin value and an increased total bilirubin value when compared with patients with early fibrosis.
Figure 8:
Figure 8:
Graphs show mean blood pressure measurements in patients with varying degrees of hepatic fibrosis and inflammation. No significant correlations were found between mean blood pressure, liver stiffness, and fibrosis stage. The most significant amount of inflammation was observed in patients with liver stiffness greater than 3.5 kPa and mean blood pressure greater than 92 mmHg.
Figure 9:
Figure 9:
Graph shows exponential regression results in patients with NAFLD and HCV. There were no significant differences in mean liver stiffness for each fibrosis stage between the two different diseases (P > .1 for all). However, both fibrosis stage and disease have significant effects on liver stiffness measurements (P < .0001 for fibrosis stage; P = .0252 for disease).

References

    1. Friedman SL. Hepatic fibrosis: overview. Toxicology 2008;254(3):120–129. - PubMed
    1. Puche JE, Saiman Y, Friedman SL. Hepatic stellate cells and liver fibrosis. Compr Physiol 2013;3(4):1473–1492. - PubMed
    1. Xu R, Zhang Z, Wang FS. Liver fibrosis: mechanisms of immune-mediated liver injury. Cell Mol Immunol 2012;9(4):296–301. - PMC - PubMed
    1. Hernandez-Gea V, Friedman SL. Pathogenesis of liver fibrosis. Annu Rev Pathol 2011;6:425–456. - PubMed
    1. Ellis EL, Mann DA. Clinical evidence for the regression of liver fibrosis. J Hepatol 2012;56(5):1171–1180. - PubMed