. 2015 Nov;58(5):457-66.
doi: 10.1016/j.ceca.2015.06.013. Epub 2015 Jul 2.

Amphetamine activates calcium channels through dopamine transporter-mediated depolarization

Affiliations

Amphetamine activates calcium channels through dopamine transporter-mediated depolarization

Krasnodara N Cameron et al. Cell Calcium. 2015 Nov.

Abstract

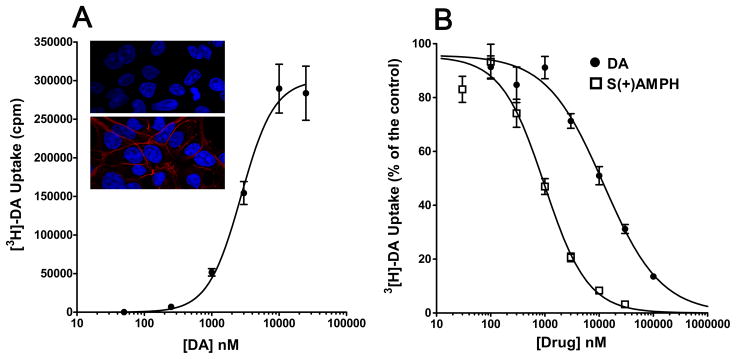
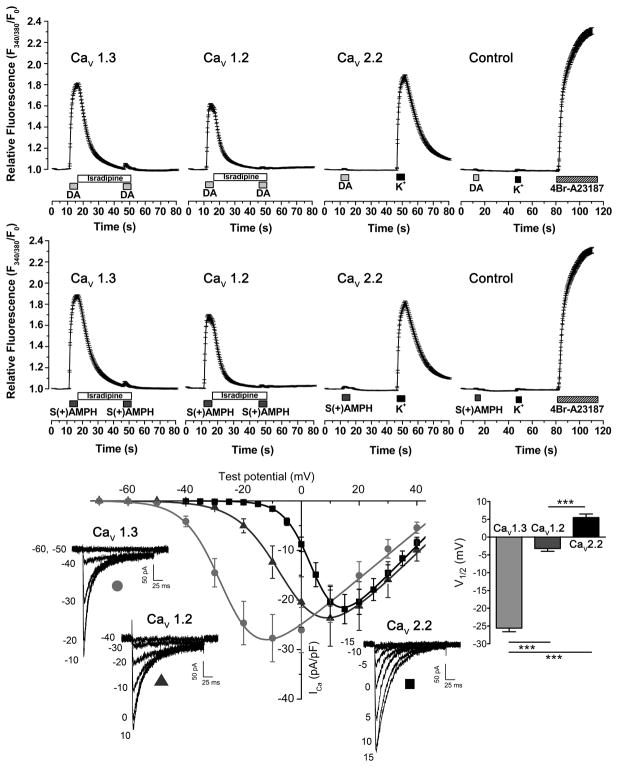
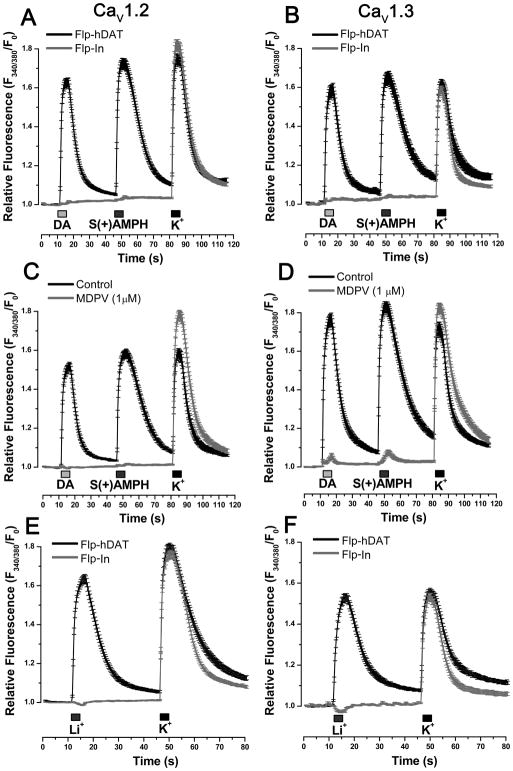
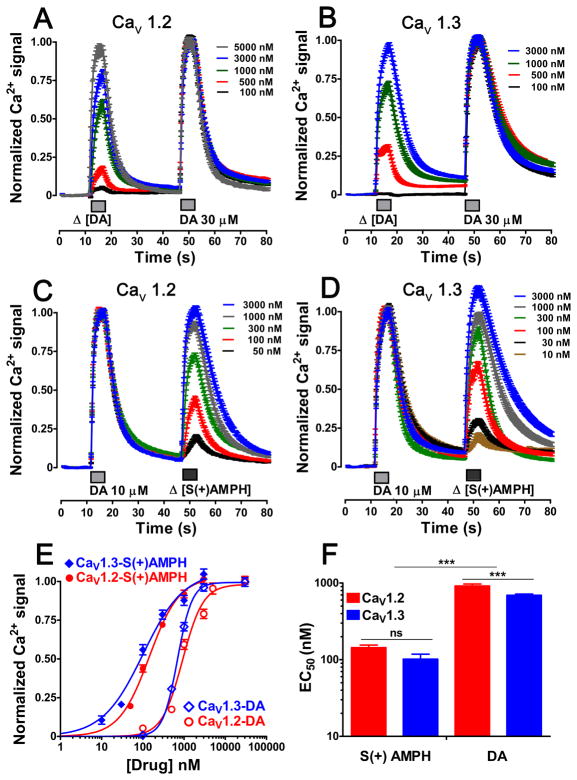
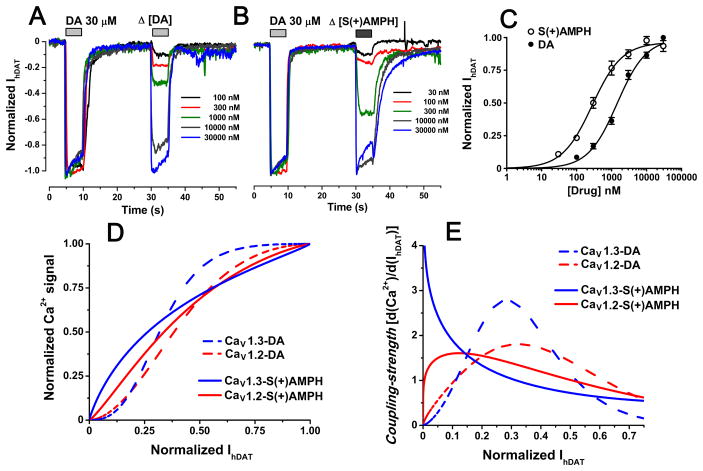
Amphetamine (AMPH) and its more potent enantiomer S(+)AMPH are psychostimulants used therapeutically to treat attention deficit hyperactivity disorder and have significant abuse liability. AMPH is a dopamine transporter (DAT) substrate that inhibits dopamine (DA) uptake and is implicated in DA release. Furthermore, AMPH activates ionic currents through DAT that modify cell excitability presumably by modulating voltage-gated channel activity. Indeed, several studies suggest that monoamine transporter-induced depolarization opens voltage-gated Ca(2+) channels (CaV), which would constitute an additional AMPH mechanism of action. In this study we co-express human DAT (hDAT) with Ca(2+) channels that have decreasing sensitivity to membrane depolarization (CaV1.3, CaV1.2 or CaV2.2). Although S(+)AMPH is more potent than DA in transport-competition assays and inward-current generation, at saturating concentrations both substrates indirectly activate voltage-gated L-type Ca(2+) channels (CaV1.3 and CaV1.2) but not the N-type Ca(2+) channel (CaV2.2). Furthermore, the potency to achieve hDAT-CaV electrical coupling is dominated by the substrate affinity on hDAT, with negligible influence of L-type channel voltage sensitivity. In contrast, the maximal coupling-strength (defined as Ca(2+) signal change per unit hDAT current) is influenced by CaV voltage sensitivity, which is greater in CaV1.3- than in CaV1.2-expressing cells. Moreover, relative to DA, S(+)AMPH showed greater coupling-strength at concentrations that induced relatively small hDAT-mediated currents. Therefore S(+)AMPH is not only more potent than DA at inducing hDAT-mediated L-type Ca(2+) channel currents but is a better depolarizing agent since it produces tighter electrical coupling between hDAT-mediated depolarization and L-type Ca(2+) channel activation.

Keywords: Excitability; L-type Ca(2+) channels; MDMA; Monoamine transporters; Neurotransmitter transport; Serotonin; Stimulants.


Conflict of interest statement

The authors declare no conflict of interest.

Figures

Figure 1
Figure 1. S(+)AMPH is more potent than DA as an hDAT substrate
A. Confocal images show hDAT expression in Flp-hDAT cells (red stain in bottom panel) but not in parental Flp-InTm T-RExTM cells (top panel). DAPI nuclear staining is depicted in blue. Flp-hDAT cells show specific [3H] DA uptake with the following fitting parameters (see Eq. 1): EC50 = 2.73 ± 0.49 μM, Hill slope = 1.8 ± 0.5 (n = 18). B. Competition of [3H]DA uptake using cold dopamine or S(+)AMPH yielded the following fitting parameters (Eq. 1): IC50 = 12.05 ± 1.79 μM, Hill Slope = 0.8 ± 0.1 (n = 9) and IC50 = 0.98*** ± 0.12 μM, Hill slope = 1.1 ± 0.1 (n = 11, ***p < 0.001 vs. IC50 DA competition, t-test) for DA and S(+)AMPH, respectively.
Figure 2
Figure 2. S(+)AMPH or DA activates CaV1.2 and CaV1.3, but not CaV2.2
(Upper and middle panel) Intracellular Ca2+ determinations in Fura-2AM loaded Flp-hDAT cells evaluated by fluorescence microcopy, under constant perfusion and at 35°C. Flp-hDAT cells were co-transfected with CaV1.3, CaV1.2 or CaV2.2 plus β3, α2δ and EGFP plasmids. The α1 subunit was omitted from the plasmid transfection mix for the control condition. Transfected cells were identified by their EGFP signal and then briefly exposed to dopamine 10 μM (DA), S(+)AMPH 5 μM, high potassium external solution 130 mM (K+, equimolar substitution of Na+) or 4Br-A23187 (calcium ionophore, 5 μM) as indicated in the timeline of each panel. Isradipine (2 μM) averts Ca2+ signals induced by both hDAT substrates. Each trace constitutes the mean ± s.e.m. of n ≥ 81 cells per condition. (Lower panel) Voltage dependence of CaV1.2, CaV1.3 and CaV2.2- mediated Ca2+ currents: HEK293T cells were co-transfected with β3, α2δ, and EGFP expression plasmids plus alternatively CaV1.3, CaV1.2 or CaV2.2 plasmids. The Ca2+ current (ICa) recordings were carried out at room temperature under constant perfusion. Test pulses in 5 mV steps for CaV2.2 or 10 mV steps for CaV1.2 and CaV1.3 were applied from a holding potential of −80 mV. Representative responses are shown for CaV1.3 (light grey circle), CaV1.2 (dark grey triangle) and CaV2.2 (black square) and the magnitude of the test potentials are indicated in mV. The peak current density for the voltage steps were fit to Eq. 2 and yielded the following parameters: Gmax = 497 ± 86, 560 ± 128 and 631 ± 77 (pS/pF); V1/2 = −25.6 ± 1.0, −3.2 ± 0.8 and 5.5 ± 1.0 mV (***p < 0.001, one-way ANOVA, indicated in the figure); k = 6.7 ± 0.2, 7.7 ± 0.2 and 4.7 ± 0.1 (mV) for CaV1.3 (n = 8), CaV1.2 (n = 7) and CaV2.2 (n = 8), respectively.
Figure 3
Figure 3. hDAT-mediated depolarization activates L-type Ca2+ channels in Flp-hDAT cells
Intracellular Ca2+ concentration was determined by fluorescence microscopy in Flp-hDAT or the parental Flp-InTM T-RExTM 293 (Flp-In) cells (no hDAT expression) cells co-transfected with CaV1.2 (A, C, E) or CaV1.3 (B, D,F) plus β3, α2δ and EGFP plasmids, using the Ca2+ sensitive dye Fura-2AM. The experiments were carried out under constant perfusion at 35°C. The transfected cells were identified by their EGFP signal. A, B. Cells were briefly exposed to DA 10 μM, S(+)AMPH 5 μM or high potassium external solution 130 mM (K+) as indicated in each panel. C, D. The blockade of hDAT with methylenedioxypyrovalerone (MDPV, 1 μM) prevented Ca2+ signals induced by hDAT substrates. E, F. Cells were exposed to external solution containing Li+ (equimolar substitution of Na+) or external solution with high potassium as indicated in the timeline of each panel. Li+-induced Ca2+ signals only take place in cells expressing hDAT. Traces represent the mean ± s.e.m. of n ≥ 30 cells per condition.
Figure 4
Figure 4. S(+)AMPH is more potent than DA producing Ca2+ signals in L-type Ca2+ channel- expressing Flp-hDAT cells
Intracellular Ca2+ signals were monitored using the calcium sensitive dye Fura-2AM and epifluorescence microscopy. Three days prior to each experiment Flp-hDAT cells were co-transfected with CaV1.3 or CaV1.2 plus β3, α2δ and EGFP plasmids. The EGFP was used as transfection marker. (A, B, C, D) The potency of each compound was calculated using a two-pulse protocol, where one fixed saturating concentration pulse of dopamine works as an internal calibration and a variable concentration pulse was applied to get a dose-response curve. The traces represent the mean ± s.e.m. of n ≥ 48 cells per concentration. E. The dose-response curve was obtained fitting the responses to the Eq.1; cells expressing CaV1.3 the EC50 values and Hill slope were: 693 ± 25 and 102*** ±16 nM (***p < 0.001 one way ANOVA) and 2.5 ± 0.2 and 0.9*** ± 0.1 (***p < 0.001 one way ANOVA) for dopamine and S(+)amphetamine, respectively. Cells expressing CaV1.2 the EC50 values and Hill slope were: 916 ± 54 and 144*** ± 11 nM (***p < 0.001 one way ANOVA) and 1.7 ± 0.2 and 1.2 ± 0.1 for DA and S(+)AMPH, respectively, and (F) for better comparison the EC50 values are plotted.
Figure 5
Figure 5. S(+)AMPH-induced currents are electrically favored to activate L-type Ca2+ channels
Ionic currents were determined by voltage-clamp in whole cell configuration under constant perfusion at 35°C. (A and B) Flp-hDAT cells clamped at −60 mV were exposed to a constant DA calibration pulse and a variable pulse of DA or S(+)AMPH; representative traces for the indicated concentrations tested are depicted in each panel. C. The full dose-response curves were fit to Eq.1 and yield the following parameters: EC50 = 1.44 ± 0.24 μM and 0.28** ± 0.04 μM (**p < 0.01, t-test) and Hill Slope = 1.1 ± 0.1 and 1.0 ± 0.1 for DA and S(+)AMPH, respectively. Each point indicates mean ± s.e.m. of n ≥ 5 current determinations for each concentration. D. The fitted S(+)amphetamine and dopamine Ca2+ signals on Fig. 4E were plotted as a function of the fitted hDAT currents and (E) the coupling-strength index was computed as the first derivative of the Ca2+ signal – hDAT current curves.

Similar articles

Cited by

References

    1. Giros B, Jaber M, Jones SR, Wightman RM, Caron MG. Hyperlocomotion and indifference to cocaine and amphetamine in mice lacking the dopamine transporter. Nature. 1996;379:606–12. - PubMed
    1. Seeman P, Madras BK. Anti-hyperactivity medication: methylphenidate and amphetamine. Mol Psychiatry. 1998;3:386–96. - PubMed
    1. Mignot E. Perspectives in narcolepsy research and therapy. Curr Opin Pulm Med. 1996;2:482–7. - PubMed
    1. Sulzer D, Sonders MS, Poulsen NW, Galli A. Mechanisms of neurotransmitter release by amphetamines: a review. Prog Neurobiol. 2005;75:406–33. - PubMed
    1. Fleckenstein AE, Volz TJ, Riddle EL, Gibb JW, Hanson GR. New insights into the mechanism of action of amphetamines. Annu Rev Pharmacol Toxicol. 2007;47:681–98. - PubMed

Publication types

MeSH terms