

Analysis of the Aspergillus fumigatus Biofilm Extracellular Matrix by Solid-State Nuclear Magnetic Resonance Spectroscopy
- PMID: 26163318
- PMCID: PMC4621319
- DOI: 10.1128/EC.00050-15
Analysis of the Aspergillus fumigatus Biofilm Extracellular Matrix by Solid-State Nuclear Magnetic Resonance Spectroscopy
Abstract
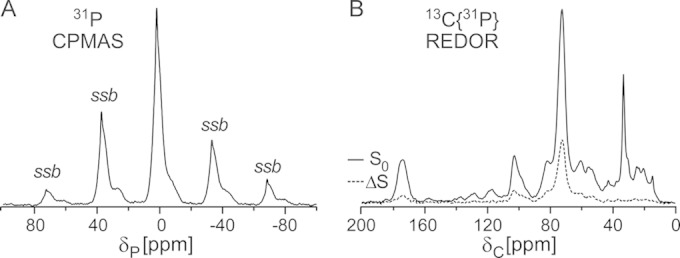
Aspergillus fumigatus is commonly responsible for lethal fungal infections among immunosuppressed individuals. A. fumigatus forms biofilm communities that are of increasing biomedical interest due to the association of biofilms with chronic infections and their increased resistance to antifungal agents and host immune factors. Understanding the composition of microbial biofilms and the extracellular matrix is important to understanding function and, ultimately, to developing strategies to inhibit biofilm formation. We implemented a solid-state nuclear magnetic resonance (NMR) approach to define compositional parameters of the A. fumigatus extracellular matrix (ECM) when biofilms are formed in RPMI 1640 nutrient medium. Whole biofilm and isolated matrix networks were also characterized by electron microscopy, and matrix proteins were identified through protein gel analysis. The (13)C NMR results defined and quantified the carbon contributions in the insoluble ECM, including carbonyls, aromatic carbons, polysaccharide carbons (anomeric and nonanomerics), aliphatics, etc. Additional (15)N and (31)P NMR spectra permitted more specific annotation of the carbon pools according to C-N and C-P couplings. Together these data show that the A. fumigatus ECM produced under these growth conditions contains approximately 40% protein, 43% polysaccharide, 3% aromatic-containing components, and up to 14% lipid. These fundamental chemical parameters are needed to consider the relationships between composition and function in the A. fumigatus ECM and will enable future comparisons with other organisms and with A. fumigatus grown under alternate conditions.
Copyright © 2015, American Society for Microbiology. All Rights Reserved.
Figures


Similar articles
-
Integration of electron microscopy and solid-state NMR analysis for new views and compositional parameters of Aspergillus fumigatus biofilms.Med Mycol. 2019 Apr 1;57(Supplement_2):S239-S244. doi: 10.1093/mmy/myy140. Med Mycol. 2019. PMID: 30816969 Review.
-
Analysis and description of the stages of Aspergillus fumigatus biofilm formation using scanning electron microscopy.BMC Microbiol. 2016 Oct 18;16(1):243. doi: 10.1186/s12866-016-0859-4. BMC Microbiol. 2016. PMID: 27756222 Free PMC article.
-
Elastin increases biofilm and extracellular matrix production of Aspergillus fumigatus.Braz J Microbiol. 2018 Jul-Sep;49(3):675-682. doi: 10.1016/j.bjm.2017.10.004. Epub 2018 Feb 13. Braz J Microbiol. 2018. PMID: 29452851 Free PMC article.
-
Filamentous fungal biofilms: Conserved and unique aspects of extracellular matrix composition, mechanisms of drug resistance and regulatory networks in Aspergillus fumigatus.NPJ Biofilms Microbiomes. 2022 Oct 19;8(1):83. doi: 10.1038/s41522-022-00347-3. NPJ Biofilms Microbiomes. 2022. PMID: 36261442 Free PMC article. Review.
-
In vivo biofilm composition of Aspergillus fumigatus.Cell Microbiol. 2010 Mar;12(3):405-10. doi: 10.1111/j.1462-5822.2009.01409.x. Epub 2009 Nov 4. Cell Microbiol. 2010. PMID: 19889082
Cited by
-
CPMAS NMR platform for direct compositional analysis of mycobacterial cell-wall complexes and whole cells.J Magn Reson Open. 2023 Dec;16-17:100127. doi: 10.1016/j.jmro.2023.100127. Epub 2023 Jul 9. J Magn Reson Open. 2023. PMID: 38125335 Free PMC article.
-
Interactions between Bacteria and Aspergillus fumigatus in Airways: From the Mycobiome to Molecular Interactions.J Fungi (Basel). 2023 Sep 1;9(9):900. doi: 10.3390/jof9090900. J Fungi (Basel). 2023. PMID: 37755008 Free PMC article. Review.
-
Biotechnological applications of biofilms formed by osmotolerant and halotolerant yeasts.Appl Microbiol Biotechnol. 2023 Jul;107(14):4409-4427. doi: 10.1007/s00253-023-12589-y. Epub 2023 May 26. Appl Microbiol Biotechnol. 2023. PMID: 37233754 Review.
-
Live imaging and quantitative analysis of Aspergillus fumigatus growth and morphology during inter-microbial interaction with Pseudomonas aeruginosa.Virulence. 2020 Dec;11(1):1329-1336. doi: 10.1080/21505594.2020.1827885. Virulence. 2020. PMID: 33017225 Free PMC article.
-
Tailoring NMR experiments for structural characterization of amorphous biological solids: A practical guide.Solid State Nucl Magn Reson. 2020 Oct;109:101686. doi: 10.1016/j.ssnmr.2020.101686. Epub 2020 Aug 27. Solid State Nucl Magn Reson. 2020. PMID: 32896783 Free PMC article. Review.
References
-
- Rosenblatt WB, Pollock A. 1997. Aspergillus flavus cultured from a saline-filled implant. Plast Reconstr Surg 99:1470–1472. - PubMed
Publication types
MeSH terms
Substances
Grants and funding
LinkOut - more resources
Full Text Sources
Miscellaneous
