. 2015 Jul;27(7):1857-74.
doi: 10.1105/tpc.15.00248. Epub 2015 Jul 10.

Genome-Wide Association Mapping of Fertility Reduction upon Heat Stress Reveals Developmental Stage-Specific QTLs in Arabidopsis thaliana

Affiliations

Genome-Wide Association Mapping of Fertility Reduction upon Heat Stress Reveals Developmental Stage-Specific QTLs in Arabidopsis thaliana

Johanna A Bac-Molenaar et al. Plant Cell. 2015 Jul.

Abstract

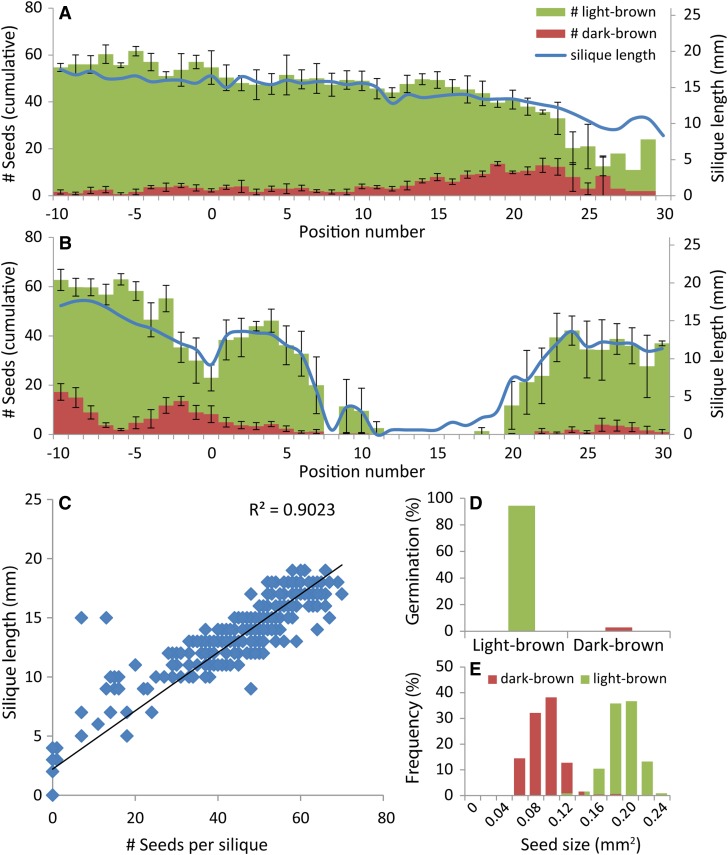
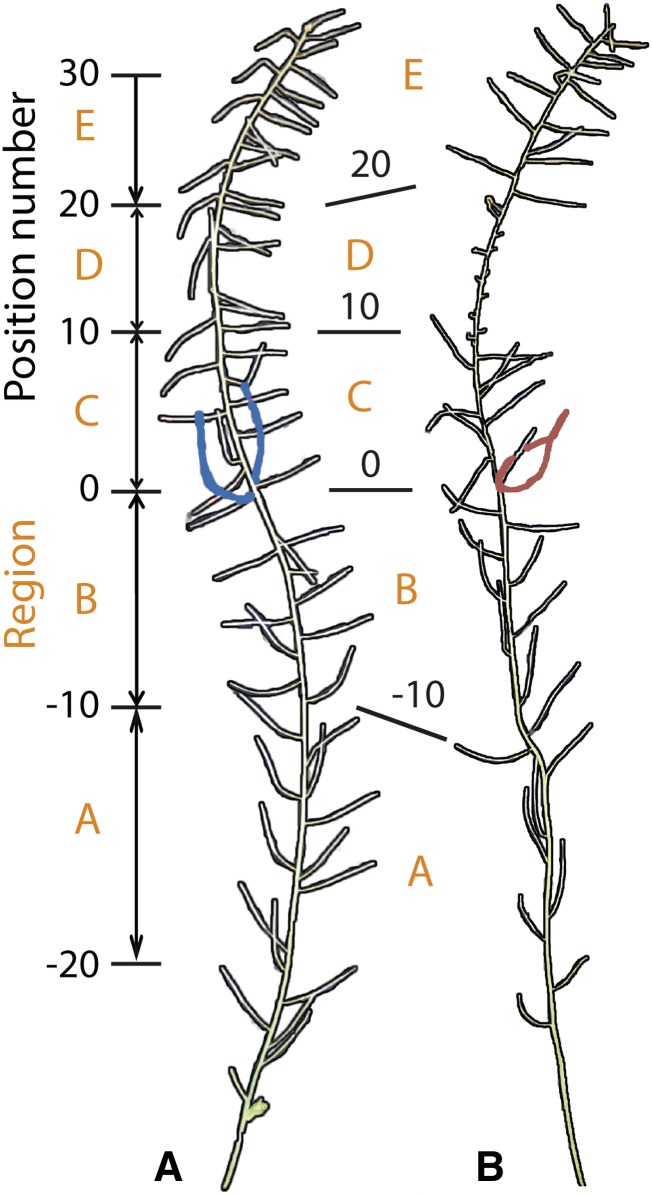
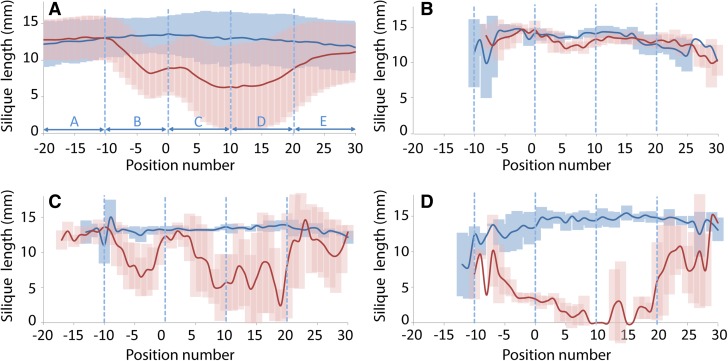
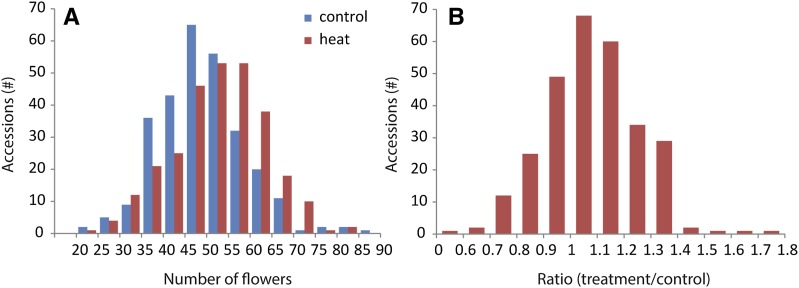
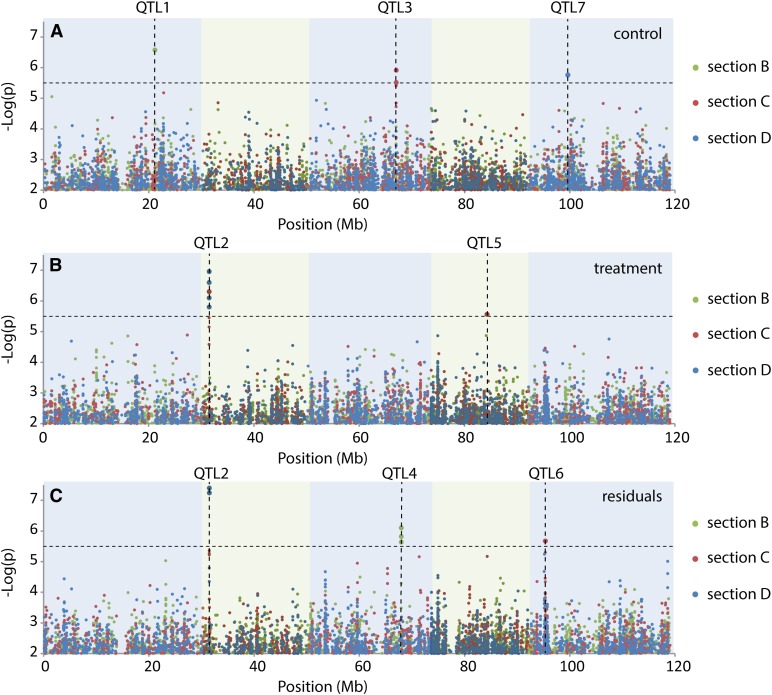
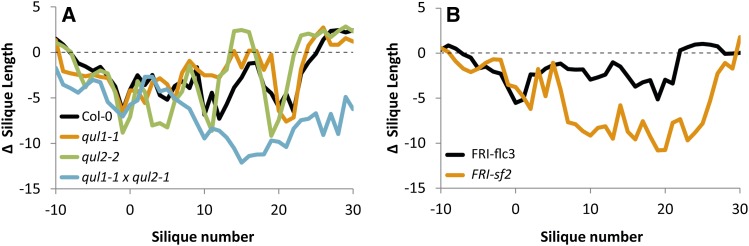
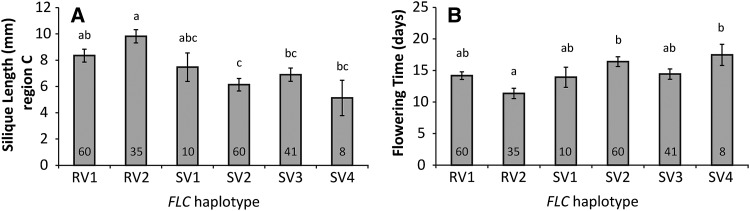
For crops that are grown for their fruits or seeds, elevated temperatures that occur during flowering and seed or fruit set have a stronger effect on yield than high temperatures during the vegetative stage. Even short-term exposure to heat can have a large impact on yield. In this study, we used Arabidopsis thaliana to study the effect of short-term heat exposure on flower and seed development. The impact of a single hot day (35°C) was determined in more than 250 natural accessions by measuring the lengths of the siliques along the main inflorescence. Two sensitive developmental stages were identified, one before anthesis, during male and female meiosis, and one after anthesis, during fertilization and early embryo development. In addition, we observed a correlation between flowering time and heat tolerance. Genome-wide association mapping revealed four quantitative trait loci (QTLs) strongly associated with the heat response. These QTLs were developmental stage specific, as different QTLs were detected before and after anthesis. For a number of QTLs, T-DNA insertion knockout lines could validate assigned candidate genes. Our findings show that the regulation of complex traits can be highly dependent on the developmental timing.


Figures

Figure 1.
Figure 1.
Silique Length, Seed Number, and Seed Size per Silique along the Main Inflorescence of Di-1 Plants and Germination Rates of the Seeds. (A) and (B) Comparison of silique length and number of seeds (light and dark brown) in control (n = 3 for seed size; n = 5 for silique length) and heat-treated (n = 5) conditions ([A] and [B], respectively). Error bars represent sd. Position numbers are relative to the flower that opened first at the day of the treatment, which received position number 0. (C) Linear correlation between silique length and number of seeds per silique based on data represented in (A) and (B). (D) Germination rate of light-brown (n = 213) and dark-brown (n = 244) seeds of heat-treated plants. (E) Size distribution of light-brown (n = 575) and dark-brown (n = 526) seeds of heat-treated plants.
Figure 2.
Figure 2.
Outline of Main Inflorescence. Outline of photographed inflorescences of a representative susceptible accession grown in control (A) and heat-treated (B) conditions. Definition of position number and developmental regions; the silique bearing the tag originated from the flower that opened first at the day of the treatment. Position numbers are relative to the tag. Five regions (A to E) were defined each containing ten siliques and representing different developmental stages as indicated in Table 1.
Figure 3.
Figure 3.
Silique Length along the Main Inflorescences of Control (Blue) and Heat-Treated (Red) Plants (Mean ± sd). (A) Overall average of all plants in the experiment. (B) Representative tolerant accession, C24. (C) Representative moderately sensitive accession, Rmx-A180. (D) Representative extremely sensitive accession, Arby-1. (B) to (D) Control, n = 3; treatment, n = 5. Bars indicate the sd of silique lengths among replicates, and solid lines indicate mean values.
Figure 4.
Figure 4.
Comparison of Total Number and Ratio of Flowers along the Main Inflorescence in Control and Heat-Treated Plants for All Accessions. (A) Frequency distribution of the total number of flowers per main inflorescence averaged per accession. (B) Frequency distribution of the ratio between the numbers of flowers along the main inflorescence in heat treated and control conditions per accession.
Figure 5.
Figure 5.
Manhattan Plots Representing the Associations between SNP Markers and Silique Length in the Regions B, C, and D. (A) GWA mapping of silique length in control plants. (B) GWA mapping of silique length in heat-treated plants. (C) GWA mapping of residuals, representing heat response independent of silique length in control conditions. Dotted line represents the significance threshold of –log(P value) = 5.5.
Figure 6.
Figure 6.
Mutant Analyses. Difference between silique length of heat-stressed and control plants (average silique length of heat stress plants minus average silique length of control plants) of Col-0 wild type and the single and double knockdown mutant lines of QUL1 and QUL2 (A), and of isogenic lines with FRI strong allele and FLC null allele (early flowering, FRI-flc3) or FLC functional allele (late flowering, FRI-sf2) (B). Results of one experiment are shown. Results of a second independent experiment can be found in Supplemental Data Set 3.
Figure 7.
Figure 7.
Comparison of Silique Length and Flowering Time of Different FLC Haplotypes. (A) Length of siliques (average ± se) in region C upon heat stress. (B) Flowering time (average ± se ) after 10 weeks of vernalization for accessions of the six most common FLC haplotypes (P. Li et al., 2014). Numbers in the bars indicate the number of accessions belonging to the haplotype indicated below the bar; Col-0 belongs to the RV2 haplotype. Significant differences (P < 0.05), as indicated by letters above the bars, are determined by one-way ANOVA with Bonferroni correction for multiple testing.

Comment in

References

    1. Alonso J.M., Stepanova A.N., Leisse T.J., Kim C.J., Chen H., Shinn P., Stevenson D.K., Zimmerman J., Barajas P., Cheuk R. (2003). Genome-wide insertional mutagenesis of Arabidopsis thaliana. Science 301: 653–657. - PubMed
    1. Alonso-Blanco C., Blankestijn-de Vries H., Hanhart C.J., Koornneef M. (1999). Natural allelic variation at seed size loci in relation to other life history traits of Arabidopsis thaliana. Proc. Natl. Acad. Sci. USA 96: 4710–4717. - PMC - PubMed
    1. Al-Whaibi, M.H. (2011). Plant heat-shock proteins: A mini review. J. King Saud Univ. Sci. 23: 139–150.
    1. Angadi S.V., Cutforth H.W., McConkey B.G., Gan Y. (2003). Yield adjustment by canola grown at different plant populations under semiarid conditions. Crop Sci. 43: 1358–1366.
    1. Angadi S.V., Cutforth H.W., Miller P.R., McConkey B.G., Entz M.H., Brandt S.A., Volkmar K.M. (2000). Response of three Brassica species to high temperature stress during reproductive growth. Can. J. Plant Sci. 80: 693–701.

Publication types

MeSH terms

LinkOut - more resources