. 2015 Aug 15;195(4):1470-9.
doi: 10.4049/jimmunol.1401587. Epub 2015 Jul 10.

mir-181a-1/b-1 Modulates Tolerance through Opposing Activities in Selection and Peripheral T Cell Function

Affiliations

mir-181a-1/b-1 Modulates Tolerance through Opposing Activities in Selection and Peripheral T Cell Function

Steven A Schaffert et al. J Immunol. .

Abstract

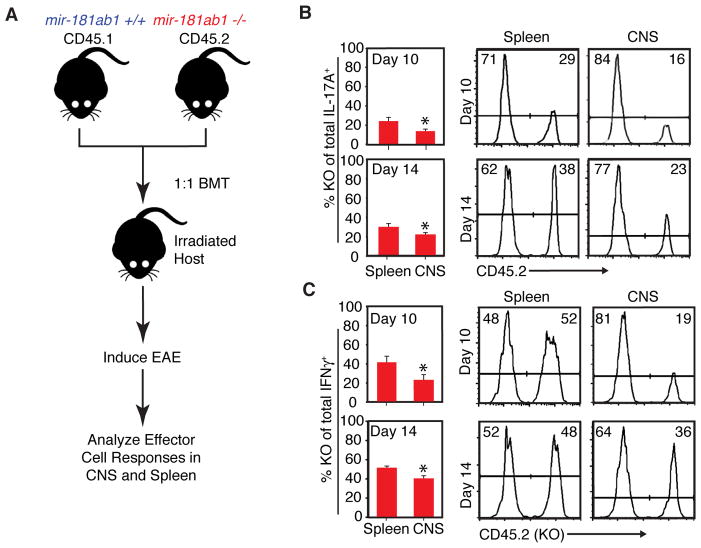
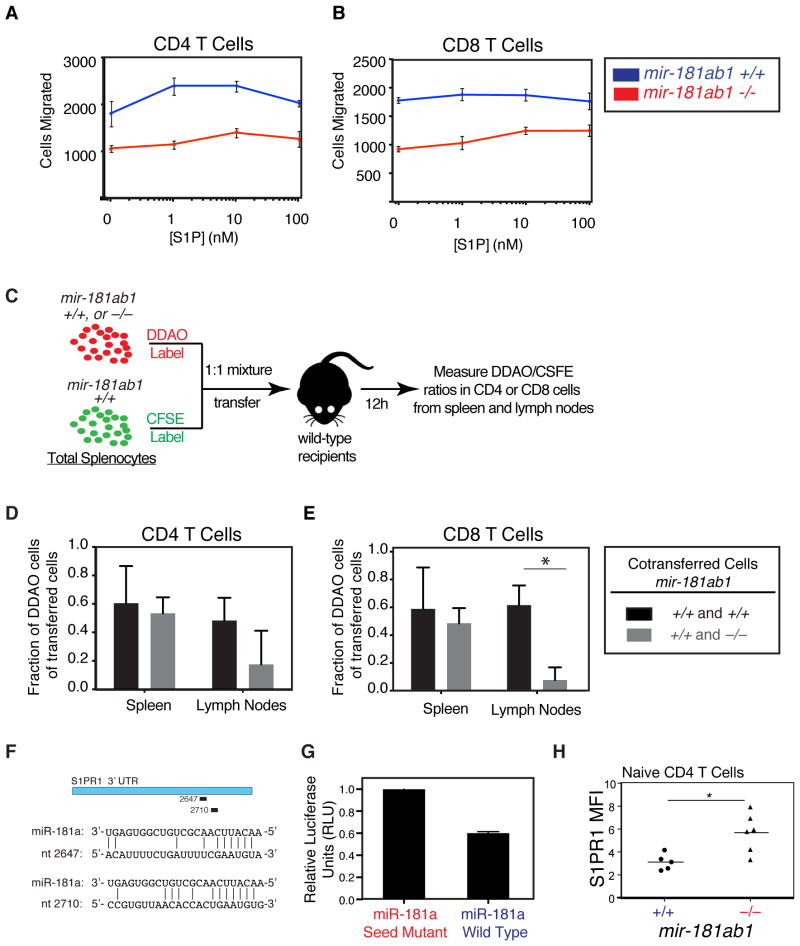
Understanding the consequences of tuning TCR signaling on selection, peripheral T cell function, and tolerance in the context of native TCR repertoires may provide insight into the physiological control of tolerance. In this study, we show that genetic ablation of a natural tuner of TCR signaling, mir-181a-1/b-1, in double-positive thymocytes dampened TCR and Erk signaling and increased the threshold of positive selection. Whereas mir-181a-1/b-1 deletion in mice resulted in an increase in the intrinsic reactivity of naive T cells to self-antigens, it did not cause spontaneous autoimmunity. Loss of mir-181a-1/b-1 dampened the induction of experimental autoimmune encephalomyelitis and reduced basal TCR signaling in peripheral T cells and their migration from lymph nodes to pathogenic sites. Taken together, these results demonstrate that tolerance can be modulated by microRNA gene products through the control of opposing activities in T cell selection and peripheral T cell function.


Figures

Figure 1
Figure 1. miR-181a expression and function in DP thymocytes
(A) Differential regulation of miR-181a expression during positive and negative selection. miR-181a expression in DP subsets, fractionated based on their sizes (small vs. blast) and activation status (CD69 expression), was determined by qPCR (n>4, error bars are standard deviation, * indicates p < 0.05, unpaired t-test). (B) miR-181a expression levels (copies/cell) in thymocytes with or without mir-181a-1/b-1 were determined by qPCR (n>4, error bars are standard deviation, * indicates p < 0.05, unpaired t-test). (C) Effects of mir-181a-1/b-1 deletion on the levels of DUSP6 and PTEN in thymocytes as determined by western blot. (D & E) Effects of mir-181a-1/b-1 deletion on the levels of (D) pErk and (E) pAkt in thymocytes as determined by intracellular flow cytometry analyses.
Figure 2
Figure 2. Effects of mir-181a-1/b-1 deletion on calcium flux
(A & B) Total calcium flux (integrated area under the curve) for indicated T cell subsets analyzed (A) after and (B) before stimulation. (C) Maximum calcium flux in T cell subsets following stimulation. (D) The rates of calcium flux in DP thymocytes with and without mir-181a-1/b-1. A representative plot is shown. (E) Representative calcium flux profile in indicated T cell subsets. Thymocytes and splenocytes from mir-181a-1/b-1-knockout and wild-type mice were fluorescently labeled and combined, loaded with Indo-1 calcium-sensitive fluorescent dye, and stimulated by adding anti-CD3 followed by crosslinking. Calcium flux as indicated by Indo-1–400 nm/475 nm ratio was assessed by flow cytometry before and after stimulation (n=5; unpaired t-test; **, p < 0.01, ***, p < 0.001).
Figure 3
Figure 3. Effects of mir-181a-1/b-1 deletion on selection of HY T cells
(A) Representative FACS plots of CD4 and CD8 expression on thymocytes in wild-type, heterozygous, and knockout male and female mice. (B) The effects of mir-181a-1/b-1 deletion on the percentage of total DP, total CD8SP, HY TCR+ DP, and HY TCR+ CD8SP in total thymocytes (t-test, significant p value indicated). (C & D) HY TCR transgenic thymocytes with wild-type, heterozygous, null mir-181a-1/b-1 alleles were analyzed for (C) HY TCR expression and (D) expression of positive selection markers CD5 and CD69 in HY TCR transgenic thymocytes with wild-type, heterozygous, null mir-181a-1/b-1 alleles were analyzed (n ≥ 3). Representative plots are shown.
Figure 4
Figure 4. Effects of loss of mir-181a-1/b-1 on the frequency of naive T cells recognizing HY and MOG self-antigens in naïve or immunized mice
(A) Gating scheme used to identify HY and MOG-tetramer-positive cells. (B–G) The activation status (CD44) and the total number of antigen-specific T cells per spleen in naïve or immunized were determined by tetramer staining and FACS analyses. (B) The activation status and (C) the total numbers of HY-tetramer positive CD8 T cells in naïve mice. (D) The activation status and (E) the total numbers of MOG-tetramer-positive CD4 T cells in naïve mice. (F) The activation status and (E) the total numbers of MOG-tetramer-positive CD4 T cells at day 10 following MOG immunization. Each data point in panels C, E, and G represents pooled cells from three mice (unpaired t-test; *, p < 0.05; n.s. for not significant).
Figure 5
Figure 5. mir-181a-1/b-1-knockout mice exhibit a delay in EAE induction
(A) Disease progression of mir-181a-1/b-1-knockout vs. wild-type mice (error bars are SEM; *, p < 0.05, unpaired t-test, n = 10 per group). The representative plot of three independent experiments is shown. (B) Percent of disease-free mice (score of 0) in wild-type and mir-181a-1/b-1-knockout mice at various time points after EAE induction (p = 0.0066, Gehan-Breslow-Wilcoxon Test, n = 10 per group). (C) Histological analyses of CNS inflammation. Brains and spinal cords were collected from mice 11 days after EAE induction. Spinal cord sections were stained with hematoxylin and eosin. Representative sections from 2 or 3 mice are shown. (D & E) Brain and spinal cord infiltrated immune cells were isolated from mice immunized with MOG35-55 peptide at day 10 post-immunization. (D) Effects of loss of mir-181a-1/b-1 on MOG-tetramer-positive CD4 T cells and control CLIP-tetramer-positive CD4 T cells in the CNS of EAE mice. (E) Effects of mir-181a-1/b-1 deletion on Th1 and Th17 responses in spleen and CNS of EAE mice. Representative plots from three independent experiments are shown.
Figure 6
Figure 6. Effects of loss of mir-181a-1/b-1 on effector T cell responses during EAE onset dissected
(A) EAE was induced in bone marrow chimeras generated by transferring equal numbers of mir-181a-1/b-1-knockout (CD45.2) and wild-type (CD45.1) cells into lethally irradiated hosts. At indicated time points, cells were obtained from spleens, brains, and spinal cords, stimulated with PMA and ionomycin and then stained for IFN-γ and IL-17A to determine effector cell phenotype in a competitive environment. (B & C) Bar graphs depicting percent mir-181a-1/b-1-knockout cells (CD45.2+) out of (B) total IL-17A+ or (C) total IFN-γ+ CD4 T cells in spleen and CNS at day 10 and 14 after EAE induction (t-test, *, p<0.05, representative results of two independent repeats). Representative histograms of Th1 and Th17 cells in the spleen and CNS of chimeras are shown on right.
Figure 7
Figure 7. Effects of loss of mir-181a-1/b-1 on chemotaxis to sphingosine-1-phosphate
(A–B) Splenocytes from mir-181a-1/b-1-knockout and wild-type mice were placed in transwells above varying concentrations of S1P and allowed to migrate for 3 h at 37 °C. Migrated CD4 and CD8 T cells were counted by flow cytometry. Number of (A) CD4 and (B) CD8 T cells migrated after 3 h in response to various concentrations of S1P (error bars are SD; *, p < 0.05, unpaired t-test). (C) Schematic depicting in vivo migration assay. CFSE-labeled splenocytes from wild-type mice were mixed at a 1:1 ratio with DDAO-labeled wild-type or mir-181a-1/b-1-knockout splenocytes and co-transferred into wild-type recipients. Spleens and lymph nodes were collected 12 hours after transfer and the percentages of DDAO-labeled cells in total transferred (D) CD4 and (E) CD8 T cells in spleens and lymph nodes were measured (bars are SD). (F) Putative miR-181a recognition sites in S1PR1 3′ UTR and base pairings with miR-181a as predicted by miRanda (positions are relative to start of 3′ UTR). (G) Relative luciferase levels in the presence of miR-181a or miR-181a seed-mutant. The S1PR1 3′ UTR was cloned into a luciferase reporter construct and co-transfected into BOSC cells with miR-181a wild-type and seed-mutant controls. Units were normalized to an internal Renilla luciferase control and to seed-mutant control (bars are SD).
Figure 8
Figure 8. Antagomir inhibition of miR-181a dampens EAE induction
Wild-type mice were immunized with 100 μg MOG in CFA to induce EAE and treated on days 1 and 3 post-immunization with either 80 mg/kg miR-181a antagomir or saline control. Mice were scored daily for clinical signs of EAE (n=10 for each group). A representative plot from three independent experiments is shown.

Similar articles

Cited by

References

    1. Davis MM, Bjorkman PJ. T-cell antigen receptor genes and T-cell recognition. 1988;334:395–402. - PubMed
    1. Sultana DA, Bell JJ, Zlotoff DA, De Obaldia ME, Bhandoola A. Eliciting the T cell fate with Notch. Semin Immunol. 2010;22:254–260. - PMC - PubMed
    1. Hogquist KA, Baldwin TA, Jameson SC. Central tolerance: learning self-control in the thymus. 2005;5:772–782. - PubMed
    1. Starr TK, Jameson SC, Hogquist KA. Positive and negative selection of T cells. Annu Rev Immunol. 2003;21:139–176. - PubMed
    1. Lo W-L, Allen PM. Self-Peptides in TCR Repertoire Selection and Peripheral T Cell Function. Current topics in microbiology and immunology 2013 - PubMed

Publication types

MeSH terms