. 2015 Jul 10;7(8):2276-88.
doi: 10.1093/gbe/evv132.

Evolutionary Divergence of Gene and Protein Expression in the Brains of Humans and Chimpanzees

Affiliations

Evolutionary Divergence of Gene and Protein Expression in the Brains of Humans and Chimpanzees

Amy L Bauernfeind et al. Genome Biol Evol. .

Abstract

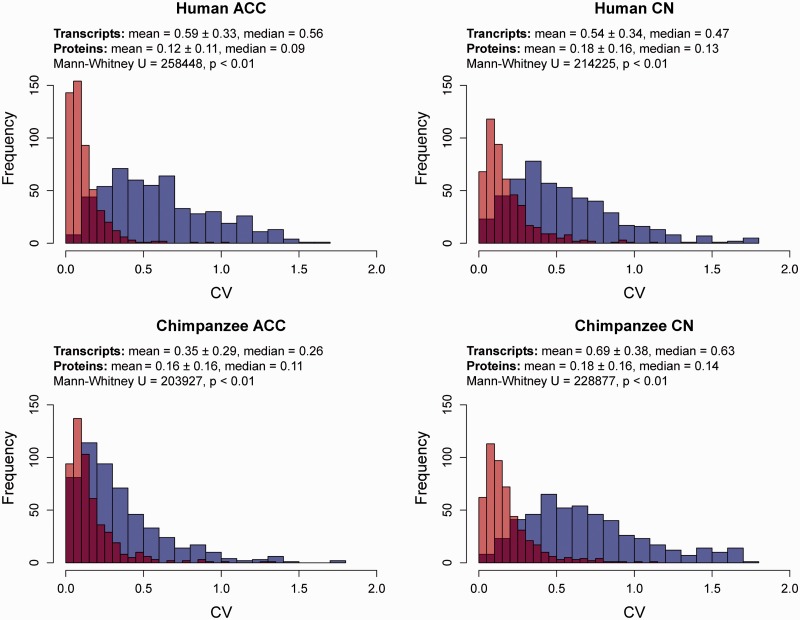
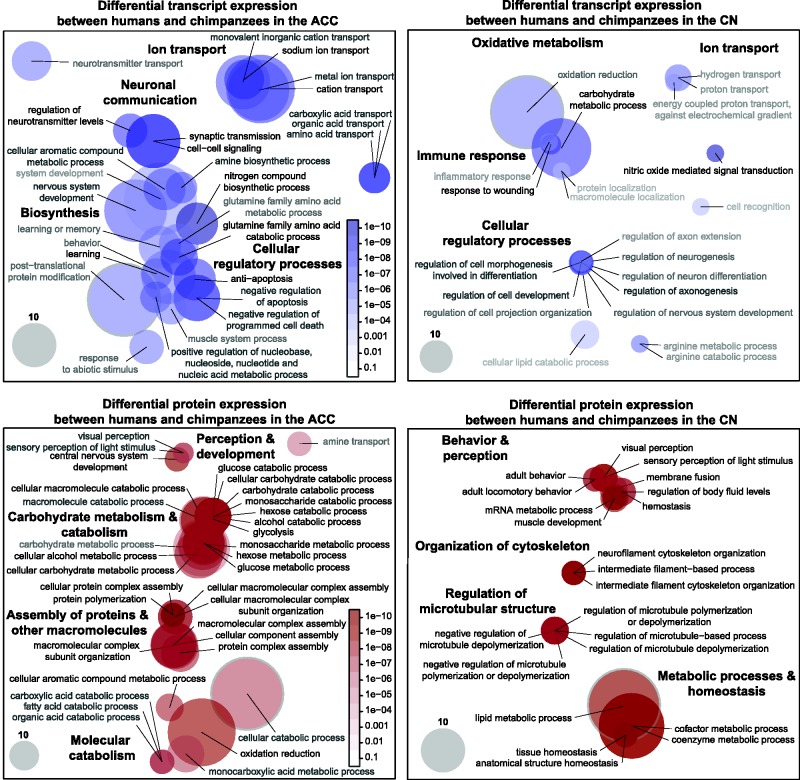
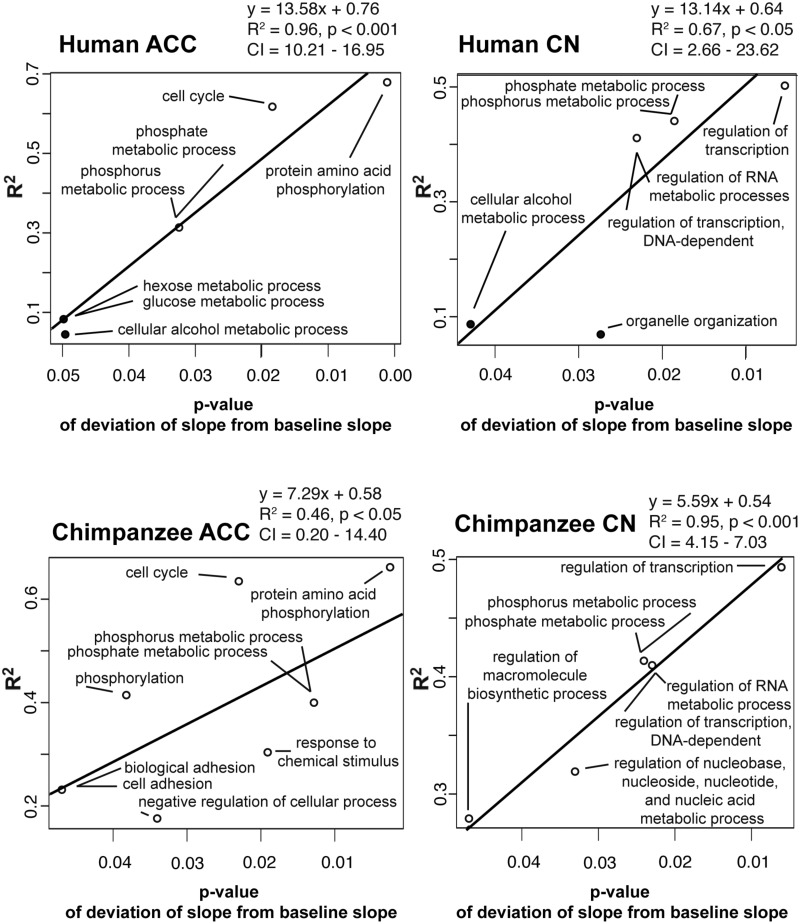
Although transcriptomic profiling has become the standard approach for exploring molecular differences in the primate brain, very little is known about how the expression levels of gene transcripts relate to downstream protein abundance. Moreover, it is unknown whether the relationship changes depending on the brain region or species under investigation. We performed high-throughput transcriptomic (RNA-Seq) and proteomic (liquid chromatography coupled with tandem mass spectrometry) analyses on two regions of the human and chimpanzee brain: The anterior cingulate cortex and caudate nucleus. In both brain regions, we found a lower correlation between mRNA and protein expression levels in humans and chimpanzees than has been reported for other tissues and cell types, suggesting that the brain may engage extensive tissue-specific regulation affecting protein abundance. In both species, only a few categories of biological function exhibited strong correlations between mRNA and protein expression levels. These categories included oxidative metabolism and protein synthesis and modification, indicating that the expression levels of mRNA transcripts supporting these biological functions are more predictive of protein expression compared with other functional categories. More generally, however, the two measures of molecular expression provided strikingly divergent perspectives into differential expression between human and chimpanzee brains: mRNA comparisons revealed significant differences in neuronal communication, ion transport, and regulatory processes, whereas protein comparisons indicated differences in perception and cognition, metabolic processes, and organization of the cytoskeleton. Our results highlight the importance of examining protein expression in evolutionary analyses and call for a more thorough understanding of tissue-specific protein expression levels.

Keywords: RNA-Seq; chimpanzee; human brain evolution; proteome; transcriptome.


Figures

F<sc>ig</sc>. 1.—
Fig. 1.—
The frequency bar graphs of interindividual CVs for transcript (blue) and protein (red) expression in ACC and CN in humans and chimpanzees using the paired data sets. The overlap between these two distributions appears as a darker (purplish) color. The results of Mann–Whitney tests comparing the central tendencies of transcript and protein expression are provided.
F<sc>ig</sc>. 2.—
Fig. 2.—
DE gene transcripts and protein products between humans and chimpanzees in GO categories of biological function for the paired data set. The DE categories of transcripts (upper row) are depicted by blue circles for the ACC (upper left) and CN (upper right). The DE categories of proteins (lower row) are depicted by red circles for the ACC (lower left) and CN (lower right). The circles represent categories of biological function, which contain gene transcripts that are DE between the two species. The size of the circle represents the number of genes with a q value below the maximum threshold (the gray circles in the bottom left corners provide a guide). The darkness of the circle represents the level of significance (as indicated by the scales, which are the same for both ACC and CN). Aside from the degree of overlap of functional categories, the arrangement of the circles has no meaning. The minimum thresholds are different for genes (in ACC, minimum of five genes per category, q ≤ 0.05; in CN, minimum of three genes per category, q ≤ 0.05) and proteins (in ACC, minimum of five proteins per category, q ≤ 0.05; in CN minimum of three proteins per category, q ≤ 0.05).
F<sc>ig</sc>. 3.—
Fig. 3.—
Linear regressions of the R2 and P values of the GO categories of biological function that were significantly different from their baseline slopes. GO biological categories (n ≥ 10 gene transcript–protein product pairs) that were significantly different (P ≤ 0.05) from the local transcript and protein expression baseline slopes (human ACC β = 0.16, CN β = 0.15; chimpanzee ACC β = 0.17, CN β = 0.14) are plotted with their R2 values against their P value for both regions of interest in humans and chimpanzees. White circles mean that the biological category had a greater slope than the baseline slope, whereas black circles represent a negative slope. The relationship among the points is found by OLS.

Similar articles

Cited by

References

    1. Battle A, et al. 2015. Impact of regulatory variation from RNA to protein. Science 347:6222. - PMC - PubMed
    1. Berezikov E, et al. 2006. Diversity of microRNAs in human and chimpanzee brain. Nat Genet. 38:1375-1377. - PubMed
    1. Bernard A, et al. 2012. Transcriptional architecture of the primate neocortex. Neuron 73:1083-1099. - PMC - PubMed
    1. Blekhman R, Marioni JC, Zumbo P, Stephens M, Gilad Y. 2010. Sex-specific and lineage-specific alternative splicing in primates. Genome Res. 20:180-189. - PMC - PubMed
    1. Bustamante CD, et al. 2005. Natural selection on protein-coding genes in the human genome. Nature 437:1153-1157. - PubMed

Publication types