. 2015 Oct;66(20):6281-96.
doi: 10.1093/jxb/erv340. Epub 2015 Jul 10.

Whole-cell response to nitrogen deprivation in the diatom Phaeodactylum tricornutum

Affiliations

Whole-cell response to nitrogen deprivation in the diatom Phaeodactylum tricornutum

Leila Alipanah et al. J Exp Bot. 2015 Oct.

Abstract

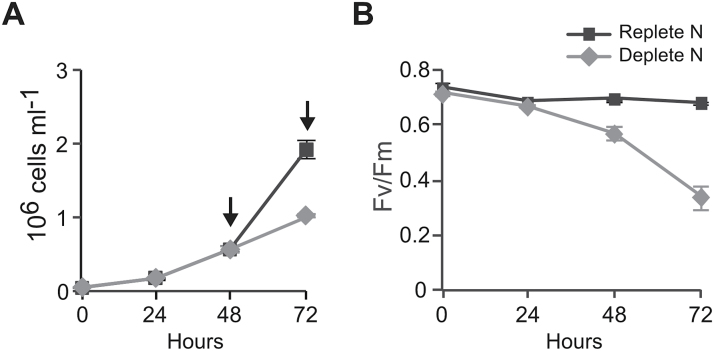
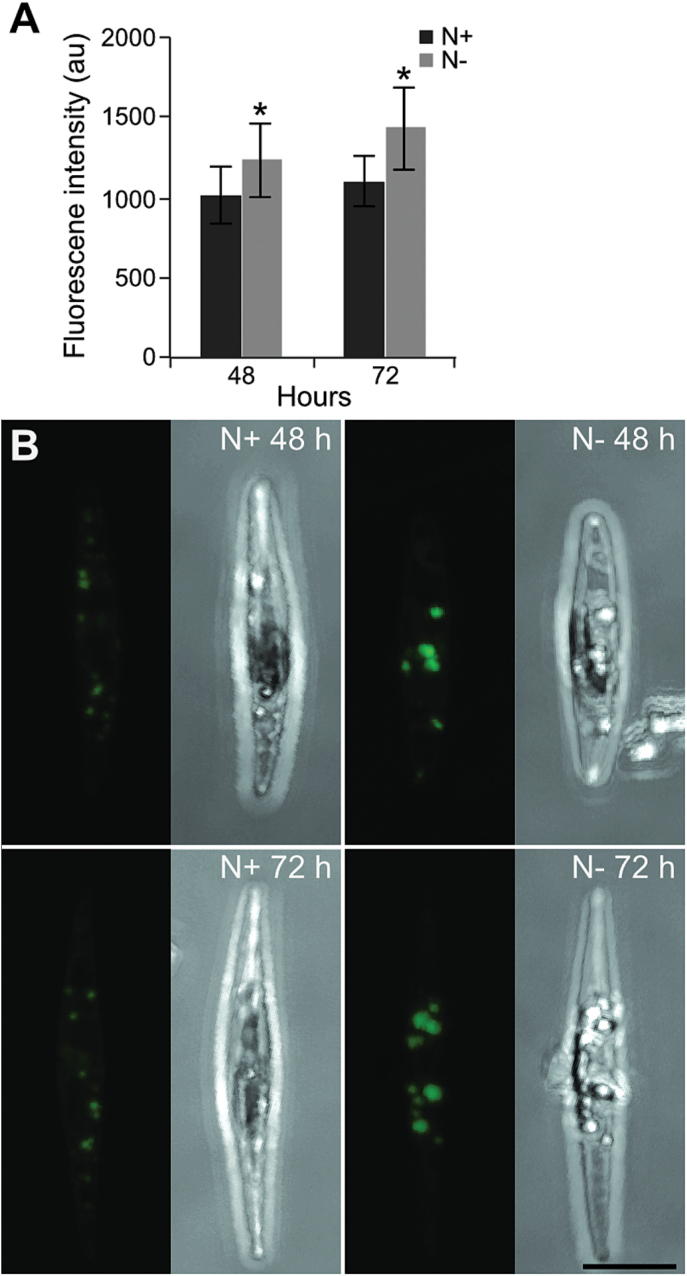
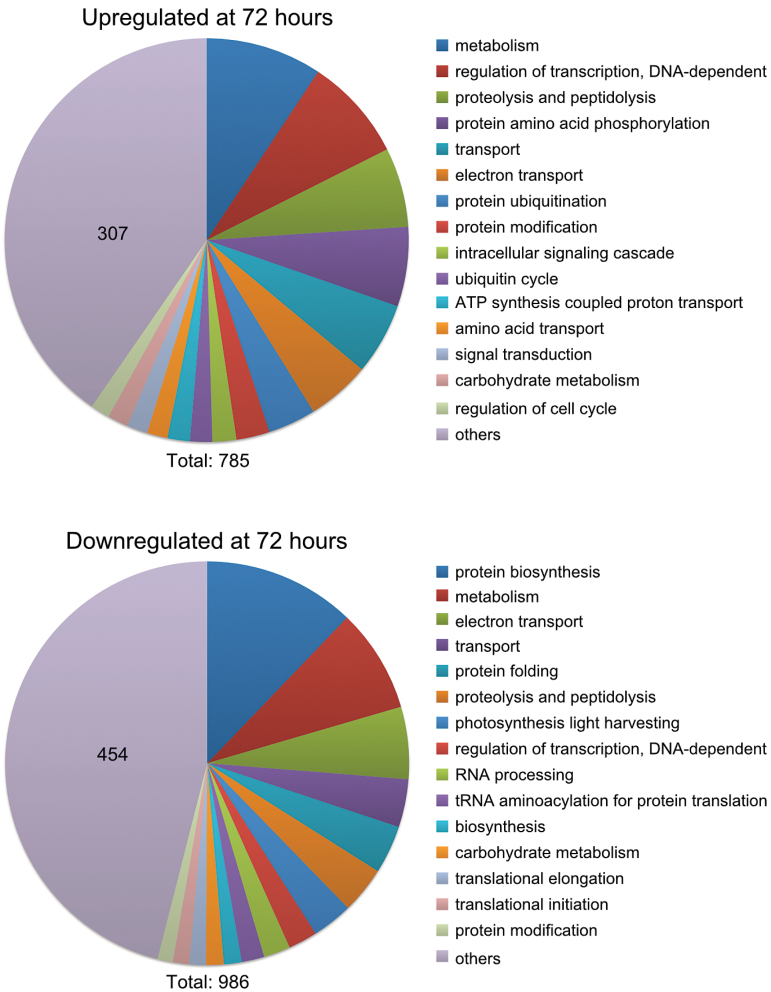
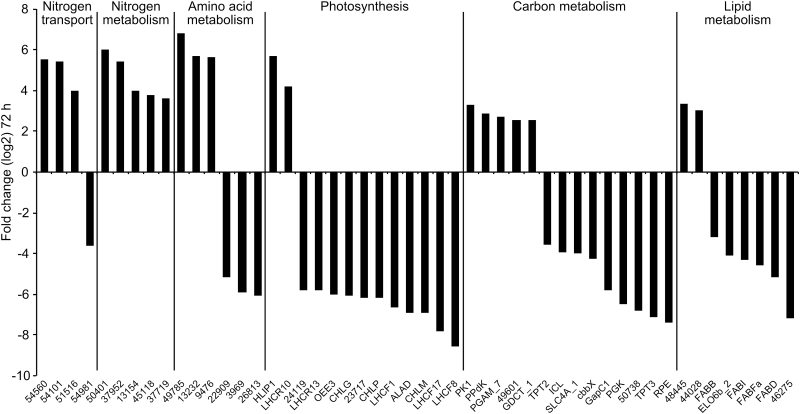
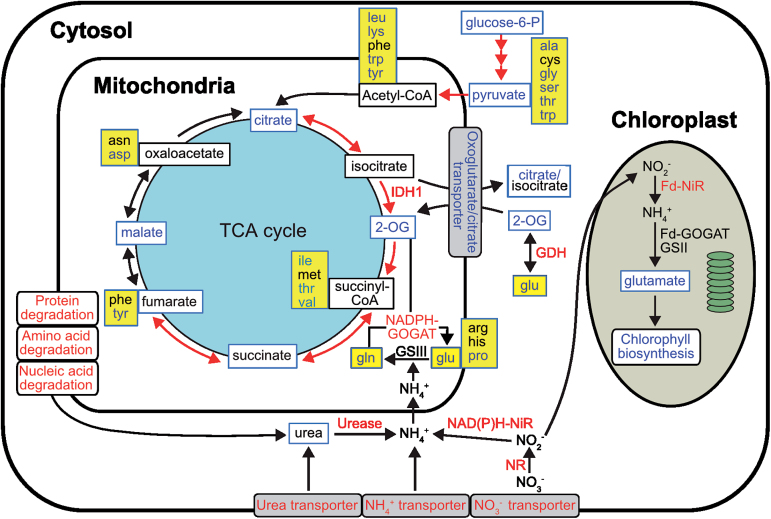
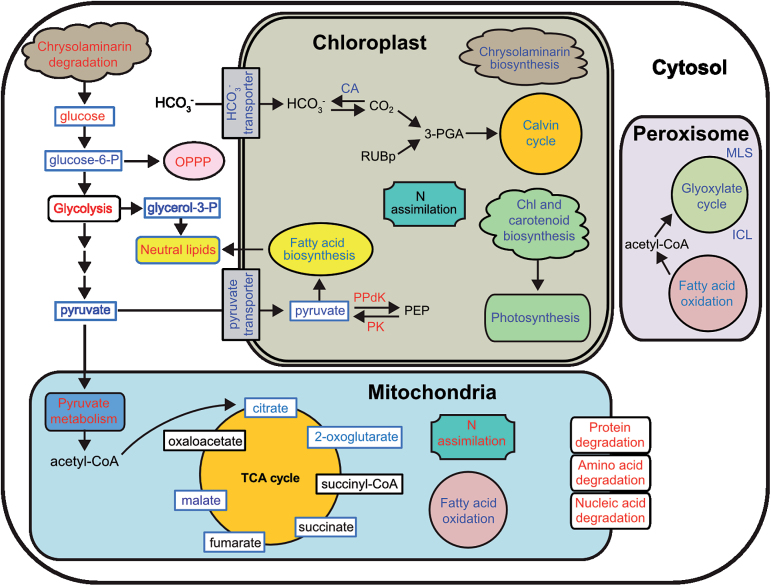
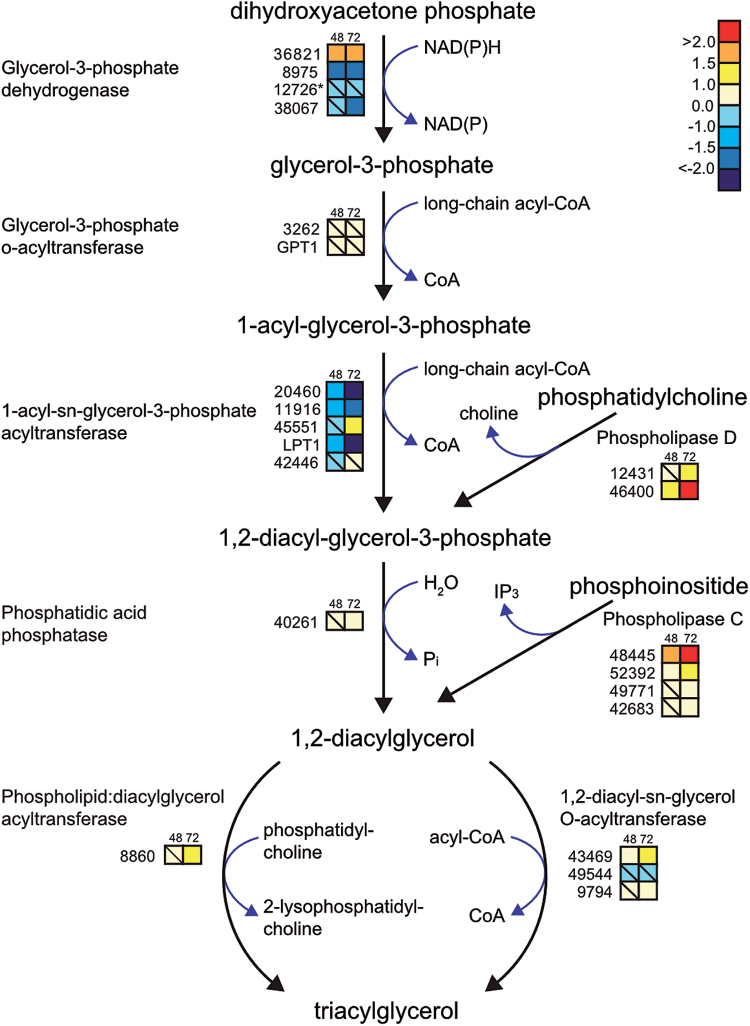
Algal growth is strongly affected by nitrogen (N) availability. Diatoms, an ecologically important group of unicellular algae, have evolved several acclimation mechanisms to cope with N deprivation. In this study, we integrated physiological data with transcriptional and metabolite data to reveal molecular and metabolic modifications in N-deprived conditions in the marine diatom Phaeodactylum tricornutum. Physiological and metabolite measurements indicated that the photosynthetic capacity and chlorophyll content of the cells decreased, while neutral lipids increased in N-deprived cultures. Global gene expression analysis showed that P. tricornutum responded to N deprivation through an increase in N transport, assimilation, and utilization of organic N resources. Following N deprivation, reduced biosynthesis and increased recycling of N compounds like amino acids, proteins, and nucleic acids was observed at the transcript level. The majority of the genes associated with photosynthesis and chlorophyll biosynthesis were also repressed. Carbon metabolism was restructured through downregulation of the Calvin cycle and chrysolaminarin biosynthesis, and co-ordinated upregulation of glycolysis, the tricarboxylic acid cycle, and pyruvate metabolism, leading to funnelling of carbon sources to lipid metabolism. Finally, reallocation of membrane lipids and induction of de novo triacylglycerol biosynthesis directed cells to accumulation of neutral lipids.

Keywords: Carbon metabolism; Phaeodactylum tricornutum; diatom; metabolomics; nitrogen deprivation; transcriptome; triacylglycerol..


Figures

Fig. 1.
Fig. 1.
Physiological responses of P. tricornutum to nitrate deprivation. Growth curves (A) and changes in maximum quantum yield (Fv/Fm) (B) of P. tricornutum in N-replete (f/2 medium) and N-deprived (f/2 medium minus nitrate) cultures. Arrows indicate sampling time points. Values are means±standard deviation of four biological replicates.
Fig. 2.
Fig. 2.
Accumulation of neutral lipids during nitrate deprivation. (A) Fluorescence intensity in P. tricornutum cells stained with BODIPY 505/515 at 48 and 72h after N deprivation. The level of lipid fluorescence was measured in 20–30 randomly selected cells using confocal microscopy. Statistical differences (*P<0.01) between nitrate-replete (N+) and nitrate deprived (N–) cultures are indicated. au, Arbitrary units. (B) Z-stack projections of P. tricornutum in N+ and N– cultures at 48 and 72h after N deprivation. Bar, 5 μm. (This figure is available in colour at JXB online.)
Fig. 3.
Fig. 3.
GO analysis of significantly regulated genes after 72h of nitrate deprivation. The dataset was divided into up- and downregulated genes and analysed for process GO terms. The 15 most frequent GO terms are listed, and the rest were combined into ‘others’. The number in the ‘others’ section indicates the number of hits within this category. The total number of GO term hits is listed below the graphs.
Fig. 4.
Fig. 4.
Genes strongly regulated by N deprivation. The genes most up- or downregulated after 72h of nitrate deprivation are shown for the processes listed at the top of the graph. The ratios were log2 transformed. Numbers indicate Phatr2 gene IDs.
Fig. 5.
Fig. 5.
Cellular pathways and processes related to N metabolism under N deprivation in P. tricornutum. Metabolites detected are indicated by a blue box frame. Red, blue, and black text indicate up-, down-, and no regulation of pathways, genes, or metabolites by N deprivation, respectively. Amino acids are indicated by a yellow background. Red arrows depict gene transcripts found to be upregulated. Fd-GOGAT, ferredoxin-dependent glutamate synthase; GSII, ferredoxin-dependent glutamine synthetase; Fd-NiR, ferredoxin-dependent nitrite reductase; GDH, glutamate dehydrogenase; GSIII, bacterial-origin glutamine synthetase; IDH, isocitrate dehydrogenase; NADPH-GOGAT, NAD(P)H-dependent glutamate synthase; NAD(P)H-NiR, NAD(P)H-dependent nitrite reductase; NR, nitrate reductase.
Fig. 6.
Fig. 6.
Cellular pathways and processes affected under N deprivation in P. tricornutum. Metabolites detected are indicated by a blue box frame. Red, blue,and black text indicates up-, down-, and no regulation of pathways, genes, or metabolites by N deprivation, respectively. 3-PGA, 3-phosphoglycerate; CA, carbonic anhydrase; ICL, isocitrate lyase; MLS, malate synthase; OPPP, oxidative pentose phosphate pathway; PEP, phosphoenolpyruvate; PK, pyruvate kinase; PPdK, pyruvate orthophosphate dikinase; RuBP, ribulose-1,5-bisphosphate.
Fig. 7.
Fig. 7.
Transcriptional changes in genes related to TAG biosynthesis in response to N deprivation. Coloured squares indicate the regulation pattern of genes encoding putative enzymes functioning in the TAG biosynthetic pathway after 48 and 72h of N deprivation, compared with N-replete cultures. Squares with a diagonal line inside indicate non-significant regulation (P>0.05). The scale on the right represents gene expression ratio values, which were log2 transformed. Numbers indicate Phatr2 gene IDs. Gene ID 12726 (marked with an asterisk) belongs to the Phatr1 database (http://genome.jgi-psf.org/Phatr1/Phatr1.home.html).

References

    1. Abràmoff MD, Magalhães PJ, Ram SJ. 2004. Image processing with ImageJ. Biophotonics International 11, 36–43.
    1. Allen AE. 2005. Beyond sequence homology: redundant ammonium transporters in a marine diatom are not functionally equivalent. Journal of Phycology 41, 4–6.
    1. Allen AE, Dupont CL, Obornik M, et al. 2011. Evolution and metabolic significance of the urea cycle in photosynthetic diatoms. Nature 473, 203–207. - PubMed
    1. Allen AE, Ward BB, Song B. 2005. Characterization of diatom (Bacillariophyceae) nitrate reductase genes and their determination in marine phytoplankton communities. Journal of Phycology 41, 95–104.
    1. Allison G, Syrett PJ. 1987. The metabolism of guanine by the diatom Phaeodactylum tricornutum Bohlin. Journal of Phycology 23, 666–668.

Publication types