. 2015 Sep;64(9):999-1004.
doi: 10.1016/j.metabol.2015.06.008. Epub 2015 Jun 16.

A transcriptional signature of "exercise resistance" in skeletal muscle of individuals with type 2 diabetes mellitus

Affiliations

A transcriptional signature of "exercise resistance" in skeletal muscle of individuals with type 2 diabetes mellitus

Natalie A Stephens et al. Metabolism. 2015 Sep.

Abstract

Aims/hypothesis: Exercise benefits most, but not all, individuals with type 2 diabetes mellitus (T2DM). The aim of this study was to determine whether a proportion of individuals with T2DM would fail to demonstrate exercise-induced metabolic improvements. We hypothesized that this lack of response would be related to their skeletal muscle transcriptional profile.

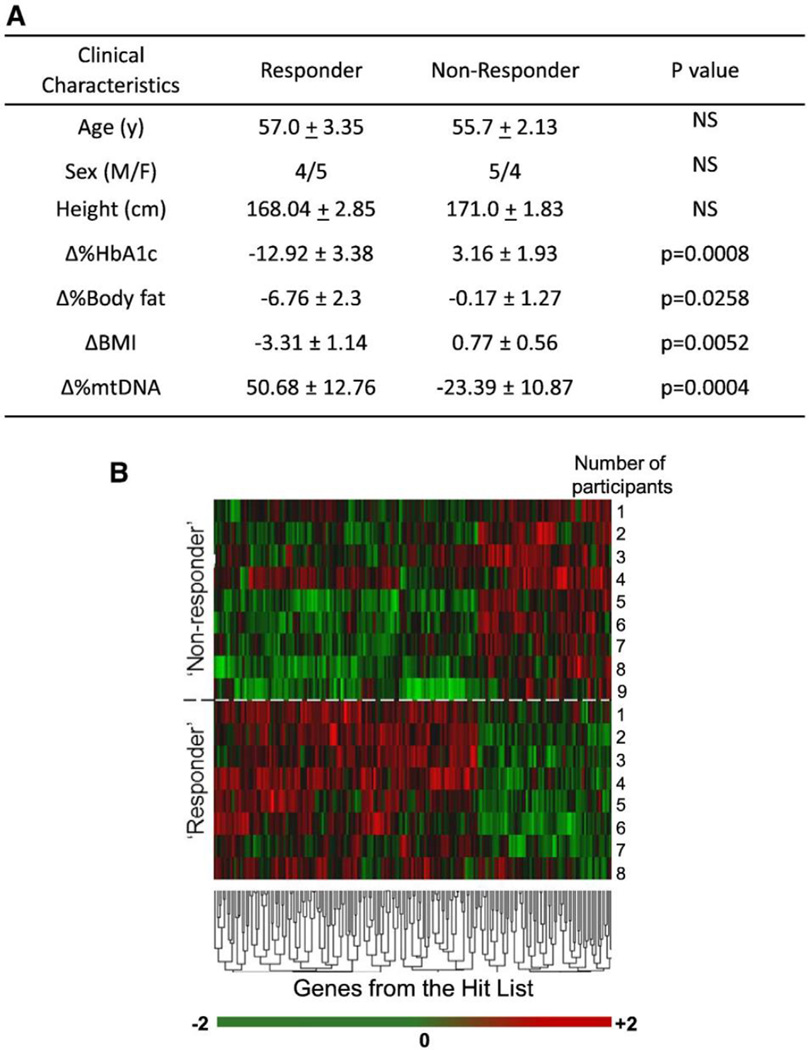
Methods: 42 participants with T2DM from the previously reported HART-D study underwent a 9-month supervised exercise intervention. We performed a principal components analysis to distinguish Responders from Non-Responders (n=9 each) based on: decreases in (1) HbA1c, (2) %fat (3) BMI and (4) increase in skeletal muscle mtDNA. mRNA expression patterns in muscle tissue at baseline were assessed by microarray and qRT-PCR analysis in both groups.

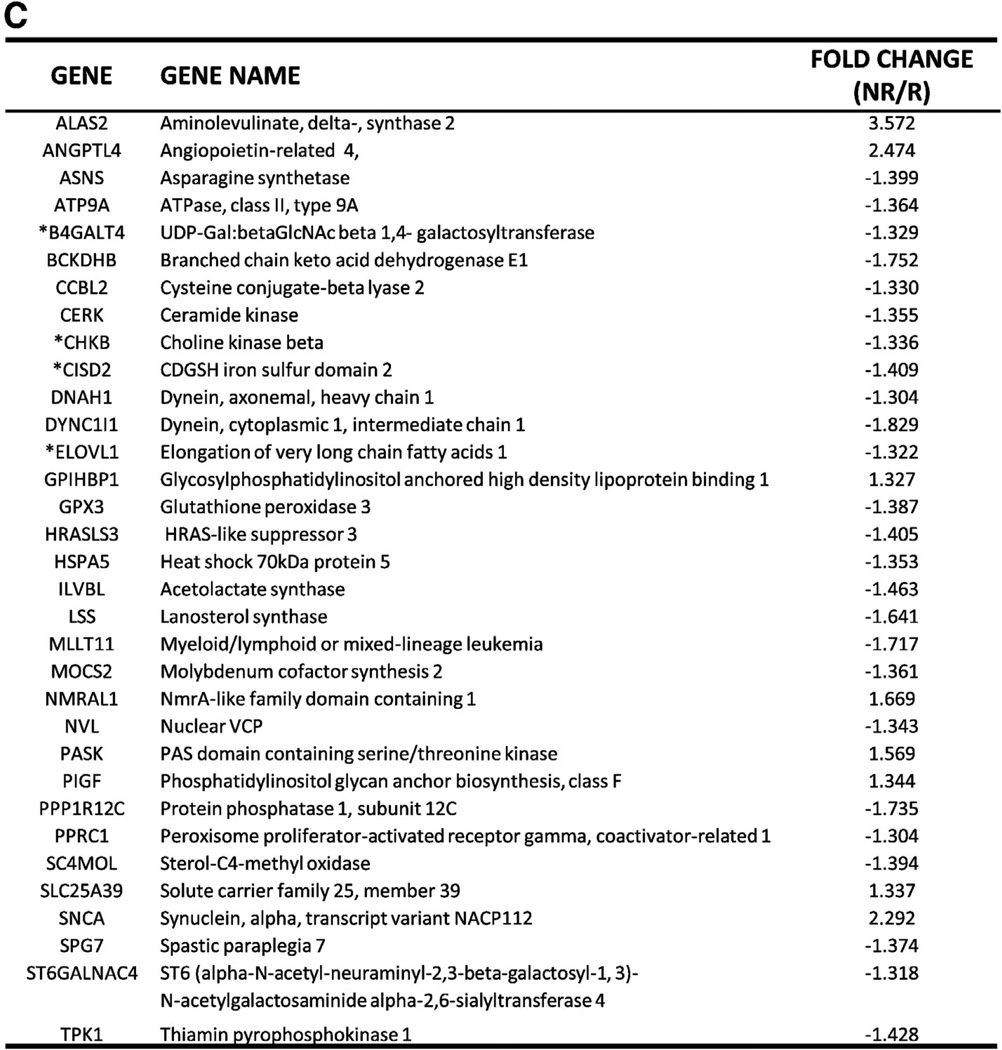
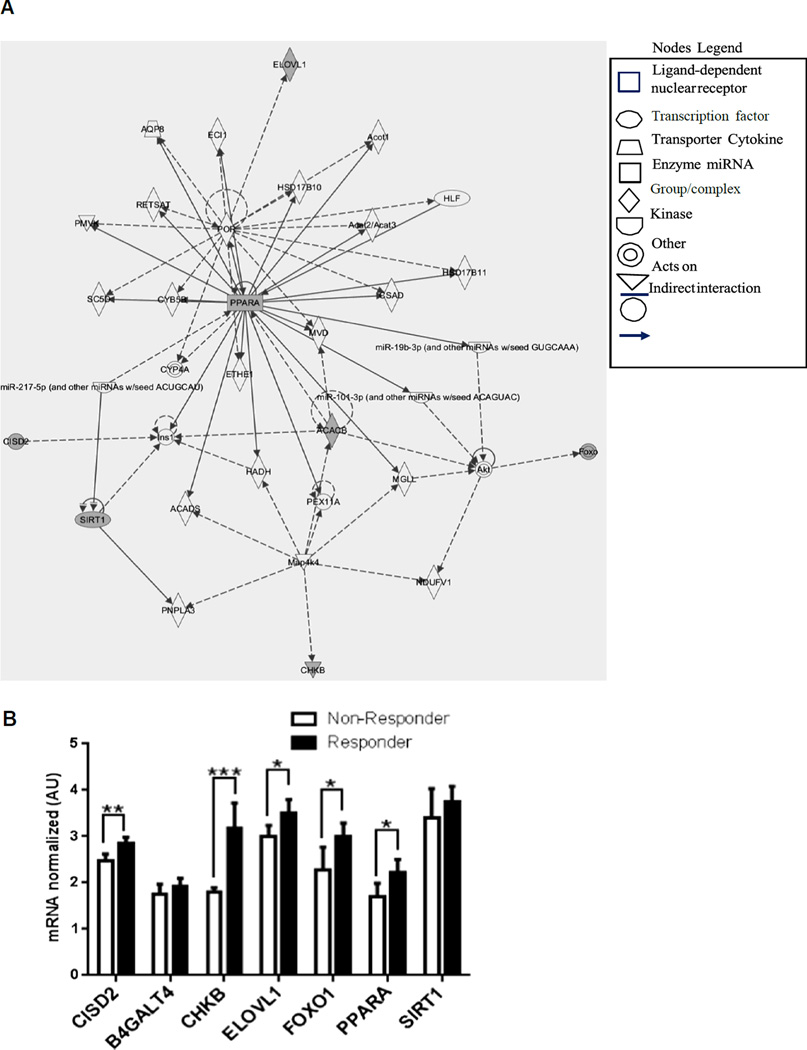
Results: Of 186 genes identified by microarray analysis, 70% were up-regulated in Responders and down-regulated in Non-Responders. Several genes involved in substrate metabolism and mitochondrial biogenesis were significantly different (fold-change>1.5, p<0.05) between the groups at baseline, indicating a blunted oxidative capacity at baseline in Non-Responders.

Conclusions/interpretations: These data suggest that a unique baseline expression pattern of genes involved in muscle fuel metabolism may predict an individual's lack of exercise response in metabolic outcomes, thus allowing exercise interventions to be targeted to these individuals and aid in the identification of novel approaches to treat Non-Responders in the future.

Keywords: Exercise resistance; Gene expression; Human skeletal muscle; Type 2 diabetes mellitus.


Conflict of interest statement

There are no conflicts of interest.

Figures

Fig. 1
Fig. 1
(A) Changes in metabolic parameters following nine months of supervised exercise and clinical characteristics. The changes (or lack thereof) in HbA1c, %body fat, BMI and mtDNA content were used in PCA analysis to distinguish Responders from Non-Responders. Data are presented as mean ± SEM. (B) Unsupervised cluster analysis of Illumina transcription arrays in muscle tissue mRNA at baseline generated a ‘hit list’ of 186 genes. Each color represents the log2 ratio of the (Responder gene expression/Non-Responder gene expression) of a particular gene in each participant. The fold change cut-off value was 1.3. False Discovery Rate (FDR) was 0.05. Each column shows data from a specific gene and each row shows data from a single participant. (Data from one Responder were not included due to poor quality.) Green indicates down-regulation and red indicates up-regulation. The values in the heat map range between −2 and +2. Expression ratios range from −2.3-fold in one direction to 3.6-fold in the other. The dendrogram reflects the degree of correlation of the genes assessed by the hierarchical clustering. (C) Subset of genes involved in substrate metabolism and mitochondrial function from the ‘hit list’. Functions were determined with Ingenuity Pathway Analysis (IPA) and available gene ontology. Of 186 genes, 48 genes were classified as hypothetical/pseudogenes or small nucleolar RNAs (data not shown). 33 genes from the ‘hit list’ were functionally classified as being involved in substrate metabolism and mitochondrial function. * indicates genes validated by qRT-PCR.
Fig. 1
Fig. 1
(A) Changes in metabolic parameters following nine months of supervised exercise and clinical characteristics. The changes (or lack thereof) in HbA1c, %body fat, BMI and mtDNA content were used in PCA analysis to distinguish Responders from Non-Responders. Data are presented as mean ± SEM. (B) Unsupervised cluster analysis of Illumina transcription arrays in muscle tissue mRNA at baseline generated a ‘hit list’ of 186 genes. Each color represents the log2 ratio of the (Responder gene expression/Non-Responder gene expression) of a particular gene in each participant. The fold change cut-off value was 1.3. False Discovery Rate (FDR) was 0.05. Each column shows data from a specific gene and each row shows data from a single participant. (Data from one Responder were not included due to poor quality.) Green indicates down-regulation and red indicates up-regulation. The values in the heat map range between −2 and +2. Expression ratios range from −2.3-fold in one direction to 3.6-fold in the other. The dendrogram reflects the degree of correlation of the genes assessed by the hierarchical clustering. (C) Subset of genes involved in substrate metabolism and mitochondrial function from the ‘hit list’. Functions were determined with Ingenuity Pathway Analysis (IPA) and available gene ontology. Of 186 genes, 48 genes were classified as hypothetical/pseudogenes or small nucleolar RNAs (data not shown). 33 genes from the ‘hit list’ were functionally classified as being involved in substrate metabolism and mitochondrial function. * indicates genes validated by qRT-PCR.
Fig. 2
Fig. 2
(A) Ingenuity Pathway Analysis (IPA) shows the relationships among genes expressed differentially between Responders and Non-Responders, from the microarray data and from the literature. Genes analyzed by qRT-PCR are shaded in gray and those from the literature are shown in white. The fold change cut-off value was 1.3. (B) A selection of genes that were verified in the literature as being involved in substrate metabolism and mitochondrial biogenesis were assessed by qRT-PCR for validation. Target genes for qRT-PCR analysis were selected based on known biological function according to the literature, as well as those found both in the ‘hit list’ and the IPA analysis. Other target genes were selected from the IPA analysis based on pathways associated with genes involved in substrate metabolism and mitochondrial function. qRT-PCR data are presented as mean ± SEM. *p < 0.05, **p < 0.01, ***p < 0.001. CISD2, CDGSH iron sulfur domain 2; B4GALT4, UDP-Gal:betaGlcNAcbeta1,4-galactosyltransferase, polypeptide 4; CHKB, choline kinase beta; ELOVL1, elongation of very long chain fatty acids; FOXO1, forkhead box protein O1; PPARα, peroxisome proliferator-activated receptor alpha; SIRT1, sirtuin 1.

References

    1. Gregg EW, Zhuo X, Cheng YJ, Albright AL, Narayan KM, Thompson TJ. Trends in lifetime risk and years of life lost due to diabetes in the USA, 1985–2011: a modelling study. Lancet Diabetes Endocrinol. 2014;11:867–874. - PubMed
    1. Church TS, Blair SN, Cocreham S, Johannsen N, Johnson W, Kramer K, et al. Effects of aerobic and resistance training on hemoglobin A1c levels in patients with type 2 diabetes: a randomized controlled trial. JAMA. 2010;304:2253–2262. - PMC - PubMed
    1. Sparks LM, Johannsen NM, Church TS, Earnest CP, Moonen-Kornips E, Moro C, et al. Nine months of combined training improves ex vivo skeletal muscle metabolism in individuals with type 2 diabetes. J Clin Endocrinol Metab. 2013;98:1694–1702. - PMC - PubMed
    1. Bouchard C, Blair SN, Church TS, Earnest CP, Hagberg JM, Hakkinen K, et al. Adverse metabolic response to regular exercise: is it a rare or common occurrence? PLoS One. 2012;7:e37887. - PMC - PubMed
    1. Kacerovsky-Bielesz G, Chmelik M, Ling C, Pokan R, Szendroedi J, Farukuoye M, et al. Short-term exercise training does not stimulate skeletal muscle ATP synthesis in relatives of humans with type 2 diabetes. Diabetes. 2009;58:1333–1341. - PMC - PubMed

Publication types