

Stream segregation in the anesthetized auditory cortex
- PMID: 26163899
- PMCID: PMC4582803
- DOI: 10.1016/j.heares.2015.07.004
Stream segregation in the anesthetized auditory cortex
Abstract
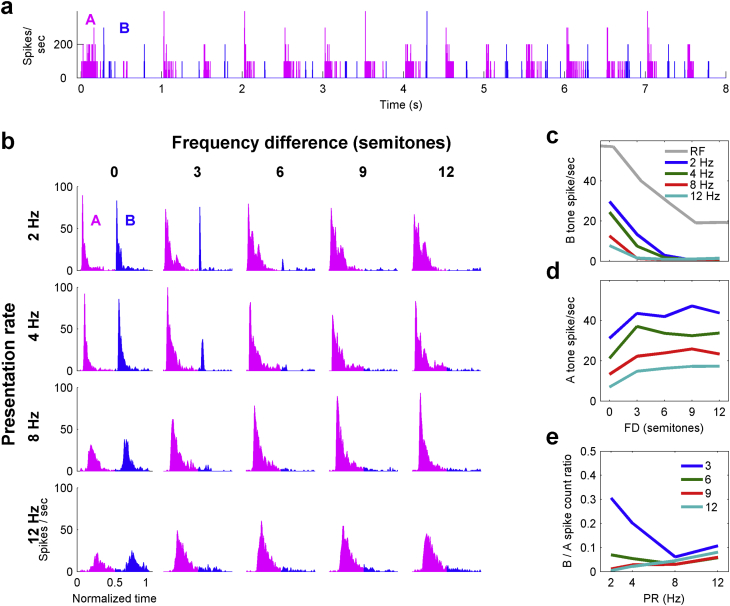
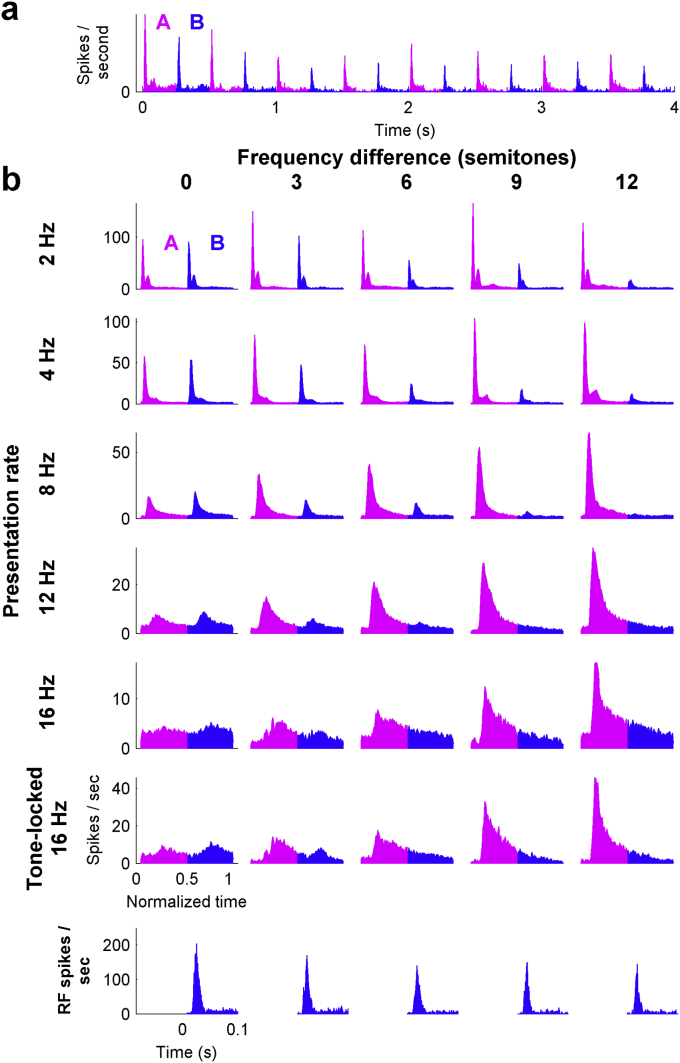
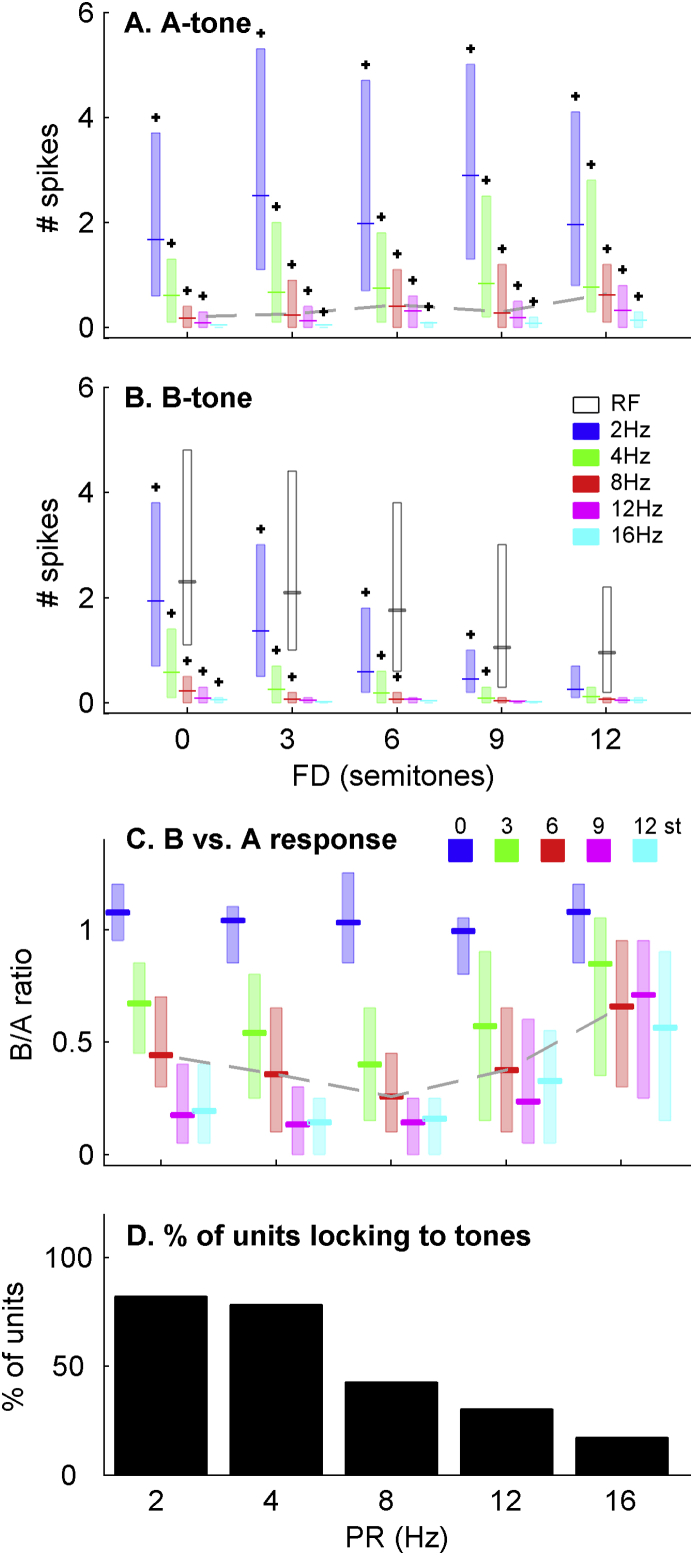
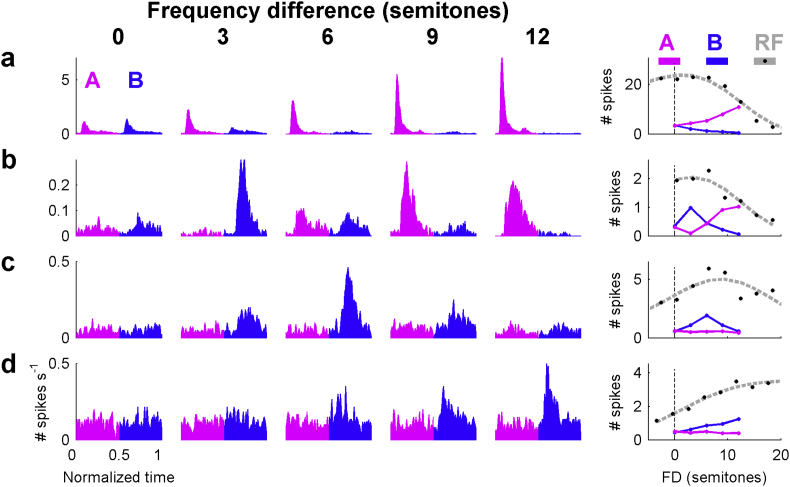
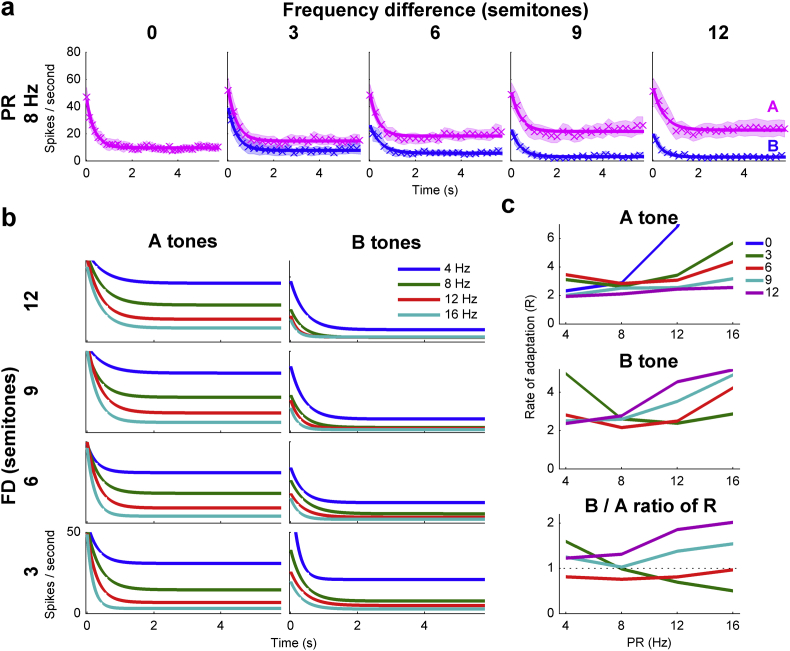
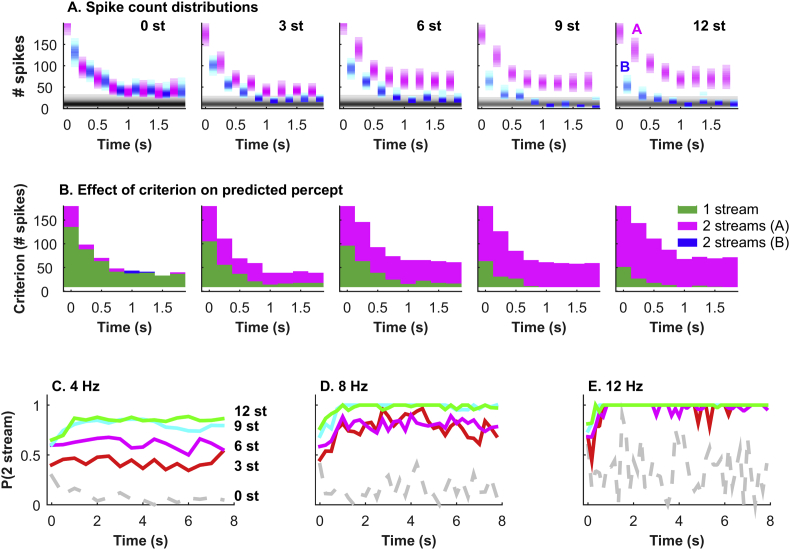
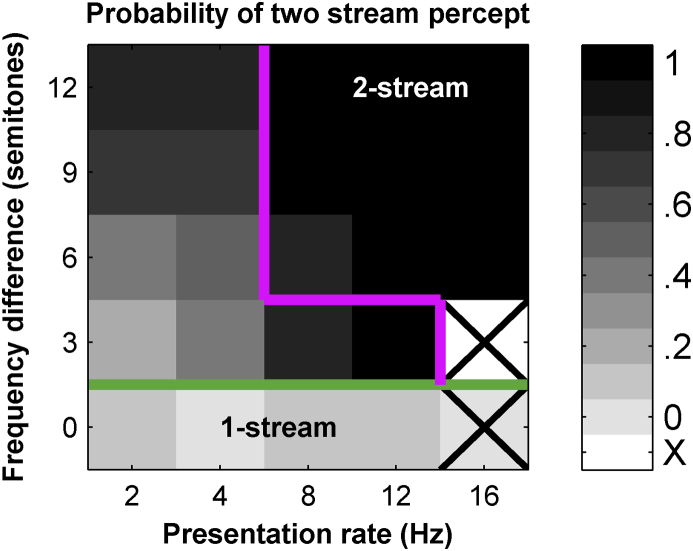
Auditory stream segregation describes the way that sounds are perceptually segregated into groups or streams on the basis of perceptual attributes such as pitch or spectral content. For sequences of pure tones, segregation depends on the tones' proximity in frequency and time. In the auditory cortex (and elsewhere) responses to sequences of tones are dependent on stimulus conditions in a similar way to the perception of these stimuli. However, although highly dependent on stimulus conditions, perception is also clearly influenced by factors unrelated to the stimulus, such as attention. Exactly how 'bottom-up' sensory processes and non-sensory 'top-down' influences interact is still not clear. Here, we recorded responses to alternating tones (ABAB …) of varying frequency difference (FD) and rate of presentation (PR) in the auditory cortex of anesthetized guinea-pigs. These data complement previous studies, in that top-down processing resulting from conscious perception should be absent or at least considerably attenuated. Under anesthesia, the responses of cortical neurons to the tone sequences adapted rapidly, in a manner sensitive to both the FD and PR of the sequences. While the responses to tones at frequencies more distant from neuron best frequencies (BFs) decreased as the FD increased, the responses to tones near to BF increased, consistent with a release from adaptation, or forward suppression. Increases in PR resulted in reductions in responses to all tones, but the reduction was greater for tones further from BF. Although asymptotically adapted responses to tones showed behavior that was qualitatively consistent with perceptual stream segregation, responses reached asymptote within 2 s, and responses to all tones were very weak at high PRs (>12 tones per second). A signal-detection model, driven by the cortical population response, made decisions that were dependent on both FD and PR in ways consistent with perceptual stream segregation. This included showing a range of conditions over which decisions could be made either in favor of perceptual integration or segregation, depending on the model 'decision criterion'. However, the rate of 'build-up' was more rapid than seen perceptually, and at high PR responses to tones were sometimes so weak as to be undetectable by the model. Under anesthesia, adaptation occurs rapidly, and at high PRs tones are generally poorly represented, which compromises the interpretation of the experiment. However, within these limitations, these results complement experiments in awake animals and humans. They generally support the hypothesis that 'bottom-up' sensory processing plays a major role in perceptual organization, and that processes underlying stream segregation are active in the absence of attention.
Keywords: Adaptation; Anesthesia; Auditory cortex; Auditory stream segregation; Neuron.
Copyright © 2015 The Authors. Published by Elsevier B.V. All rights reserved.
Figures
Similar articles
-
Neural correlates of auditory stream segregation in primary auditory cortex of the awake monkey.Hear Res. 2001 Jan;151(1-2):167-187. doi: 10.1016/s0378-5955(00)00224-0. Hear Res. 2001. PMID: 11124464
-
A Crucial Test of the Population Separation Model of Auditory Stream Segregation in Macaque Primary Auditory Cortex.J Neurosci. 2017 Nov 1;37(44):10645-10655. doi: 10.1523/JNEUROSCI.0792-17.2017. Epub 2017 Sep 27. J Neurosci. 2017. PMID: 28954867 Free PMC article.
-
Auditory stream segregation in monkey auditory cortex: effects of frequency separation, presentation rate, and tone duration.J Acoust Soc Am. 2004 Sep;116(3):1656-70. doi: 10.1121/1.1778903. J Acoust Soc Am. 2004. PMID: 15478432
-
The role of predictive models in the formation of auditory streams.J Physiol Paris. 2006 Jul-Sep;100(1-3):154-70. doi: 10.1016/j.jphysparis.2006.09.012. Epub 2006 Nov 3. J Physiol Paris. 2006. PMID: 17084600 Review.
-
Neural encoding and retrieval of sound sequences.Ann N Y Acad Sci. 2005 Dec;1060:125-35. doi: 10.1196/annals.1360.009. Ann N Y Acad Sci. 2005. PMID: 16597759 Review.
Cited by
-
Animal models for auditory streaming.Philos Trans R Soc Lond B Biol Sci. 2017 Feb 19;372(1714):20160112. doi: 10.1098/rstb.2016.0112. Epub 2017 Jan 2. Philos Trans R Soc Lond B Biol Sci. 2017. PMID: 28044022 Free PMC article. Review.
-
Stimulus Pauses and Perturbations Differentially Delay or Promote the Segregation of Auditory Objects: Psychoacoustics and Modeling.Front Neurosci. 2017 Apr 20;11:198. doi: 10.3389/fnins.2017.00198. eCollection 2017. Front Neurosci. 2017. PMID: 28473747 Free PMC article.
-
Buildup and bistability in auditory streaming as an evidence accumulation process with saturation.PLoS Comput Biol. 2020 Aug 27;16(8):e1008152. doi: 10.1371/journal.pcbi.1008152. eCollection 2020 Aug. PLoS Comput Biol. 2020. PMID: 32853256 Free PMC article.
-
Auditory streaming emerges from fast excitation and slow delayed inhibition.J Math Neurosci. 2021 May 3;11(1):8. doi: 10.1186/s13408-021-00106-2. J Math Neurosci. 2021. PMID: 33939042 Free PMC article.
-
Neuronal Correlates of Auditory Streaming in Monkey Auditory Cortex for Tone Sequences without Spectral Differences.Front Integr Neurosci. 2018 Jan 30;12:4. doi: 10.3389/fnint.2018.00004. eCollection 2018. Front Integr Neurosci. 2018. PMID: 29440999 Free PMC article.
References
-
- Alain C., Woods D.L. Signal clustering modulates auditory cortical activity in humans. Percept. Psychophys. 1994;56:501–516. - PubMed
-
- Albrecht D., Davidowa H. Action of urethane on dorsal lateral geniculate neurons. Brain Res. Bull. 1989;22:923–927. - PubMed
-
- Anstis S., Saida S. Adaptation to auditory streaming of frequency-modulated tones. J. Exp. Psychol. Hum. Percept. Perform. 1985;11:257–271.
-
- Bee M.A., Klump G.M. Primitive auditory stream segregation: a neurophysiological study in the songbird forebrain. J. Neurophysiol. 2004;92:1088–1104. - PubMed
-
- Bee M.A., Klump G.M. Auditory stream segregation in the songbird forebrain: effects of time intervals on responses to interleaved tone sequences. Brain Behav. Evol. 2005;66:197–214. - PubMed
Publication types
MeSH terms
Substances
Grants and funding
LinkOut - more resources
Full Text Sources
Other Literature Sources
Medical
Research Materials
Miscellaneous
