. 2015 Dec 15:74:406-10.
doi: 10.1016/j.bios.2015.06.069. Epub 2015 Jul 2.

A nanocoaxial-based electrochemical sensor for the detection of cholera toxin

Affiliations

A nanocoaxial-based electrochemical sensor for the detection of cholera toxin

Michelle M Archibald et al. Biosens Bioelectron. .

Abstract

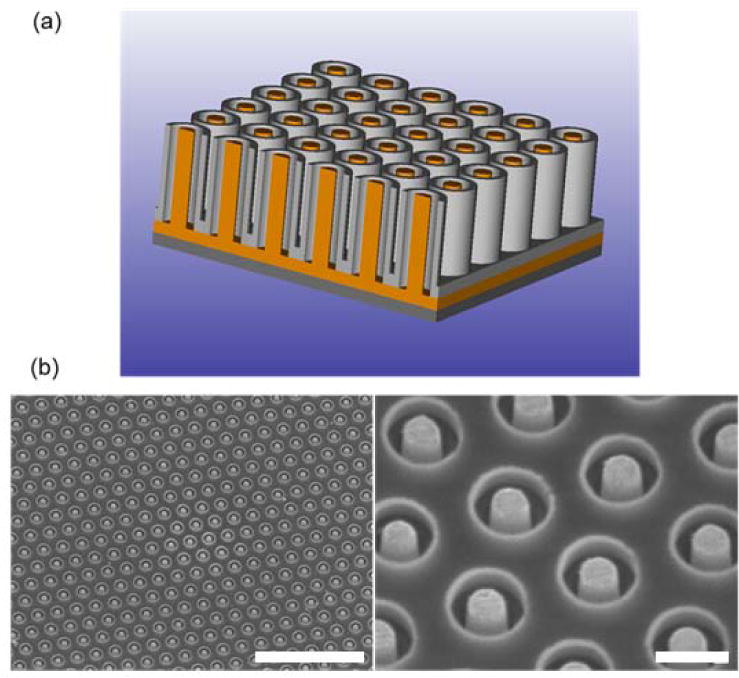
Sensitive, real-time detection of biomarkers is of critical importance for rapid and accurate diagnosis of disease for point of care (POC) technologies. Current methods do not allow for POC applications due to several limitations, including sophisticated instrumentation, high reagent consumption, limited multiplexing capability, and cost. Here, we report a nanocoaxial-based electrochemical sensor for the detection of bacterial toxins using an electrochemical enzyme-linked immunosorbent assay (ELISA) and differential pulse voltammetry (DPV) or square wave voltametry (SWV). The device architecture is composed of vertically-oriented, nanoscale coaxial electrodes in array format (~10(6) coaxes per square millimeter). The coax cores and outer shields serve as integrated working and counter electrodes, respectively, exhibiting a nanoscale separation gap corresponding to ~100 nm. Proof-of-concept was demonstrated for the detection of cholera toxin (CT). The linear dynamic range of detection was 10 ng/ml-1 µg/ml, and the limit of detection (LOD) was found to be 2 ng/ml. This level of sensitivity is comparable to the standard optical ELISA used widely in clinical applications, which exhibited a linear dynamic range of 10 ng/ml-1 µg/ml and a LOD of 1 ng/ml. In addition to matching the detection profile of the standard ELISA, the nanocoaxial array provides a simple electrochemical readout and a miniaturized platform with multiplexing capabilities for the simultaneous detection of multiple biomarkers, giving the nanocoax a desirable advantage over the standard method towards POC applications.

Keywords: Cholera; DPV; ELISA; Electrochemistry; Nanocoax; Point-of-care.


Figures

Figure 1
Figure 1
Structure of the nanocoax. (a) Schematic representation of a nanocoaxial array with an etched annulus. The inner Au core (shown in orange) serves as the working electrode (WE) and the outer Cr metal (gray) serves as the counter electrode (CE). (b) SEM images of an array with 150 nm annulus thickness and 500 nm annulus depth with inner Au and outer Cr electrodes. Volume between individual coaxes is filled with SU-8 polymer. Scale bars represent 5 μm length (left image) and 500 nm length (right image). (color online).
Figure 2
Figure 2
DPV signal from an ALP dose titration on (a) a nanocoaxial array and (b) a planar Au sensor. DPVs were subtracted to baseline at −0.2 V for both nanocoax and planar samples to determine peak current. (c) Comparison of planar Au and nanocoaxial ALP log-linear range of detection shown by peak current normalized to each sensor base area. (color online).
Figure 3
Figure 3
Electrochemical ELISA for detection of CT by a nanocoaxial array. DPV signals for CT concentrations ranging from 100 pg/ml to 10 μg/ml were examined. DPVs were subtracted to baseline at −0.14 V in order to determine peak current. Data shown represents one replicate. (color online).
Figure 4
Figure 4
Electrochemical and optical readouts of a CT ELISA. On the right y-axis, peak current (Ip) vs. CT concentration is plotted for electrochemical detection by the nanocoaxial array (red). Peak currents were determined from the baseline normalized DPV signals as shown in Figure 3. On the left y-axis, absorbance at λ = 600 nm vs. CT concentration on a log scale for the conventional optical readout of an ELISA (blue). Limit of detection and log-linear dynamic range were determined for each readout method. Data represent two trials run on the same device. Error bars represent standard deviations, however many error bars are smaller than the size of the plotted data points. (color online).

References

    1. Aebersold R, Mann M. Mass spectrometry-based proteomics. Nature. 2003;422:198–207. doi: 10.1038/nature01511. - DOI - PubMed
    1. Berrade L, Garcia A, Camarero J. Protein microarrays: novel developments and applications. Pharm Res. 2011;28:1480–1499. doi: 10.1007/s11095-010-0325-1.Protein. - DOI - PMC - PubMed
    1. Centers for Disease Control and Prevention. 2014 〈 http://www.cdc.gov/vhf/ebola/〉.
    1. Chikkaveeraiah BV, Bhirde AA, Morgan NY, Eden HS, Chen X. Electrochemical immunosensors for detection of cancer protein biomarkers. ACS Nano. 2012;6:6546–6561. doi: 10.1021/nn3023969. - DOI - PMC - PubMed
    1. Dick MH, Guillerm M, Moussy F, Chaignat CL. Review of two decades of cholera diagnostics–how far have we really come? PLoS Negl Trop Dis. 2012;6:e1845. doi: 10.1371/journal.pntd.0001845. - DOI - PMC - PubMed

Publication types

MeSH terms

LinkOut - more resources