. 2015 Oct:139:48-63.
doi: 10.1016/j.exer.2015.07.002. Epub 2015 Jul 8.

In vivo electroretinographic studies of the role of GABAC receptors in retinal signal processing

Affiliations

In vivo electroretinographic studies of the role of GABAC receptors in retinal signal processing

Jing Wang et al. Exp Eye Res. 2015 Oct.

Abstract

All three classes of receptors for the inhibitory neurotransmitter GABA (GABAR) are expressed in the retina. This study investigated roles of GABAR, especially GABACR (GABA(A)-ρ), in retinal signaling in vivo by studying effects on the mouse electroretinogram (ERG) of genetic deletion of GABACR versus pharmacological blockade using receptor antagonists. Brief full-field flash ERGs were recorded from anesthetized GABACR(-/-) mice, and WT C57BL/6 (B6) mice, before and after intravitreal injection of GABACR antagonists, TPMPA, 3-APMPA, or the more recently developed 2-AEMP; GABAAR antagonist, SR95531; GABABR antagonist, CGP, and agonist, baclofen. Intravitreal injections of TPMPA and SR95531 were also made in Brown Norway rats. The effect of 2-AEMP on GABA-induced current was tested directly in isolated rat rod bipolar cells, and 2-AEMP was found to preferentially block GABACR in those cells. Maximum amplitudes of dark (DA) and light-adapted (LA) ERG b-waves were reduced in GABACR(-/-) mice, compared to B6 mice, by 30-60%; a-waves were unaltered and oscillatory potential amplitudes were increased. In B6 mice, after injection of TPMPA (also in rats), 3-APMPA or 2-AEMP, ERGs became similar to ERGs of GABACR(-/-) mice. Blockade of GABAARs and GABABRs, or agonism of GABABRs did not alter B6 DA b-wave amplitude. The negative scotopic threshold response (nSTR) was slightly less sensitive in GABACR(-/-) than in B6 mice, and unaltered by 2-AEMP. However, amplitudes of nSTR and photopic negative response (PhNR), both of which originate from inner retina, were enhanced by TPMPA and 3-APMPA, each of which has GABAB agonist properties, and further increased by baclofen. The finding that genetic deletion of GABACR, the GABACR antagonist 2-AEMP, and other antagonists all reduced ERG b-wave amplitude, supports a role for GABACR in determining the maximum response amplitude of bipolar cells contributing to the b-wave. GABACR antagonists differed in their effects on nSTR and PhNR; antagonists with GABAB agonist properties enhanced light-driven responses whereas 2-AEMP did not.

Keywords: Electroretinogram; GABA; GABA receptors; Retina; Retinal signaling.


Figures

Figure 1
Figure 1
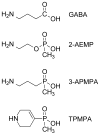
Chemical formulae for GABA, 2-AEMP, TPMPA and 3-APMPA. The figure shows the structural similarities and differences between the inhibitory neurotransmitter, GABA and the GABACR antagonists used in this study that varied in specificity for GABACR (see Discussion). GABA, ã-aminobutyric acid; 2-AEMP, 2-aminoethyl methylphosphonate; phosphonic analogues: 3-APMPA (3- aminopropyl-(methyl) phosphinic acid) and TPMPA (1,2,5,6-tetrahydropyridine-4-yl-methylphosphinic acid).
Figure 2
Figure 2
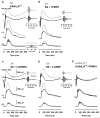
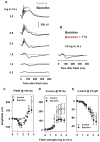
Dose response function of the effect of GABAcR antagonists, TPMPA and 2-AEMP on b- wave amplitude in DA-ERGs of mice. DA-ERG responses to a flash of 1.3 log sc td s are shown before (grey lines) and after (black lines) intravitreal injection of (A) TPMPA or (B) 2-AEMP over a range of increasing vitreal concentrations from bottom to top and for (C) GABACR−/−. (D) Normalized b- wave amplitudes were plotted against the vitreal concentration for TPMPA (filled circles) and 2-AEMP (open circles) in response to flash of 1.3 log sc td. The solid and dashed lines show the best fitting Hill equations. b-wave amplitudes measured from trough to peak after injection were normalized to amplitudes before injection. Error bars represent standard error of the mean.
Figure 3
Figure 3
The effect of 2-AEMP on isolated rat retinal bipolar cells. (A) Test of 100 μM 2-AEMP on the response to 10 μM GABA. Responses recorded from a single cell upon treatment with 10 μM GABA alone, co-applied 10 μM GABA plus 100 μM 2-AEMP. Black trace was obtained before, and blue trace after, the response to the GABA plus 2-AEMP mixture (red trace). (B) Test of 100 μM 2-AEMP on the response to 10 μM GABA plus 50 μM bicuculline. Responses recorded from a second cell upon treatment, sequentially, with 10 μM GABA plus 50 μM bicuculline (black trace), 100 μM 2-AEMP plus 10 μM GABA plus 50 μM bicuculline (red trace), and 10 μM GABA plus 50 μM bicuculline (blue trace). (C) Test of 100 μM 2-AEMP on the response to 100 μM THIP. Responses recorded sequentially with 100 μM THIP alone (black trace), 1 μM GABA plus 100 μM THIP (red trace), and 100 μM THIP (blue trace). (D) Peak current in the presence of additional 100 μm 2-AEMP was normalized to that in the absence of 2-AEMP, obtained to 10 μM GABA alone, 10 μM GABA plus 50 μM bicuculline, 10 μM GABA plus 100 μM TPMPA, 100 μM GABA plus 100 μM TPMPA and 100 μM THIP. Error bars represent standard deviation.
Figure 4
Figure 4
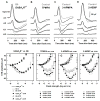
The effect of genetic elimination of GABACR vs effects of GABACR antagonists on the mouse DA-ERG. DA-ERG responses elicited by brief full-field flashes with energy increasing from bottom to top were recorded in (A) B6 (grey lines) and GABACR−/− mice (black lines), and before (grey lines) and after (black lines) intravitreal application of (B) TPMPA, (C) 3-APMPA and (D) 2-AEMP in the B6 mice, and before (grey lines) and after (black lines) intravitreal application of (E) TPMPA in GABACR−/− mice. The plots inserted on the right hand side of the responses to 1.2 and −2.3 log sc td s flash show the extracted OPs (50 – 300 Hz).
Figure 5
Figure 5
The effect of GABACR−/− (n=6), TPMPA (n=5) and 2-AEMP (n=5) on the amplitude of mouse DA-ERG parameters. Amplitudes of b-wave measured at 110 ms after flash and from a-wave trough to peak (inserts) are plotted against flash strength recorded from (A) B6 (open circles) and GABACR−/− (black filled circles) mice, and before (open circles) and after (black filled circles) application of (B) TPMPA and (C) 2-AEMP. Amplitudes of a-wave measured at the trough are plotted against flash energy before (open circles) and after (black filled circles) application of (E) TPMPA, (F) 2-AEMP and from (D) GABACR−/− mice. RMS of OPs over the initial 100 ms window are plotted against flash energy in the upper plots before (open circles) and after (black filled circles) application of (H) TPMPA, (I), 2- AEMP and from (J) GABACR−/− mice. The lower plots show RMS of noise in the unstimulated window 700–800 ms after the flash. Error bars represent standard error of the mean.
Figure 6
Figure 6
The effect of GABACR antagonists and GABACR−/− on the STR of mouse DA-ERG. DA-ERG responses elicited by weak flashes (−6 to −3 log sc td s) are shown before (grey lines) and after (black lines) intravitreal application of (B) TPMPA, (C) 3-APMPA (D) 2-AEMP and from (A) B6 (grey lines) and GABACR−/− (black lines) mice. Amplitudes of pSTR (triangles) measured at 110 ms after flash and nSTR (circles) measured at 200 ms are plotted against flash energy before (open) and after (black) application of (F) TPMPA, (G) 3APMPA, (H) 2-AEMP and from (E) GABACR−/− mice. The solid lines show the best fitting generalized Naka-Rushton functions. Error bars represent standard error of the mean.
Figure 7
Figure 7
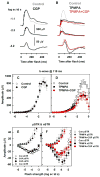
The effect of GABABR on the b-wave amplitude of mouse DA-ERG. (A). DA-ERG recordings elicited by brief full-field flashes before (grey lines) and after (black lines) intravitreal injection of CGP. (B). DA-ERG recordings before (grey lines) and after (black lines) application of TPMPA and with additional application of CGP after TPMPA (red lines). Stimulus response function for b-wave and STR amplitude before (open circles) and after (black filled circles) the treatment are plotted for (C, E) CGP (n=4), for (D, F) TPMPA (n=4, black filled circles and triangles) and TPMPA+CGP (n=4, red filled circles and triangles). Error bars represent standard error of the mean.
Figure 8
Figure 8
The effect of GABAAR antagonist SR95531 on the DA-ERGs in B6 mice. (A) DA-ERG recordings before (grey lines) and after (black lines) intravitreal injection of SR95531. (B) DA-ERG responses after SR95531 (black line) and with additional application of TTX after SR95531 (red lines). Stimulus response function before (open circles) and after (black filled circles) application of SR95531 (n=5) are plotted for (C) b-wave amplitude measured at 110 ms after the flash and also from a-wave trough to peak (inserted), for (D) a-wave amplitude measured from trough to baseline. Error bars represent standard error of the mean.
Figure 9
Figure 9
The effect of inactivation of GABACR on the mouse LA-ERG. LA-ERG responses elicited by brief full-field flashes with a rod-saturated background before (grey lines) and after (black lines) intravitreal injection of (B) TPMPA and (C) 2-AEMP and from (A) GABACR−/− mice. Stimulus response function of b-wave, and OPs RMS are plotted against stimulus strength before (open circles) and after (filled circles) injection of (E) TPMPA and (F) 2-AEMP and for (D) B6 (open circles) and GABACR−/− (filled circles) mice. B6. Error bars represent standard error of the mean.
Figure 10
Figure 10
The effect of GABABR agonist baclofen on the DA-ERGs in B6 mice. The figures shows (A) DA-ERG recordings before (grey lines) and after (black lines) intravitreal injection of baclofen and (B) with additional application of TTX after baclofen (red lines). Stimulus response function before (open circles) and after (black filled circles) application of baclofen (n=4) are plotted for (C) b-wave amplitude measured at 110 ms after the flash and also from a-wave trough to peak (inserted), for (D) a-wave amplitude measured from trough to baseline and for (E) nSTR amplitude measured at 200 ms, and for (F) OPs RMS and noise RMS. Error bars represent standard error of the mean.
Figure 11
Figure 11
The effect of GABABR agonist baclofen on the LA-ERG. (A) LA-ERG recordings before (grey lines) and after (black lines) intravitreal injection of baclofen. (B) Responses of additional application of TTX (black line) after baclofen injection (grey line). Stimulus response functions before (open circles) and after (black filled circles) application of baclofen (n=4) are plotted for (C) the PhNR amplitude measured at 100 ms after the flash, for (D) b-wave amplitude measured at 50 ms and for (E) a-wave amplitude measured at the trough. Error bars represent standard error of the mean.
Figure 12
Figure 12
The effect of TPMPA on the DA-ERG in Brown Norway rats. (A) DA-ERG recordings before (grey lines) and after (black lines) intravitreal injection of TPMPA. (B) The b-wave amplitude measured at 110 ms after the flash, plotted against flash energy, before (open circles) and after (black filled circles) application of TPMPA (n=3). Error bars represent standard error of the mean. (C) Responses before (grey lines) and after (black lines) injection of SR95531.

Similar articles

Cited by

References

    1. Abd-El-Barr MM, Pennesi ME, Saszik SM, Barrow AJ, Lem J, Bramblett DE, et al. Genetic dissection of rod and cone pathways in the dark-adapted mouse retina. Journal of Neurophysiology. 2009;102:1945–1955. - PMC - PubMed
    1. Bolz J, Thier P, Voigt T, Wassle H. Action and localization of glycine and taurine in the cat retina. J Physiol. 1985;362:395–413. - PMC - PubMed
    1. Bush RA, Sieving PA. A proximal retinal component in the primate photopic erg a-wave. Invest Ophthalmol Vis Sci. 1994;35:635–645. - PubMed
    1. Cates LA, Li VS, Yakshe CC, Fadeyi MO, Andree TH, Karbon EW, et al. Phosphorus analogues of gamma-aminobutyric acid, a new class of anticonvulsants. Journal of Medicinal Chemistry. 1984;27:654–659. - PubMed
    1. Chavez AE, Grimes WN, Diamond JS. Mechanisms underlying lateral gabaergic feedback onto rod bipolar cells in rat retina. Journal of Neuroscience. 2010;30:2330–2339. - PMC - PubMed

Publication types