. 2015 Nov:206:22-39.
doi: 10.1016/j.bpc.2015.06.011. Epub 2015 Jul 4.

Lipid insertion domain unfolding regulates protein orientational transition behavior in a lipid bilayer

Affiliations

Lipid insertion domain unfolding regulates protein orientational transition behavior in a lipid bilayer

Kwan Hon Cheng et al. Biophys Chem. 2015 Nov.

Abstract

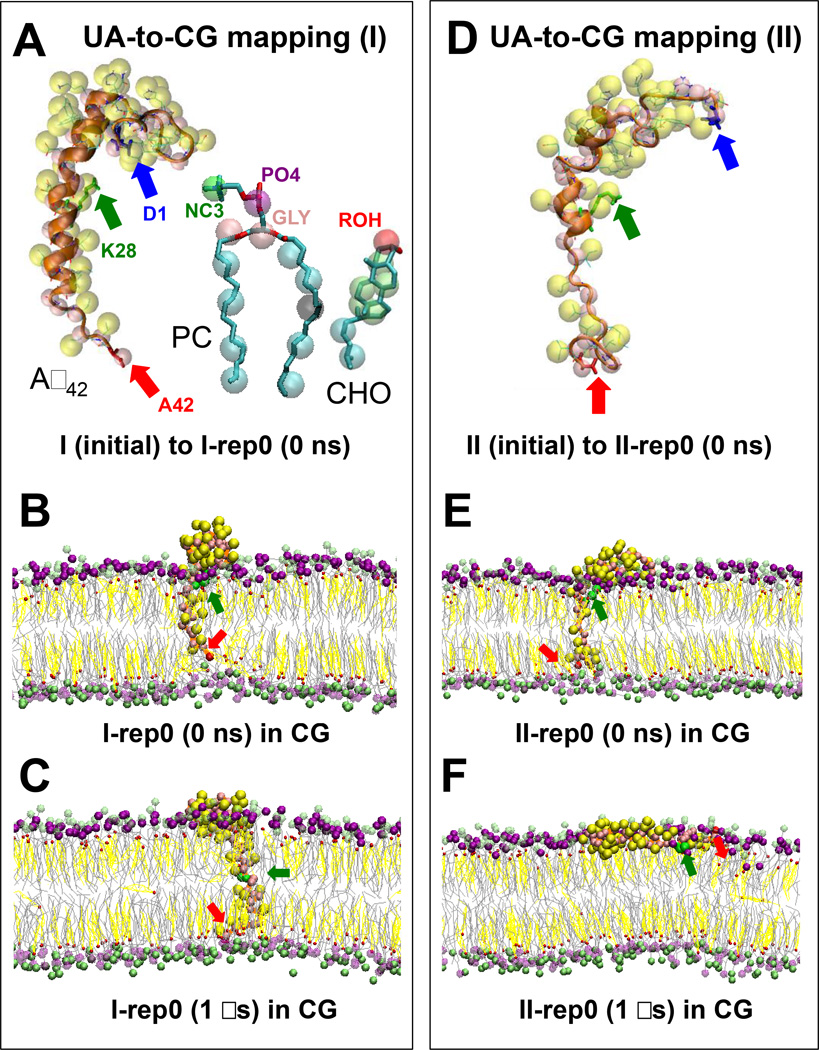
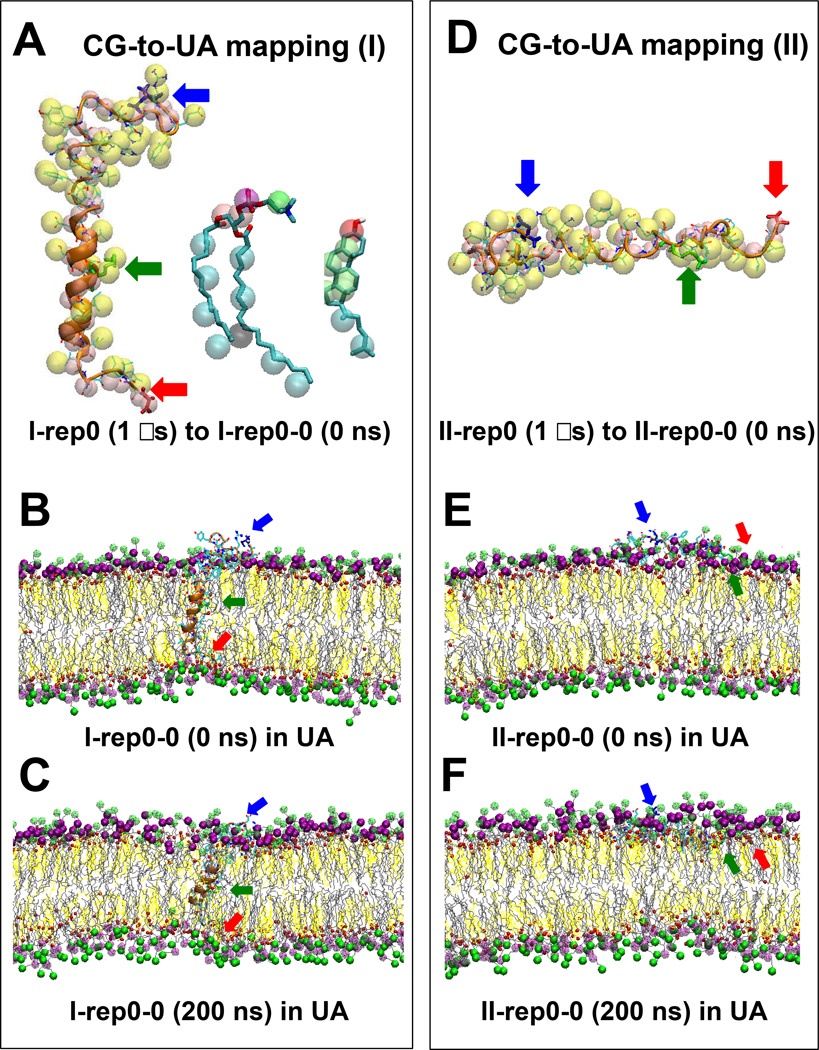
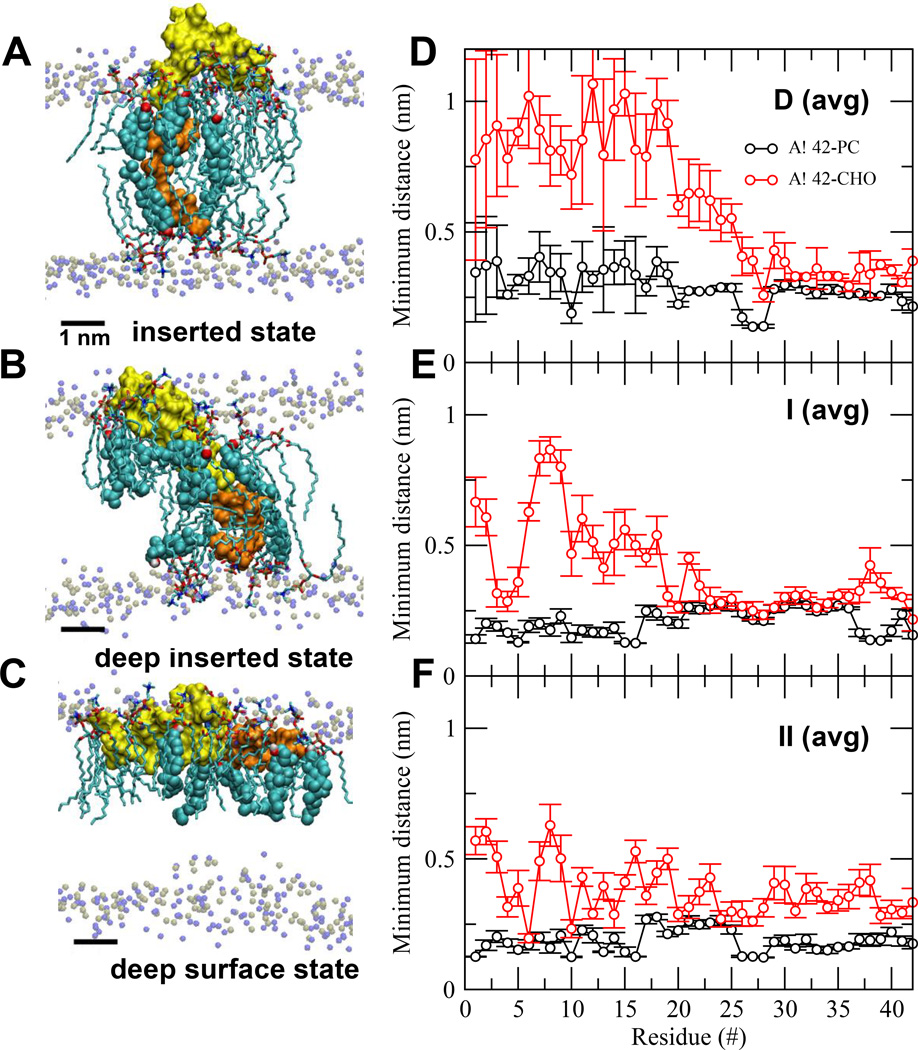
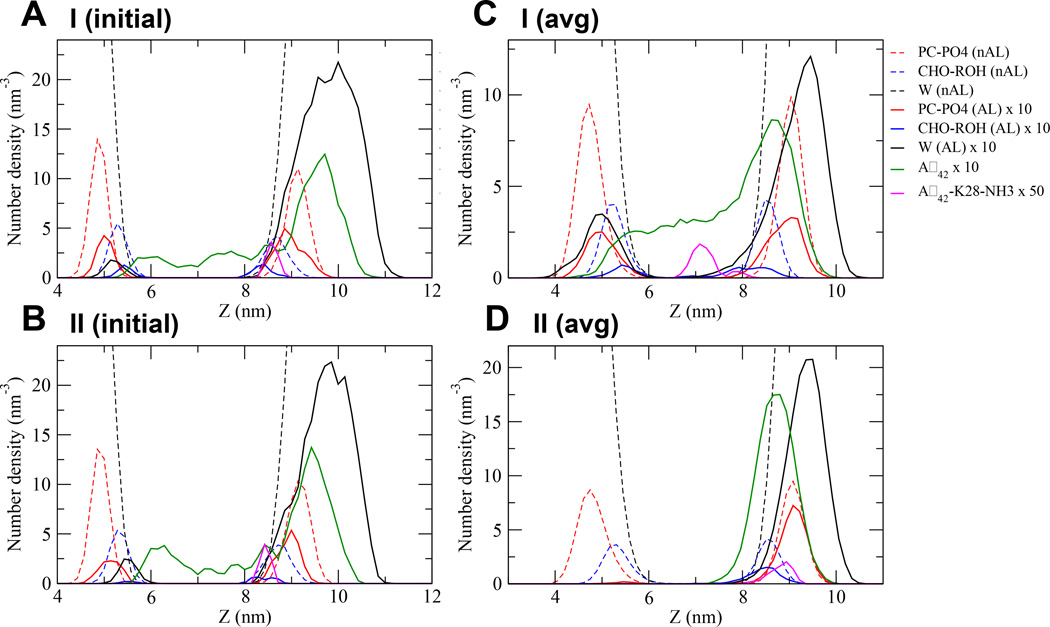
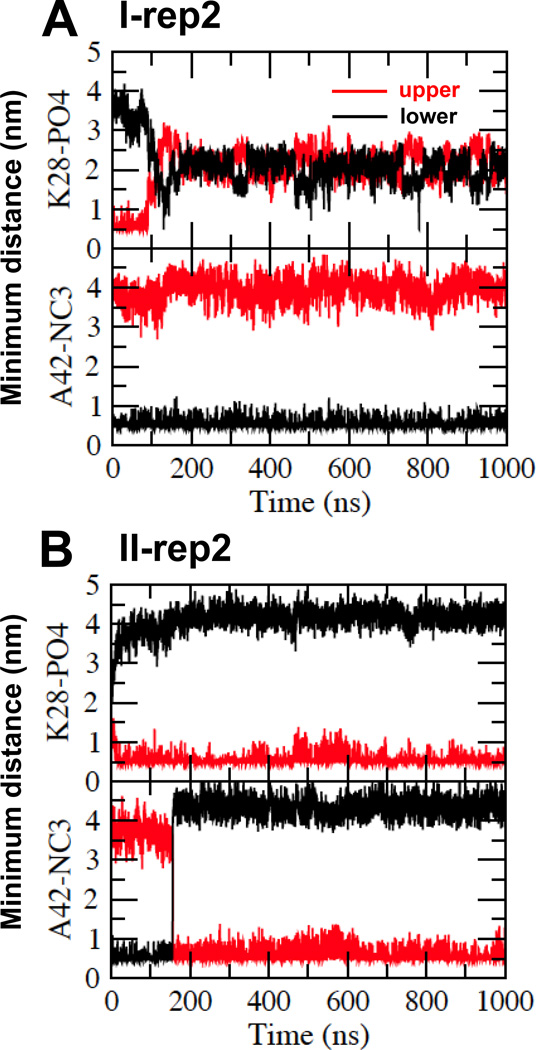
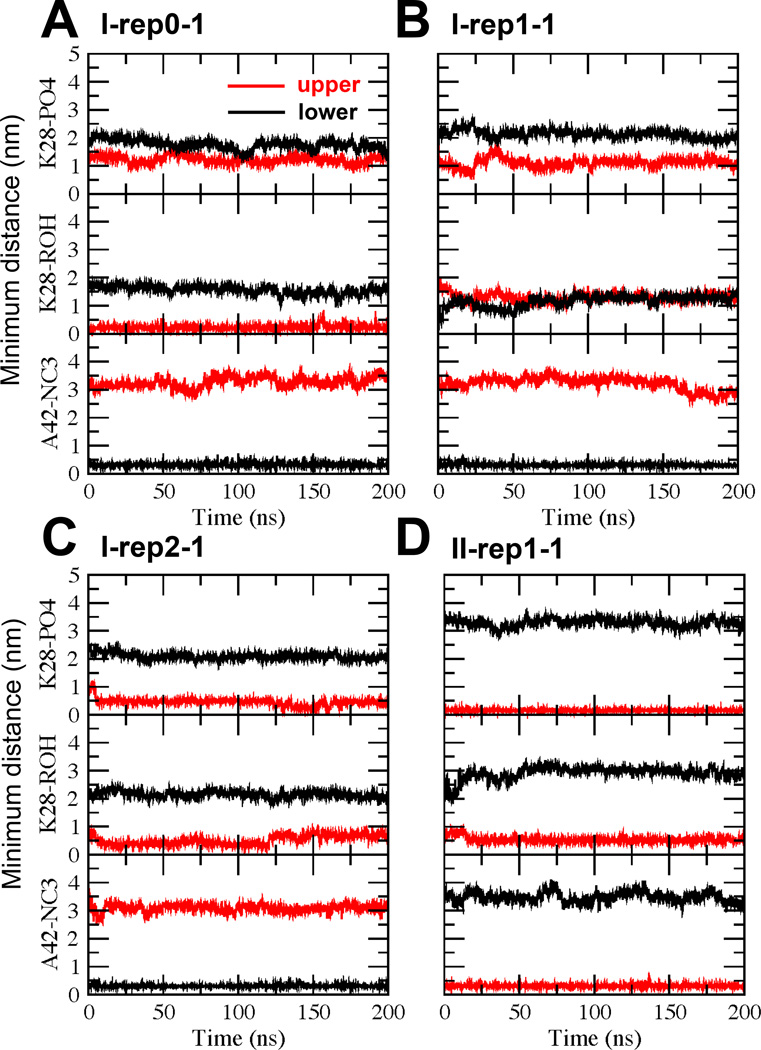
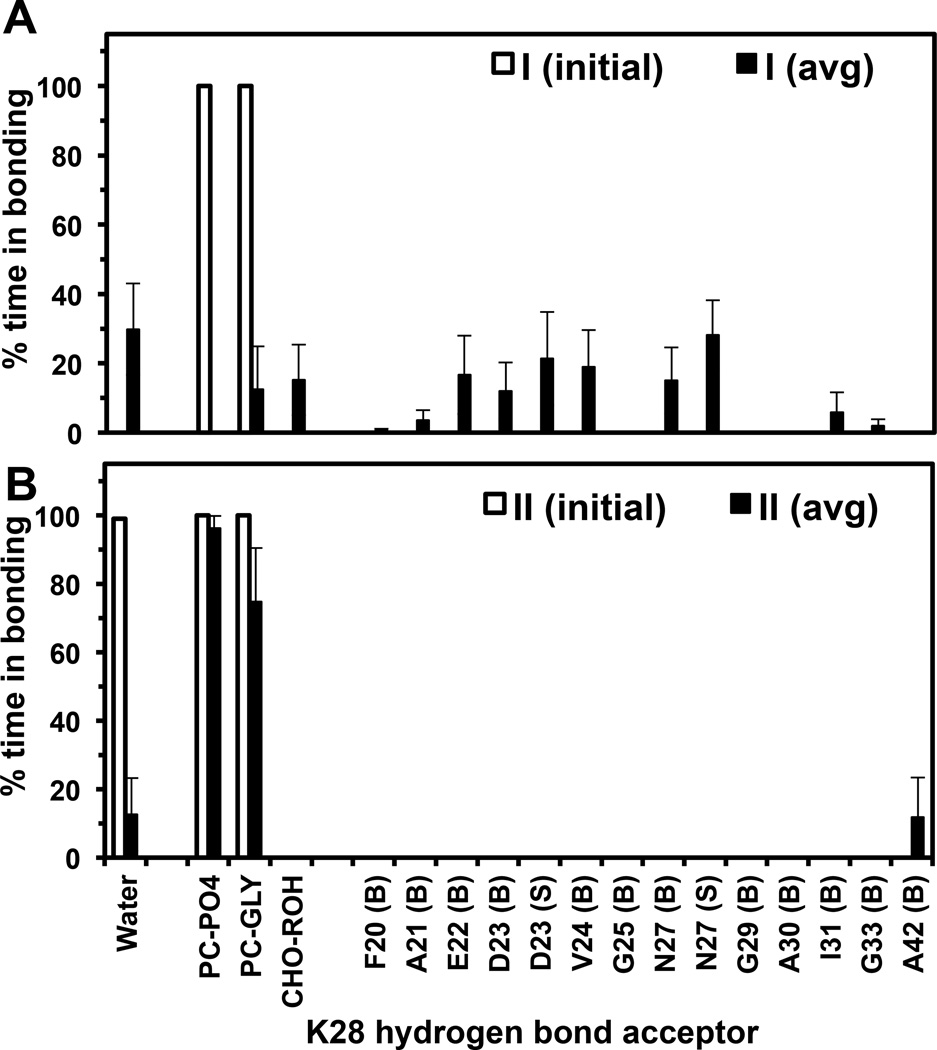
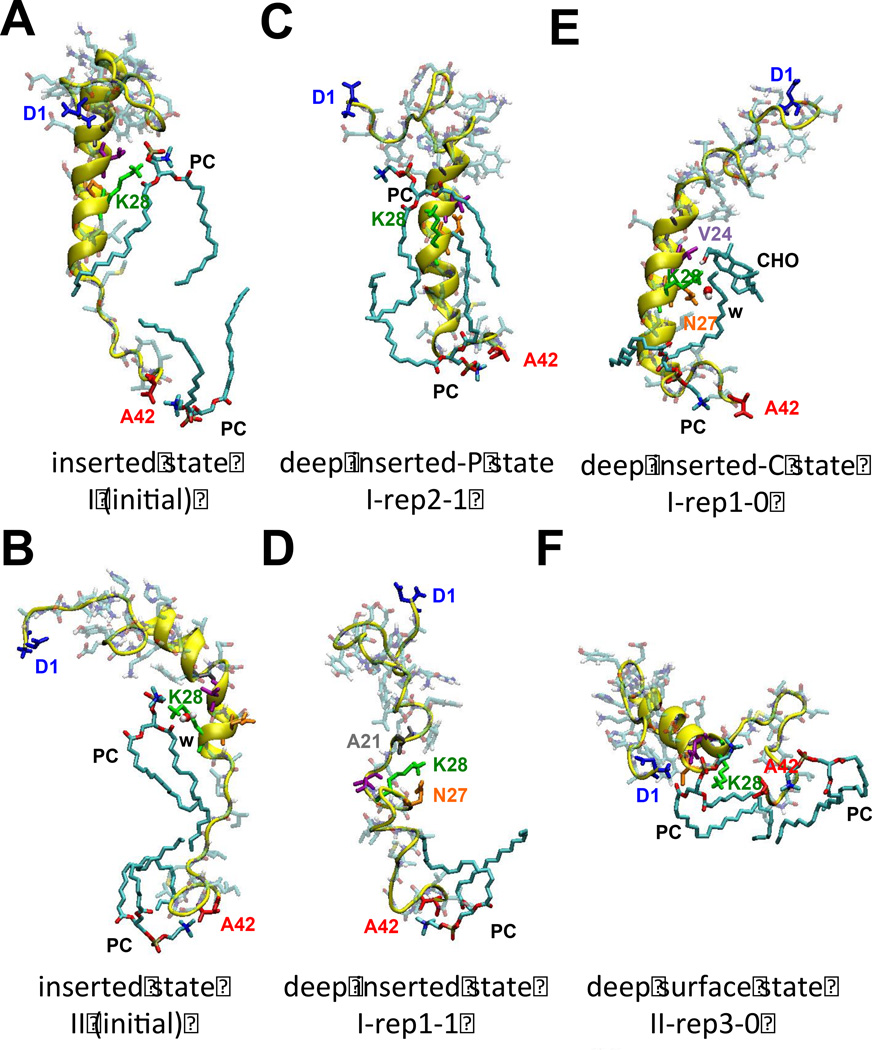
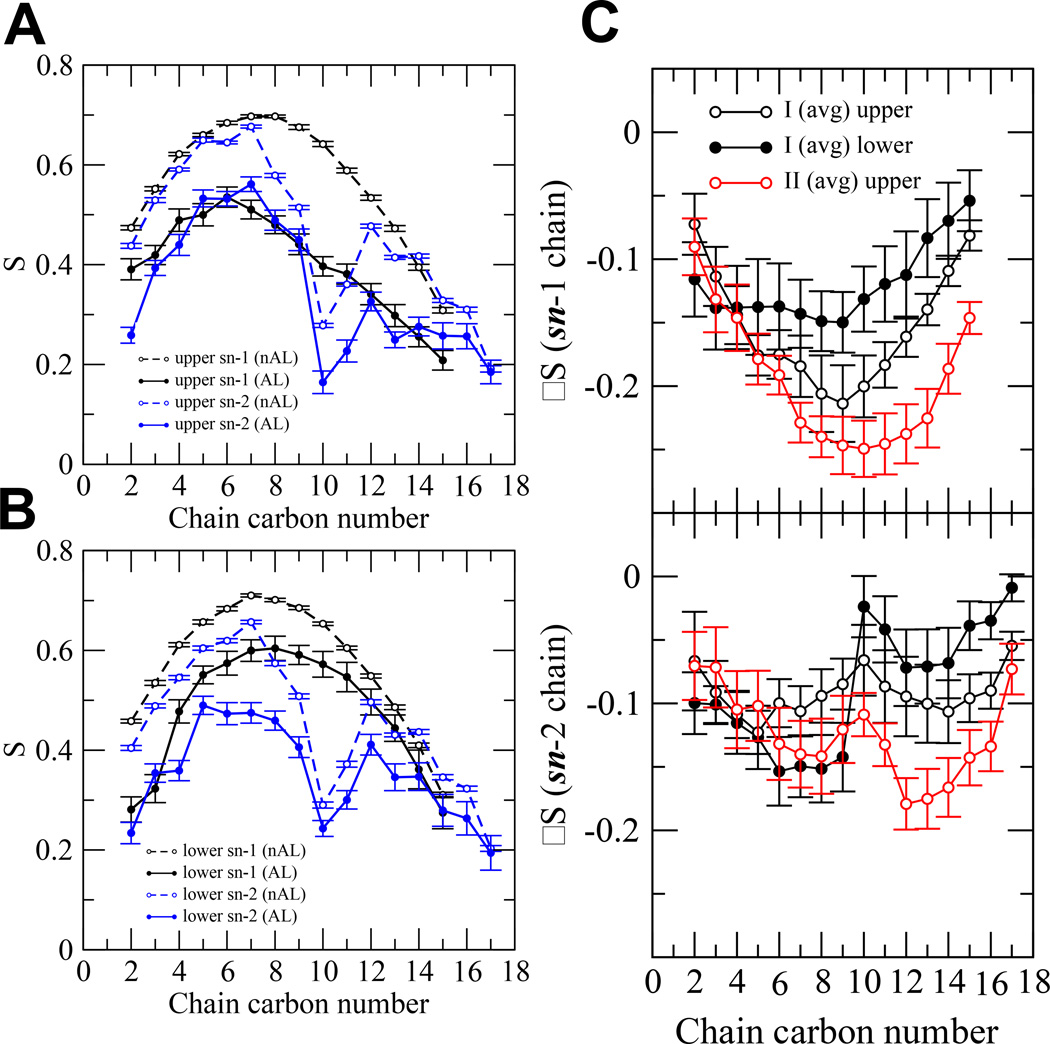
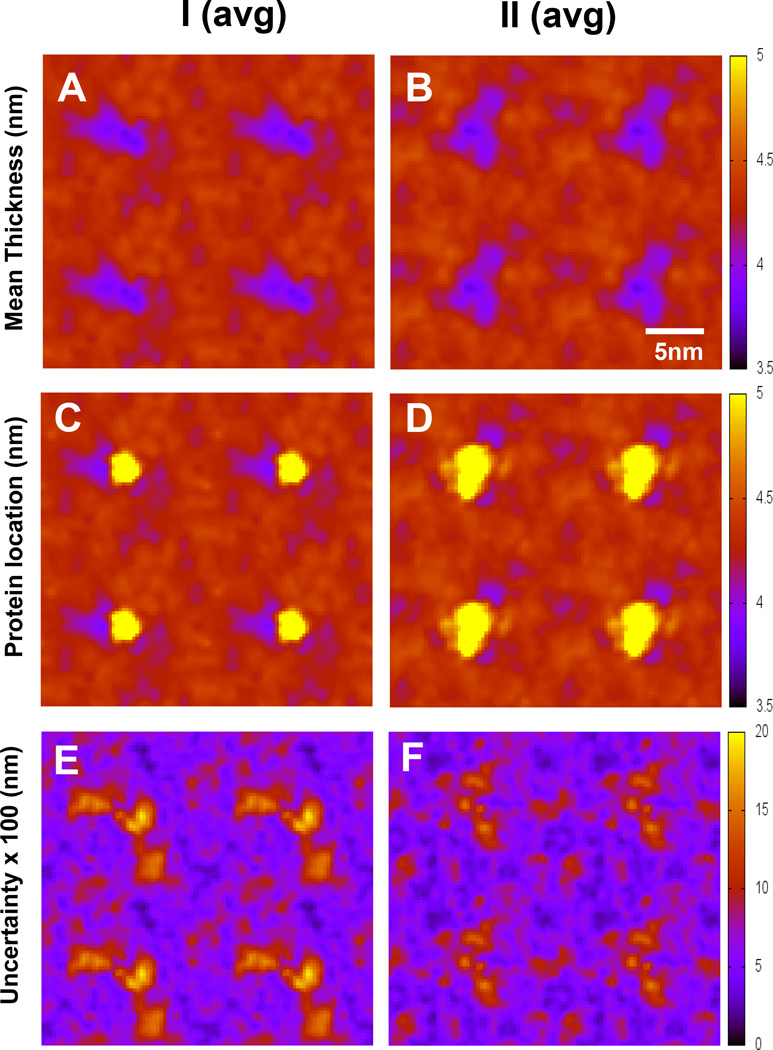
We have used coarse-grained (CG) and united atom (UA) molecular dynamics simulations to explore the mechanisms of protein orientational transition of a model peptide (Aβ42) in a phosphatidylcholine/cholesterol (PC/CHO) lipid bilayer. We started with an inserted state of Aβ42 containing a folded (I) or unfolded (II) K28-A42 lipid insertion domain (LID), which was stabilized by the K28-snorkeling and A42-anchoring to the PC polar groups in the lipid bilayer. After a UA-to-CG transformation and a 1000ns-CG simulation for enhancing the sampling of protein orientations, we discovered two transitions: I-to-"deep inserted" state with disrupted K28-snorkeling and II-to-"deep surface" state with disrupted A42-anchoring. The new states remained stable after a CG-to-UA transformation and a 200ns-UA simulation relaxation. Significant changes in the cholesterol-binding domain of Aβ42 and protein-induced membrane disruptions were evident after the transitions. We propose that the conformation of the LID regulates protein orientational transitions in the lipid membrane.


Figures

FIG. 1
FIG. 1. UA-to-CG mapping and CG simulations of protein/lipid/water/ion complexes
UA and CG structures of Aβ42 PC and CHO in the I (initial) and II (initial) II (initial) (D) complexes are shown. An orange ribbon (A, D) highlights the secondary structure of the UA protein, whereas yellow and pink spheres represent the side chain and backbone CG beads, respectively, of the CG protein. Blue, green and red arrows mark the residues D1, K28 and A42, respectively, of Aβ42. In CG-PC (A), the polar CG-beads in the headgroup (NC3 in green, PO4 in purple and GLY in pink) and the non-polar beads in the saturated (C16:0) sn-1 chain (4 blue beads) and mono-unsaturated (C18:1) sn-2 chain (four blue and one black beads) are shown. A single black bead represents the C=C of PC. In CG-CHO (A), 1 polar CG bead (ROH in red), 4 green CG beads for the non-polar fused rings and 2 blue beads for the non-polar acyl chain are shown. Representative CG simulation replicates (I-rep0 and II-rep0) before (B, E) and after (C, F) 1 µs CG simulations for the I (B, C) and II (E, F) complexes are shown. The polar NC3 (green) and PO4 (purple) beads of PC and the polar ROH (red) beads of CHO are highlighted, whereas the lines joining the other lipid CG-beads are given by gray (PC) and yellow (CHO) lines. CG water and ions were present in all CG simulations but are not shown.
FIG. 2
FIG. 2. CG-to-UA mapping and UA simulations of protein/lipid/water/ion complexes
Overlapping structures of Aβ42, PC and CHO in the representative CG I-rep0 and UA I-rep0-0 replicates (A), and Aβ42 in the representative CG II-rep0 and UA II-rep0-0 replicates (D) using CG-to-UA mapping are shown. Shown are representative UA structures, (I-rep0-0 and II-rep0-0), of two Aβ42/lipid/water/ion complexes before (B, E) and after (C, F) 200 ns UA simulations for the I (B, C) and II (E, F) complexes. Refer to the legends of Figure 1 for details of the atomic group labeling.
FIG. 3
FIG. 3. Protein orientational states and lipid/protein interactions in Aβ42/lipid/water/ion complexes
UA structures of inserted (A), deep inserted (B) and deep surface (C) states of Aβ42 in Aβ42/lipid/water/ion complexes. D1-N27 or non-LID (yellow) and K28-A42 or LID (orange) segments of the protein are rendered in surface representation. The polar phosphate (silver) and NC3 (blue) of all PC are shown. The annular (AL) lipids, AL-CHO (color spheres) and AL-PC (sticks), are shown. The average (avg) minimum distance between Aβ42 and CHO or PC across all repeated replicates for the last 50 ns as a function of residue position of Aβ42 in D (avg) (panel D), I (avg) (panel E) and II (avg) (panel F) are shown. The bars indicate standard errors. See Materials and Methods for details in averaging.
FIG. 4
FIG. 4. Transbilayer density profile of molecules in UA Aβ42/lipid/water/ion complexes
The number density vs. z distance of the I (initial) (A), II (initial) (B), I (avg) (C) and II (avg) (D) complexes are shown. The non-annular (nAL) and annular (AL) lipid and solvent groups are in dashed and solid lines, respectively. The structural groups are PC-PO4 in red, CHO-ROH in blue and solvent or W in black. The entire protein Aβ42 is in green and the K28- NH3 of Aβ42 in pink. Due to the large density differences among AL and nAL molecules, the number densities of protein and all AL molecules are magnified 10 times while K28-NH3 50 times. The average (avg) was across all repeated replicates for the last 50 ns of the I (C) or II (D) complexes. See Materials and Methods for details in averaging.
FIG. 5
FIG. 5. Protein orientational transition in CG Aβ42/lipid/water/ion complexes
Time evolution of the minimum distance between K28 of Aβ42 and PO4 of PC (K28-PO4) and between A42 of Aβ42 and NC3 of PC (A42-NC3) of representative replicates I-rep2 (A) and II-rep2 (B) as a function of CG simulation time for the upper (red) and lower (black) lipid monolayers are shown.
FIG. 6
FIG. 6. Protein orientational transition in UA Aβ42/lipid/water/ion complexes
Time evolution of the minimum distanc between K28 of Aβ42 and PO4 of PC (K28-PO4), between K28 of Aβ42 and ROH of CHO (K28-ROH) and between A42 of Aβ42 and NC3 of PC (A42-NC3) of representative replicates I-rep0-1 (A), I-rep1-1 (B), I-rep2-1 (C) and II-rep1-1 (D) as a function of UA simulation time for the upper (red) and lower (black) lipid monolayers.
FIG. 7
FIG. 7. K28 hydrogen bonding profile in UA Aβ42/lipid/water/ion complexes
The percentage of time that the NH3 polar group of the side chain of K28 (donor) formed a hydrogen bond with an acceptor group over the last 50 ns of the 200 ns UA simulations of I (initial), II (initial), I (avg) and II (avg) are given. The average (avg) was across all repeated replicates of I or II complex. See Materials and Methods for details in averaging.
FIG. 8
FIG. 8. K28 and A42 hydrogen bonding partners in UA Aβ42/lipid/water/ion complexes
Representative hydrogen bonding partners of K28 and A42 of Aβ42 with the hydrogen bonding partners, water (w), polar groups of lipids (PC and CHO), and protein residues (A21, V24, N27) are shown for I (initial) (A) and II (initial) (B) and representative replicates: I-rep2-1 (C), I-rep1-1 (D), I-rep1-0 (E) and II-rep3-0 (F), are shown. The protein orientational state of each structure is identified.
FIG. 9
FIG. 9. Order parameters of PC chains in UA Aβ42/lipid/water/ion complexes
Order parameters (S) of sn-1 (black) and sn-2 (blue) chains of a representative replicate I-rep-0-0 as a function of chain carbon number in the upper (A) and lower (B) monolayers. Both the annular (AL) (filled circle) and non-annular (nAL) (open circle) lipids are shown. The means and standard errors (error bars) over the last 50 ns of the simulation are shown. Order parameter difference (ΔS = S of AL – S of nAL) of the sn-1 (C) and the sn-2 (D) chains in the upper (black open circle) and lower (black filled circle) monolayers of I (avg) complex and that in the open (red open circle) of II (avg) complex are shown. The calculations were over the last 50 ns of the simulations with the mean and standard errors obtained from the 8 independent replicates of I or II complex.
FIG. 10
FIG. 10. Lipid bilayer thickness maps of UA Aβ42/lipid/water/ion complexes
Lipid bilayer thickness maps of I (avg) and II (avg) complexes without (A, B) and with overlays (C, D) of protein locations (yellow) are shown. The uncertainty maps (E, F) of thickness based on the standard errors of the means are also given. The calculations were over the last 50 ns of the simulations with means and standard errors obtained from 8 independent replicates.
FIG. 11
FIG. 11. Proximity of K28 and lipid headgroup in UA Aβ42/lipid/water/ion complexes
The transbilayer density profiles (A) of PO4 of nAL-PC, ROH of nAL-CHO, and NH3 of K28 of Aβ42 of each simulation replicate of the I complex are shown. Plots of the minimum distance between K28 and ROH of CHO or K28-ROH (black circle) and between K28 and PO4 of PC or K28-PO4 (open circle) as a function of helix % of D1-N27 (B), K28-A42 (C) and D1-A42 (D) segments of Aβ42 are given. The calculations were over the last 50 ns of the simulations with the standard errors (error bars) shown.

Similar articles

Cited by

References

    1. Cohen FE, Kelly JW. Therapeutic approaches to protein-misfolding diseases. Nature. 2003;426:905–909. - PubMed
    1. Groves JT, Kuriyan J. Molecular mechanisms in signal transduction at the membrane. Nat. Struct. Mol. Biol. 2010;17:659–665. - PMC - PubMed
    1. Peetla C, Stine A, Labhasetwar V. Biophysical interactions with model lipid membranes: applications in drug discovery and drug delivery. Mol. Pharm. 2009;6:1264–1276. - PMC - PubMed
    1. Zhang YJ, Shi JM, Bai CJ, Wang H, Li HY, Wu Y, Ji SR. Intra-membrane oligomerization and extra-membrane oligomerization of amyloid-beta peptide are competing processes as a result of distinct patterns of motif interplay. J. Biol. Chem. 2012;287:748–756. - PMC - PubMed
    1. Haass C, Selkoe DJ. Soluble protein oligomers in neurodegeneration: lessons from the Alzheimer's amyloid beta-peptide. Nat. Rev. Mol. Cell Biol. 2007;8:101–112. - PubMed

Publication types