. 2015 Sep:68:131-42.
doi: 10.1016/j.mcn.2015.07.002. Epub 2015 Jul 9.

Excessive Wnt/beta-catenin signaling promotes midbrain floor plate neurogenesis, but results in vacillating dopamine progenitors

Affiliations

Excessive Wnt/beta-catenin signaling promotes midbrain floor plate neurogenesis, but results in vacillating dopamine progenitors

Navid Nouri et al. Mol Cell Neurosci. 2015 Sep.

Abstract

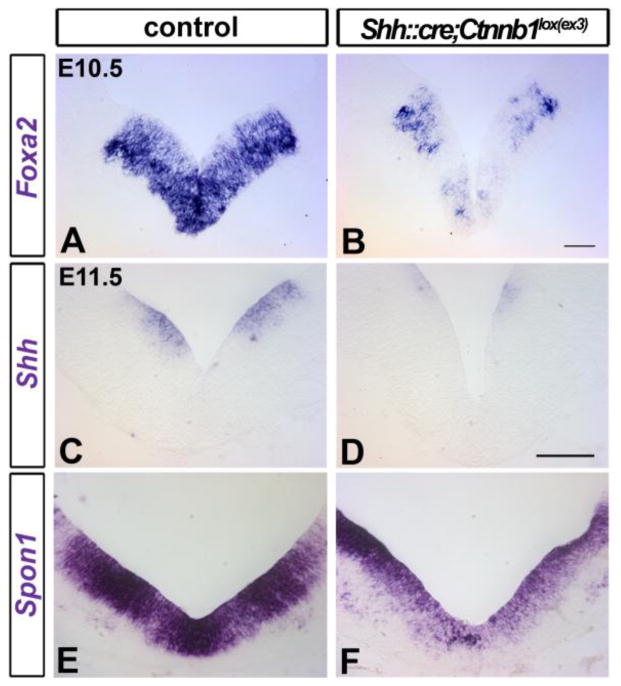
The floor plate (FP), a ventral midline structure of the developing neural tube, has differential neurogenic capabilities along the anterior-posterior axis. The midbrain FP, unlike the hindbrain and spinal cord floor plate, is highly neurogenic and produces midbrain dopaminergic (mDA) neurons. Canonical Wnt/beta-catenin signaling, at least in part, is thought to account for the difference in neurogenic capability. Removal of beta-catenin results in mDA progenitor specification defects as well as a profound reduction of neurogenesis. To examine the effects of excessive Wnt/beta-catenin signaling on mDA specification and neurogenesis, we have analyzed a model wherein beta-catenin is conditionally stabilized in the Shh+domain. Here, we show that the Foxa2+/Lmx1a+ domain is extended rostrally in mutant embryos, suggesting that canonical Wnt/beta-catenin signaling can drive FP expansion along the rostrocaudal axis. Although excess canonical Wnt/beta-catenin signaling generally promotes neurogenesis at midbrain levels, less tyrosine hydroxylase (Th)+, mDA neurons are generated, particularly impacting the Substantia Nigra pars compacta. This is likely because of improper progenitor specification. Excess canonical Wnt/beta-catenin signaling causes downregulation of net Lmx1b, Shh and Foxa2 levels in mDA progenitors. Moreover, these progenitors assume a mixed identity to that of Lmx1a+/Lmx1b+/Nkx6-1+/Neurog1+ progenitors. We also show by lineage tracing analysis that normally, Neurog1+ progenitors predominantly give rise to Pou4f1+ neurons, but not Th+ neurons. Accordingly, in the mutant embryos, Neurog1+ progenitors at the midline generate ectopic Pou4f1+ neurons at the expense of Th+ mDA neurons. Our study suggests that an optimal dose of Wnt/beta-catenin signaling is critical for proper establishment of the mDA progenitor character. Our findings will impact embryonic stem cell protocols that utilize Wnt pathway reagents to derive mDA neuron models and therapeutics for Parkinson's disease.

Keywords: Floor plate; Lmx1b; Midbrain dopaminergic neurons; Wnt/beta-catenin.


Figures

Figure 1
Figure 1. Stabilization of beta–catenin in the Shh+ midbrain and hindbrain floor plate results in drastically increased Wnt/beta–catenin signaling
(A–D) E10.5 coronal midbrain (A and C) and hindbrain (B and D) sections were labeled with X-gal to determine Axin2lacZ expression in control (Axin2lacZ; A and B) and mutant (Shh::cre;Ctnnb1lox(ex3),Axin2lacZ; C and D) embryos. (A and C) In the ventral midbrain, intense X-gal+ labeling is present in the mutant compared to the moderate X-gal labeling in the control. (B and D) In the ventral hindbrain, the mutant floor plate is characterized by a substantial number of Xgal+ cells in comparison to the corresponding region in the control, which has few to no Xgal+ cells. Black dotted lines delineate the midbrain and hindbrain parenchyma. mesenchymal cells surrounding the neural tube are Xgal+ in all sections shown. Scale bars: 50μm.
Figure 2
Figure 2. Sustained Wnt/beta–catenin signaling results in a rostral expansion of the Foxa2 domain
(A–C) E12.5 sagittal sections from control and Shh::cre;Ctnnb1lox(ex3) mutant embryos were co-labeled with Th (A and B), Foxa2 (A, A′, B, and B′), Lmx1a (A, A″, B, and B″). Mutant sections show an expanded diencephalic ventricle (A and B; see also Suppl. Fig 1) The number of Th+ mDA neurons (green) are severely reduced, particularly in rostral regions in the mutant (arrowheads) when compared to control. (A and B). Foxa2 expression extends rostrally, to the anterior hypothalamus (B and bottom arrowhead in B′) in contrast to the sharp Foxa2 limit in the posterior hypothalamus in controls (A and bottom arrowhead in A′). (A, A″, B and B″) In mutants, similar to the anterior shift of Foxa2, Lmx1a expression extends rostrally (B and bottom arrowhead in B″) albeit at reduced levels. (C) A significant rostral expansion (p< 0.001) of the Foxa2 domain is observed in mutants (544μm ± 4.62 s.e.m.) compared to controls (control 308μm ± 10.6 s.e.m.) when measured from the ZLI/FP boundary (Arrowheads in A′ and B′). ZLI, zona limitans intrathalamica; FP, floor plate. Anterior is to the left, posterior to the right, dorsal up, and ventral down. Scale bars: 100μm in A and B.
Figure 3
Figure 3. Constitutively active Wnt/beta–catenin signaling results in a severe reduction in numbers of Th+ neurons
E12.5 (A and B) and E18.5 (C and D) coronal midbrain sections were labeled with Th antibody in control (A and C) and Shh::cre;Ctnnb1lox(ex3) mutant (B and D) embryos. (A and B) Note an apparent loss of Th+ cells in the mutant compared to the control at E12.5. (C and D) At E18.5, the developing Substantia Nigra pars compacta (SNpc; right arrows) is particularly affected, but the developing Ventral Tegmental Area is less affected (VTA; left arrows). (E) A significant decrease in the total number of Th+ cells per section at E12.5 is observed rostrally (p<0.001) and caudally (p<0.05) in the mutants (n=3; rostral 133 ± s.e.m 15; caudal 114 ± s.e.m 22) in comparison to the control (n=3; rostral 370 ± s.e.m 35; caudal 238 ± s.e.m 39). Scale bars: 50μm in A–D.
Figure 4
Figure 4. Excessive Wnt/beta–catenin signaling results in increased proliferation and number of mDA progenitors exiting the cell-cycle
(A–C) short pulse BrdU labeling at E10.5 reveals no change in total BrDU+ numbers (not shown) or the labeling index (BrdU+/DAPI+) of the Lmx1a and Nkx6-1 domains between controls and mutants. (D–F) Short pulse BrdU labeling at E12.5. (D–F) An increase (p<0.05) in the labeling index at E12.5 of Shh::cre;Ctnnb1lox(ex3) mutants (n=3; 53.4% ± 1.2 s.e.m) was observed when compared with controls (n=3; 37% ± 3.3 s.e.m) within the Lmx1a+ domain. A significant increase (p<0.001) in the total number of BrdU+ cells per section was observed in mutants (n=3; 284 ± 28 s.e.m) when compared to controls (n=3; 135 ± 10 s.e.m). (G–I) BrdU was administered at E12.5 and embryos harvested at E13.5 to assess the number of mDA progenitors that have exited the cell-cycle between these two time points. (G and H) Sections were labeled with Ki67 and BrdU antibodies. Dotted lines indicate the dopamine field determined by Lmx1a labeling on the same or adjacent sections (not shown). In this Lmx1a+ dopaminergic field, the cells were counted and quantified in I. (I) A significant increase (p<0.01) in the total number of BrdU+ cells per section was observed in mutants (n=3; 258.1 ± 8.3 s.e.m.) compared to controls (n=3; 184.4 ± 9.0 s.e.m.). In addition, an increase (p<0.05) in the number of post-mitotic, BrdU+/Ki67− cells was detected in mutants (n=3; 161.6 ± 5.8 s.e.m) compared to controls (n=3; 119.5 ± 9.2 s.e.m). The quit fraction (BrdU+;Ki67-/BrdU+ total) was not significantly altered at this stage. (L–N) E15.5 coronal midbrain sections were labeled with Lmx1a and HuC/D antibodies in the control (L) and mutant (M). (N) A significant increase (p<0.01) in the average number of Lmx1a+ cells per section is observed in the mutants (n=3; 789 ± 67 s.e.m.) in comparison to controls (n=3; 503 ± 51 s.e.m.). Scale bars: 50μm in A, B, D, and E; 100μm in G, H, J and K.
Figure 5
Figure 5. Excessive Wnt/beta–catenin signaling results in downregulation of floor plate genes
E10.5 (A and B) and E11.5 (C–F) coronal midbrain sections were labeled with Foxa2, Shh and Spon1 riboprobes in control (A, C, and E) and Shh::cre;Ctnnb1lox(ex3) mutant embryos (B, D, and F). Expression of Foxa2 (A and B), Shh (C and D), and Spon1 (E and F) is reduced in the mutants. Note that in most mutants at this age, and more prominent at later stages, a deeper indentation at the ventral midline is observed, and the angle of ventrolateral midbrain is altered with respect to the midline. Scale bars: 50μm in A and B; 100μm in C–F.
Figure 6
Figure 6. Excessive Wnt/beta–catenin signaling results in vacillating mDA progenitors
E10.5 (A–J), E11.5 (K–P) and E12.5 (Q and R) coronal midbrain sections were labeled with indicated antibodies (K–N, Q and R) or Lmx1b, Wnt1, Wnt5a, Aldh1a1, Nkx6-1 and Neurog1 riboprobes in control (A, C, E, G, I, and O) and Shh::cre;Ctnnb1lox(ex3) mutant embryos (B, D, F, H, J, and P). Lmx1b, Wnt1, Wnt5a, and Aldh1a1 are all downregulated (B, D, F, and H; in the case of Aldh1a1 n=5/7 mutants) while Lmx1a is minimally if at all reduced (N). Increased midline expression of Nkx6-1 (J and N) and Neurog1 (P) in mDA progenitors can be seen in the mutant embryos. In controls, we observed very low levels of Nkx6-1 expression (I) and occasional Neurog1+ cells (O) at the midline. Red (K, L, Q, and R) dotted lines indicate a separation between the ventricular (vz) and mantle zones (mz). White (I and J) and black (O and P) dotted lines delineate the dopaminergic field. Scale bars: 50 μm for A–J and 100 μm for K–R.
Figure 7
Figure 7. Maintenance of Lmx1b signaling alters ventral midbrain patterning
E12.5 (A–F) coronal midbrain sections were labeled with Lmx1b (A and B), Wnt1 (C and D), and Lmx1a (E and F) riboprobes in control and Shh::Cre,Lmx1bOE mutant embryos. Lmx1b is expanded dorsally in mutants (arrowhead in B) when compared to control. Similarly, Wnt1 is increased in the ventricular zone (arrowhead in D) of the ShhCre::Lmx1bOE mutant. The Lmx1a expression boundary also expands dorsally as a consequence of increased Lmx1b expression in mutants (arrowhead in F) when compared with control. Scale bars: 50μm A–F.
Figure 8
Figure 8. In normal embryos, Neurog1+ progenitors give rise to Pou4f1+ red nucleus neurons
(A) E10.5 coronal midbrain sections were labeled with Neurog1 riboprobe. Note that Neurog1 is expressed in the progenitor region (arrow) immediately adjacent to the predominantly Neurog1– midline (arrowhead) that corresponds to the position of mDA progenitors. (B–F) Lineage of Neurog1 progenitors in Neurog1::creERT2,Ai9 embryos. Tamoxifen was administered at E9.75 and embryos were harvested at E12.75. Consistent with the Neurog1 expression pattern (A), tdTomato+ cells can be seen in the region (Arrows; B and C) just lateral to the largely negative medial region (Arrowheads; B and C) where mDA progenitors and neurons are situated. Several of these Neurog1+ descendants are Pou4f1+ red nucleus neurons (arrows; C–F). C is a higher magnification of the right side of the ventral midline roughly corresponding to the area indicated by the arrow and arrowhead in B. D–F panels show high magnification confocal images of the region corresponding to the area indicated by the arrow in C. Separate channels and the merged image are shown in D–F. The section in B is counterstained with DAPI to visualize nuclei. Scale bars: 100μm in A; 200μm in B; 50μm in C; 10μm in D–F.
Figure 9
Figure 9. Excessive Wnt/beta–catenin signaling increases the number of Pou4f1+ neurons within the midbrain dopaminergic field
E12.5 (A–F) and E13.5 (H–U) coronal midbrain sections were labeled with indicated antibodies in control (A, C, E, H, J, L, and N–Q) and Shh::cre;Ctnnb1lox(ex3) mutant embryos (B, D, F, I, K, M, and R–U). Note that Pou4f1+/Lmx1b+ cells appear to be in excess in the mutant (arrowheads in B and D) comparing to the control (arrows in A and C) within the dopaminergic field while Th+ neurons are reduced in the mutant. White dotted lines (A–D) delineate the dopaminergic field. Images were taken from the same section triple-labeled for Pou4f1, Lmx1b, and Th and are shown in a two-color combination. Insets in E and F are high magnification confocal images of the ventral midline in control and mutants, respectively. (G) A significant increase (p<0.001) in a total number of Brn3a+ cells per section within the dopaminergic field is observed in the mutants (n=3; rostral 347 ± s.e.m 32; caudal 24 ± s.e.m 7) in comparison to the control (n=4; rostral 28 ± s.e.m 10; caudal 0.2 ± s.e.m 0.1). (H–M) Confocal images were taken from the same E13.5 section triple-labeled for Pou4f1, Lmx1a, and Th and shown in a two-color combination. At E13.5, increased numbers of Pou4f1+ cells persist at the ventral midline in the mutants (I). Note that these midline Pou4f1+ cells express Lmx1a (K) but not Th (M). (R–U) At the mutant midline, Pou4f1 (arrowheads in S) and Lmx1a (arrowheads in R) are expressed in the same cells (arrowheads in U), but do not express Th (blue). Scale bars: 50μm in A–F and H–M; 10μm in N–U.

Similar articles

Cited by

References

    1. Alves dos Santos MT, Smidt MP. En1 and Wnt signaling in midbrain dopaminergic neuronal development. Neural development. 2011;6:23. - PMC - PubMed
    1. Anderegg A, Lin HP, Chen JA, Caronia-Brown G, Cherepanova N, Yun B, Joksimovic M, Rock J, Harfe BD, Johnson R, Awatramani R. An Lmx1b-miR135a2 regulatory circuit modulates Wnt1/Wnt signaling and determines the size of the midbrain dopaminergic progenitor pool. PLoS genetics. 2013;9:e1003973. - PMC - PubMed
    1. Andersson E, Tryggvason U, Deng Q, Friling S, Alekseenko Z, Robert B, Perlmann T, Ericson J. Identification of intrinsic determinants of midbrain dopamine neurons. Cell. 2006;124:393–405. - PubMed
    1. Blaess S, Bodea GO, Kabanova A, Chanet S, Mugniery E, Derouiche A, Stephen D, Joyner AL. Temporal-spatial changes in Sonic Hedgehog expression and signaling reveal different potentials of ventral mesencephalic progenitors to populate distinct ventral midbrain nuclei. Neural Dev. 2011;6:29. - PMC - PubMed
    1. Blaess S, Corrales JD, Joyner AL. Sonic hedgehog regulates Gli activator and repressor functions with spatial and temporal precision in the mid/hindbrain region. Development. 2006;133:1799–1809. - PubMed

Publication types

MeSH terms