. 2015 Aug 4;23(8):1382-1393.
doi: 10.1016/j.str.2015.06.003. Epub 2015 Jul 9.

The RAS-Binding Domain of Human BRAF Protein Serine/Threonine Kinase Exhibits Allosteric Conformational Changes upon Binding HRAS

Affiliations

The RAS-Binding Domain of Human BRAF Protein Serine/Threonine Kinase Exhibits Allosteric Conformational Changes upon Binding HRAS

James M Aramini et al. Structure. .

Abstract

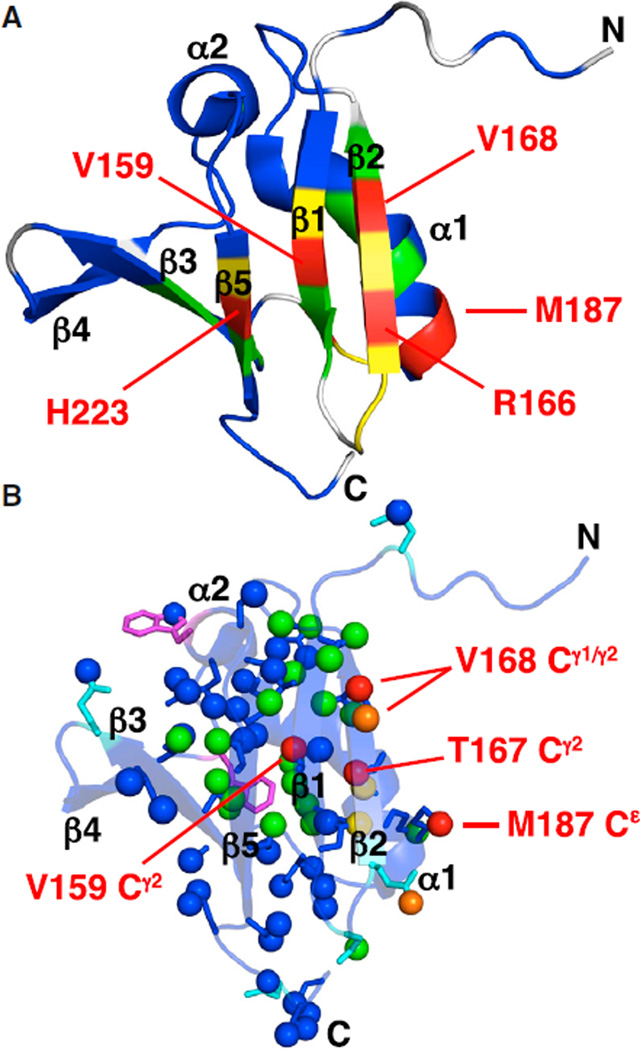
RAS binding is a critical step in the activation of BRAF protein serine/threonine kinase and stimulation of the mitogen-activated protein kinase signaling pathway. Mutations in both RAS and BRAF are associated with many human cancers. Here, we report the solution nuclear magnetic resonance (NMR) and X-ray crystal structures of the RAS-binding domain (RBD) from human BRAF. We further studied the complex between BRAF RBD and the GppNHp bound form of HRAS in solution. Backbone, side-chain, and (19)F NMR chemical shift perturbations reveal unexpected changes distal to the RAS-binding face that extend through the core of the RBD structure. Moreover, backbone amide hydrogen/deuterium exchange NMR data demonstrate conformational ensemble changes in the RBD core structure upon complex formation. These changes in BRAF RBD reveal a basis for allosteric regulation of BRAF structure and function, and suggest a mechanism by which RAS binding can signal the drastic domain rearrangements required for activation of BRAF kinase.


Figures

Figure 1
Figure 1. Structure of BRAF RBD
(A) Sequence alignment of the RAS-binding domains from the three human RAF kinase isoforms. Sequences, obtained from the RAF-like RBD protein domain family PF02196 (Finn et al., 2014), were aligned using Clustal Omega (Sievers et al., 2011) and the sequence alignment was rendered using ESPript 3.0 (Robert and Gouet, 2014). Boxed residues represent identical (white font, highlighted in red) and similar (red font) amino acid conservation. Residue numbering for BRAF RBD and secondary structural elements from its solution NMR structure (PDB: 2L05) are drawn above the alignment. (B) Final ensemble of 20 conformers comprising the solution NMR structure of BRAF RBD (PDB: 2L05). Residues 149–232 are shown. (C) X-Ray crystal structure of BRAF RBD (PDB: 3NY5). Residues 151–233 are shown; dotted lines represent missing electron density in the loop (L4) between strands β3 and β4. (D) ConSurf conserved residue analysis for the entire PF02196 protein domain family (Pfam 27.0; 710 sequences) rendered on the solution NMR structure of BRAF RBD (residues 155–227). Residue coloring, reflecting the degree of residue conservation across the family, ranges from magenta (highly conserved) to cyan (variable). (E) Superposition of BRAF RBD crystal structure (blue; residues 153–228) and the crystal structure of CRAF RBD (residues 54–131) in complex with HRAS (orange; PDB: 4G0N) (Fetics et al., 2015). The structure of HRAS has been omitted. All structures were rendered using PyMOL (PyMOL Molecular Graphics System, Version 1.4; Schrödinger LLC).
Figure 2
Figure 2. Assessment of Phosphorylation and Oligomerization States of Free and Complexed BRAF RBD and HRAS
(A) 1D 31P NMR spectra at 298 K of 0.6 mM HRAS-GDP (prior to alkaline phosphatase treatment), 0.6 mM HRAS-GppNHp after alkaline phosphatase treatment and reconstitution with GTP analog, and 0.3 mM [13C,15N]-BRAF RBD-HRAS-GppNHp. The 31P resonances for HRAS-bound GppNHp are labeled following the latest literature assignments (Spoerner et al., 2005). (B) Analytical gel filtration/static light-scattering data for 0.6 mM [13C,15N]-BRAF RBD-HRAS-GppNHp at pH 7.5. Plots of relative differential refractive index (dn/dc) and experimental molecular weight (34.9 kDa) are shown in blue and red, respectively. The expected molecular weight of the complex, including isotope enrichment, nonnative residues, and the nucleotide, is 31.8 kDa. (C) Plots of rotational correlation time (τc) determined from 15N T1 and T2 relaxation data as a function of protein molecular weight for 0.3–0.4 mM [U-13C,15N]-BRAF RBD (blue), [15N]-HRAS-GDP (magenta), and [13C,15N]-BRAF RBD-HRAS-GppNHp (green) at 298 K and pH 7.5; known monomeric proteins solved in the Northeast Structural Genomics project are shown in red. (D) Plots of 60.82 MHz 15N T1 (left) and T2 (right) relaxation data for [U-13C,15N]-BRAF RBD (blue), [U-15N]-HRAS-GDP (magenta), and [U-13C,15N]-RBD-HRAS-GppNHp (green) at pH 7.5 and 298 K.
Figure 3
Figure 3. NMR Chemical Shift Perturbations in BRAF RBD Resulting from HRAS Binding
Plots of (A) backbone amide (ΔδNH) and (B) carbonyl (ΔδCO) CSPs versus residue number for BRAF RBD. Mean CSP values are indicated by blue lines, and residues exhibiting the largest CSPs are labeled. Secondary structural elements in BRAF RBD (PDB: 2L05) are shown above the plots.
Figure 4
Figure 4. Key Interfacial Residues in CRAF RBD-HRAS Structure
(A) Conserved residues involved in intermolecular strand-strand hydrogen bonding in the crystal structure of CRAF RBD-HRAS (PDB: 4G0N) (Fetics et al., 2015). Residues R67 and V69 in CRAF correspond to R166 and V168 in BRAF. (B) View from the same structure showing the environment around the C terminus of helix α1 from CRAF RBD and the buried carbonyl of V88 (corresponding to M187 in BRAF). Hydrogen atoms were added onto the structure using MolProbity 4.1 (Davis et al., 2007). Structures were rendered using PyMOL.
Figure 5
Figure 5. HRAS-Induced CSPs Mapped onto the Structure of BRAF RBD
(A) Backbone amide CSPs (ΔδNH) mapped onto the solution NMR structure of BRAF RBD. Residues in the structure are colored according to the magnitude of their CSP compared with the mean, as follows: blue, CSP < mean; green, mean < CSP < mean + 1σ yellow, mean + 1σ < CSP < mean + 2σ; red, CSP > mean + 2σ (mean CSP = 0.1 ppm; σ = 0.1 ppm, excluding major outliers). (B) Methyl (ΔδMe) and side-chain NH (ΔδNH) CSPs mapped onto the solution NMR structure of BRAF RBD. Methyl carbon and side-chain nitrogen atoms are represented as spheres, and colored using the same scheme as in (A) (mean CSP = 0.06 ppm; σ = 0.07 ppm, excluding M187). Side-chain resonances present in the apoprotein spectra but not assigned in the complex are shown in orange. Structures were rendered using PyMOL.
Figure 6
Figure 6. 19F NMR as a Probe for HRAS Binding to BRAF RBD
(A) Locations of the two 5-F-Trp residues in the NMR structure of BRAF RBD. The fluorine atoms are shown as magenta spheres. The secondary structure elements were rendered (PyMOL) with some transparency to completely show the buried W210 side chain. (B) Assignment of the 19F signals from 0.45 mM 5-F-Trp-labeled BRAF RBD using the solvent-induced isotope shift effect. Dotted lines indicate the shift of the 19F signal for W216 with increasing percentage of 2H2O in the buffer. (C) Titration of 0.2 mM 5-F-Trp-labeled BRAF RBD with HRAS-GppNHp monitored by 19F NMR at 293 K. Resonances for W210 in the apo and bound states are labeled with a and b, respectively.
Figure 7
Figure 7. Backbone Amide Hydrogen/Deuterium Exchange NMR Reveals Changes in the Free Energy Landscape of BRAF RBD upon HRAS Binding
(A) Stacked bar graphs of stabilization free energies (ΔGHX) computed from backbone amide exchange rates (kex) versus sequence for apo (red, top) and complexed (blue, bottom) BRAF RBD. Secondary structural elements in BRAF RBD are shown above the plots. (B) Free energies of amide exchange (ΔGHX) mapped onto the solution NMR structure of apo (left) and complexed (right) BRAF RBD. Residues in each structure are colored as a function of ΔGHX (kcal/mol) as follows: red, <5; yellow, 5 < ΔGHX < 6; green, 6 < ΔGHX < 7; cyan, 7 < ΔGHX < 8; blue, >8. Increasing ΔGHX correlates with increasing amide protection from exchange. (C) Ratios of backbone amide exchange rates for apo (kexapo) and HRAS-bound (kexcomplex) BRAF RBD mapped onto its solution NMR structure (residues 154–228 shown). In cases where the exchange rate was too fast to be accurately measured, an upper limit of kex = 0.001 s−1 was assumed. Residues are colored as a function of ln(kexapo/kexcomplex) as follows: red, <0; yellow, 0–1; green, 1–2; cyan, 2–3; blue, 3–4; purple, >4; white, not measureable in both states. The approximate position of HRAS encompassing the binding interface, based on the crystal structure of its complex to CRAF RBD (PDB: 4G0N) (Fetics et al., 2015), is shown in orange. Structures were rendered using PyMOL.

References

    1. Acton TB, Xiao R, Anderson S, Aramini J, Buchwald WA, Ciccosanti C, Conover K, Everett J, Hamilton K, Huang YJ, et al. Preparation of protein samples for NMR structure, function, and small-molecule screening studies. Methods Enzymol. 2011;493:21–60. - PMC - PubMed
    1. Adams PD, Grosse-Kunstleve RW, Hung LW, Ioerger TR, McCoy AJ, Moriarty NW, Read RJ, Sacchettini JC, Sauter NK, Terwilliger TC. PHENIX: building new software for automated crystallographic structure determination. Acta Crystallogr. D Biol. Crystallogr. 2002;58:1948–1954. - PubMed
    1. Aramini JM, Hamilton K, Ma LC, Swapna GV, Leonard PG, Ladbury JE, Krug RM, Montelione GT. 19F NMR reveals multiple conformations at the dimer interface of the nonstructural protein 1 effector domain from influenza A virus. Structure. 2014;22:515–525. - PMC - PubMed
    1. Ashkenazy H, Erez E, Martz E, Pupko T, Ben-Tal N. ConSurf 2010: calculating evolutionary conservation in sequence and structure of proteins and nucleic acids. Nucleic Acids Res. 2010;38:W529–W533. - PMC - PubMed
    1. Bahrami A, Assadi AH, Markley JL, Eghbalnia HR. Probabilistic interaction network of evidence algorithm and its application to complete labeling of peak lists from protein NMR spectroscopy. PLoS Comput. Biol. 2009;5:e1000307. - PMC - PubMed

Publication types

MeSH terms