. 2015 Jul 13:5:8477.
doi: 10.1038/srep08477.

Homoharringtonine induces apoptosis and inhibits STAT3 via IL-6/JAK1/STAT3 signal pathway in Gefitinib-resistant lung cancer cells

Affiliations

Homoharringtonine induces apoptosis and inhibits STAT3 via IL-6/JAK1/STAT3 signal pathway in Gefitinib-resistant lung cancer cells

Wei Cao et al. Sci Rep. .

Abstract

Tyrosine kinase inhibitors (TKIs) are mostly used in non-small cell lung cancer (NSCLC) treatment. Unfortunately, treatment with Gefitinib for a period of time will result in drug resistance and cause treatment failure in clinic. Therefore, exploring novel compounds to overcome this resistance is urgently required. Here we investigated the antitumor effect of homoharringtonine (HHT), a natural compound extracted from Cephalotaxus harringtonia, on Gefitinib-resistant NSCLC cell lines in vitro and in vivo. NCI-H1975 cells with EGFR T790M mutation are more sensitive to HHT treatment compared with that of A549 cells with wild type EGFR. HHT inhibited cells growth, cell viability and colony formation, as well as induced cell apoptosis through mitochondria pathway. Furthermore, we explored the mechanism of HHT inhibition on NSCLC cells. Higher level of interleukin-6 (IL-6) existed in lung cancer patients and mutant EGFR and TGFβ signal requires the upregulation of IL-6 through the gp130/JAK pathway to overactive STAT3, an oncogenic protein which has been considered as a potential target for cancer therapy. HHT reversiblely inhibited IL-6-induced STAT3 Tyrosine 705 phosphorylation and reduced anti-apoptotic proteins expression. Gefitinib-resistant NSCLC xenograft tests also confirmed the antitumor effect of HHT in vivo. Consequently, HHT has the potential in Gefitinib-resistant NSCLC treatment.


Figures
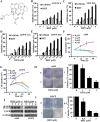
Figure 1
Figure 1. HHT inhibitory effects on NSCLC cells.
(A): Chemical structure of HHT. (BE): The inhibitory effects of HHT on A549 (B and C) and H1975 (D and E) cells evaluated by MTT assay. (F and G): Cell viability inhibition effect of HHT on A549 and H1975 cells analyzed by trypan blue exclusion assay. (H and I): The soft-agar colony formation assays of A549 and H1975 cells treated with HHT at indicated concentration. (J): A549 and H1975 cells were treated with HHT or Gefitinib for 24 h, lysed and the protein samples were analyzed by western blot with indicated antibodies. All the full-length blots are presented in Supplementary Figure 1.
Figure 2
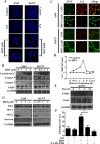
Figure 2. HHT induces apoptosis of NSCLC cells.
(A): A549 and H1975 cells were treated with Gefitinib (3 mM) or HHT at indicated concentrations for 24 h and stained with Hoechst 33258 assay. (B): A549 and H1975 cells were treated with HHT, lysed and the protein samples were analysed by western blot with indicated antibodies. (C): A549 and H1975 cells were treated with HHT at indicated concentration and the mitochondrial transmembrane potential (ΔΨ) was tested by confocal microscopy (Olympus Fluoview FV-1000, Tokyo, Japan). (D): Ca2+(i) was measured using Ca2+ indicator FLUO-4 (Invitrogen) by flow cytometry assay. (E): H1975 cells were treated with HHT for 24 h, lysed and analysed by western blot with indicated antibodies. (F): H1975 cells were pretreated with Z-VAD-FMK (20 mM) for 1 h and then treated with HHT at 2 mM for 24 h, and the inhibition rate was determined by MTT assay. The mean±SD of three independent experiments is shown. ***, P < 0.01. (G): A549 and H1975 cells were treated with HHT for 24 h, lysed and analysed by western blot with indicated antibodies. The blots shown are derived from multiple gels. Membrane was cut based on the molecular weight, probed with antibody of interest and band of interest is indicated with an arrow. All the full-length blots are presented in Supplementary Figure 2.
Figure 3
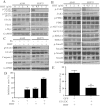
Figure 3. HHT supresses the phosphorylation of STAT3.
(A and B): A549 and H1975 cells treated with HHT, and the STAT3 phosphorylation and its target genes (A) and the upstream key efftors (B) were examined by western blot with indicated antibodies. (C): With pan-JAK inhibitor P6 (1 μM) and HHT (1 μM) treatment for 12 h, A549 and H1975 cell extracts were conducted western blot with indicated antibodies. (D): H1975 cells were treated with P6 and HHT together or alone and conducted MTT assay. (E): H1975 cells transfected with STAT3C or empty vector were treated with HHT and the inhibition rate was determined by MTT assay (P < 0.01). The blots shown are derived from multiple gels. Membrane was cut based on the molecular weight, probed with antibody of interest and band of interest is indicated with an arrow. All the full-length blots are presented in Supplementary Figure 2.
Figure 4
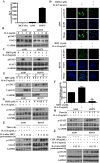
Figure 4. HHT inhibits IL-6-induced STAT3 phosphorylation a dose- and time-dependent manner.
(A): IL-6 production in MCF-10A, A549 and H1975 cells measured by ELISA. (B): Cells were starved and treated with different concentration IL-6. Protein samples were detected by western blot. (CE): Cells were starved and pretreated with PBS or HHT for 4 h followed by IL-6 treatment. Protein samples were detected by western blot (C), the distribution variation of phosphorylated STAT3 (Y705) were examined by immunofluorescence (D) and nuclear (N) and cytoplasmic (C) isolation assay (E). (F): pSTAT3-TA-luc plasmids were transfected into H1975 cells followed by treatment with HHT for 4 h. Then H1975 cells were treated with IL-6 for another 20 h. Firefly luciferase activities were assayed. (G): Cells were starved and pretreated with HHT at different concentrations followed by IL-6 stimulation. Protein samples were examined by western blot. (H): Cells were starved and treated with 4 μM (in A549 cells) or 2 μM (in H1975 cells) for indicated time points (0 h–4 h). After HHT pretreatment, cells were treated with 5 ng/mL IL-6 for 30 min. Protein samples were detected by western blot. (I): Cells were starved and pretreated with 4 μM (in A549 cells) or 2 μM (in H1975 cells) HHT for 4 h. Discard the HHT-containing medium and add fresh medium without HHT. After indicated incubation times (0 h–24 h), cells were treated with 5 ng/mL IL-6 for 30 min. Protein samples were detected by western blot. (J): Cells were starved and then pretreated with 4 μM (in A549 cells) or 2 μM (in H1975 cells) for 4 h. Discard the HHT-containing medium and add fresh medium containing protein synthesis inhibitor CHX (10 μg/mL) without HHT. After 12 h, cells were stimulated with 5 ng/mL IL-6 for 30 min. Protein samples were detected by western blot. The blots shown are derived from multiple gels. Membrane was cut based on the molecular weight, probed with antibody of interest and band of interest is indicated with an arrow. All the full-length blots are presented in Supplementary Figure 3.
Figure 5
Figure 5. Diagram of HHT blockage possible mechanism in NSCLC cells.
Figure 6
Figure 6. HHT exerts synergistic effect combining with docetaxel.
(A and B): A549 (A) and H1975 (B) cells were treated for 24 h with DTX and/or HHT, and then assessed by MTT assay. (C): A549 and H1975 cells were treated with HHT (2 μM or 0.25 μM), Gefitinib (2 mM), DTX (8 nM) alone or together for 24 h. The treated cells were collected, lysed and assessed by western blot with indicated antibodies. The blots shown are derived from multiple gels. Membrane was cut based on the molecular weight, probed with antibody of interest and band of interest is indicated with an arrow. All the full-length blots are presented in Supplementary Figure 4.
Figure 7
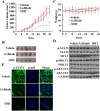
Figure 7. In vivo therapeutic efficiency of HHT on mice xenograft bearing human Gefitinib-resistant H1975 cells.
(A): Murine models were treated with Gefitinib or HHT and the tumor volumes were calculated every two days. (B): Images of xenograft tumors obtained from mice with different treatment after 3 weeks. (C) HHT treatment did not affect the murine model body weight. (D): Phosphorylated STAT3(Y705), MCL1 expression level, phosphorylated AKT and ERK of tumor sample lysates were analyzed by western blot with indicated antibodies. Vehicle (Line 1–3), Gefitinib (Line 4–6) and HHT (Line 7–9). The blots shown are derived from multiple gels. Membrane was cut based on the molecular weight, probed with antibody of interest and band of interest is indicated with an arrow. All the full-length blots are presented in Supplementary Figure 5. (E): Phosphorylated STAT3(Y705) expression was examined by tumor immunofluorescence staining.

References

    1. Siegel R., Ma J., Zou Z. & Jemal A. Cancer statistics, 2014. CA. Cancer J. Clin. 64, 9–29 (2014). - PubMed
    1. Ellison L. F. & Gibbons L. Five-year relative survival from prostate, breast, colorectal and lung cancer. Heal. Rep 13, 23–34 (2001). - PubMed
    1. Parkin D. M., Bray F., Ferlay J. & Pisani P. Estimating the world cancer burden: Globocan 2000. Int. J. Cancer 94, 153–156 (2001). - PubMed
    1. Scott A. M., Wolchok J. D. & Old L. J. Antibody therapy of cancer. Nat Rev Cancer 12, 278–287 (2012). - PubMed
    1. Maemondo M. et al.. Gefitinib or chemotherapy for non–small-cell lung cancer with mutated EGFR. N. Engl. J. Med. 362, 2380–2388 (2010). - PubMed

Publication types

MeSH terms