

Evaluation of Mediastinal Lymph Nodes in Sarcoidosis, Sarcoid Reaction, and Malignant Lymph Nodes Using CT and FDG-PET/CT
- PMID: 26166096
- PMCID: PMC4504536
- DOI: 10.1097/MD.0000000000001095
Evaluation of Mediastinal Lymph Nodes in Sarcoidosis, Sarcoid Reaction, and Malignant Lymph Nodes Using CT and FDG-PET/CT
Abstract
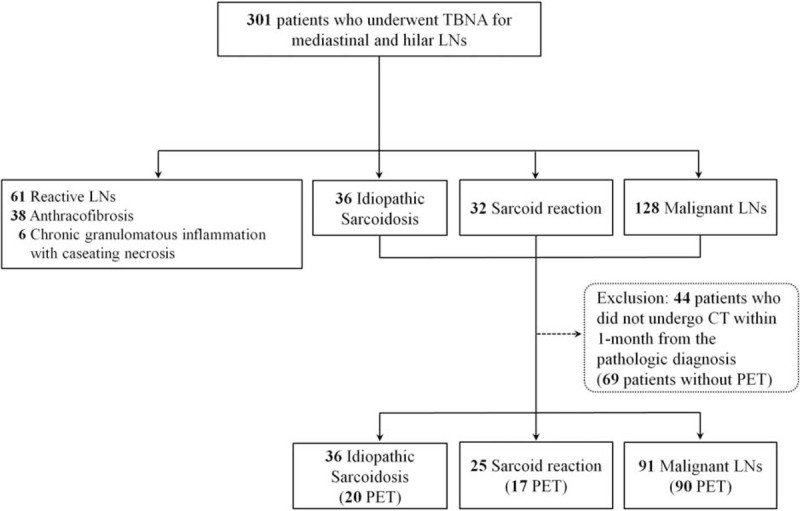
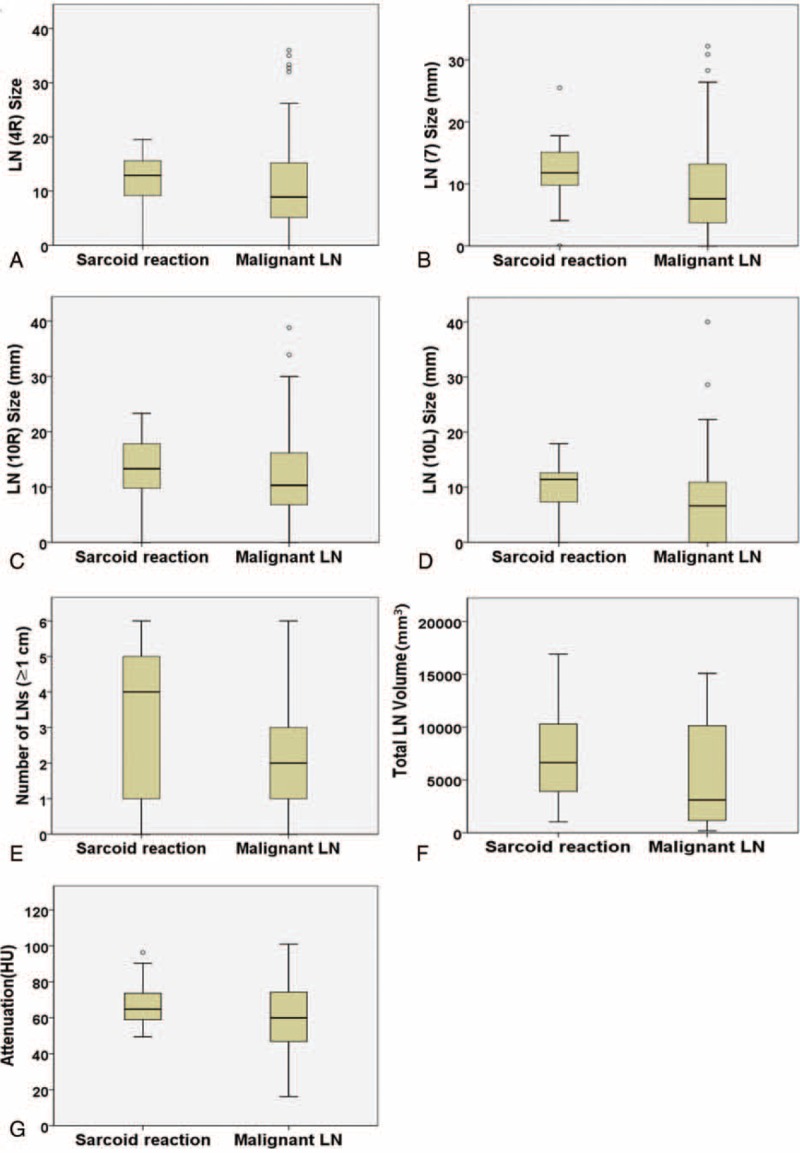
The aim of this study was to analyze the clinical, computed tomography (CT), and positron emission tomography (PET) findings of sarcoidosis, sarcoid reaction, and malignant lymph nodes (LNs) to the results of transbronchial LN aspiration and biopsy (TBNA).The TBNA results of mediastinal and hilar LNs of 152 patients in our hospital from July 2008 to March 2013 were retrospectively reviewed. Two independent radiologists measured the size and attenuation of LNs on CT and assessed the probability of the 3 categories: sarcoidosis (n = 36), sarcoid reaction (n = 25), or malignant LNs (n = 91). The total volume and attenuation of LNs were measured using Image J (NIH). The median maximum standardized uptake value (maxSUV) of the 3 mediastinal and hilar LNs on PET/CT was obtained.There was no significantly different CT finding between sarcoidosis and sarcoid reaction. Multivariate analysis showed that the age, total volume of LNs, and number of enlarged LNs significantly differed between sarcoid reaction and malignant LNs. Sarcoid reaction tends to be occurred in young patients (P = 0.007), the total volume of LNs was smaller (P = 0.04) than that of malignant LNs, and there were significantly more LNs >1 cm (P = 0.005). The median maxSUV of the 3 highest SUVs of the LNs did not significantly differ between the 3 entities.
Conflict of interest statement
The authors have no conflicts of interest to disclose.
Figures
References
-
- Criado E, Sanchez M, Ramirez J, et al. Pulmonary sarcoidosis: typical and atypical manifestations at high-resolution CT with pathologic correlation. Radiographics 2010; 30:1567–1586. - PubMed
-
- Brincker H. Sarcoid reactions in malignant tumours. Cancer Treat Rev 1986; 13:147–156. - PubMed
-
- Steinfort DP, Irving LB. Sarcoidal reactions in regional lymph nodes of patients with non-small cell lung cancer: incidence and implications for minimally invasive staging with endobronchial ultrasound. Lung Cancer 2009; 66:305–308. - PubMed
-
- Hunt BM, Vallieres E, Buduhan G, et al. Sarcoidosis as a benign cause of lymphadenopathy in cancer patients. Am J Surg 2009; 197:629–632.discussion 632. - PubMed
-
- Mapelli P, Mangili G, Picchio M, et al. Sarcoidosis mimicking metastatic gynaecological malignancies: a diagnostic and therapeutic challenge? Rev Esp Med Nucl Imagen Mol 2013; 32:314–317. - PubMed
MeSH terms
Substances
LinkOut - more resources
Full Text Sources
Medical
