. 2015 Jul 27;34(2):152-67.
doi: 10.1016/j.devcel.2015.06.011. Epub 2015 Jul 9.

CNS myelin wrapping is driven by actin disassembly

Affiliations

CNS myelin wrapping is driven by actin disassembly

J Bradley Zuchero et al. Dev Cell. .

Erratum in

  • Dev Cell. 2015 Sep 14;34(5):608. Leonoudakus, Dmitri [corrected to Leonoudakis, Dmitri]

Abstract

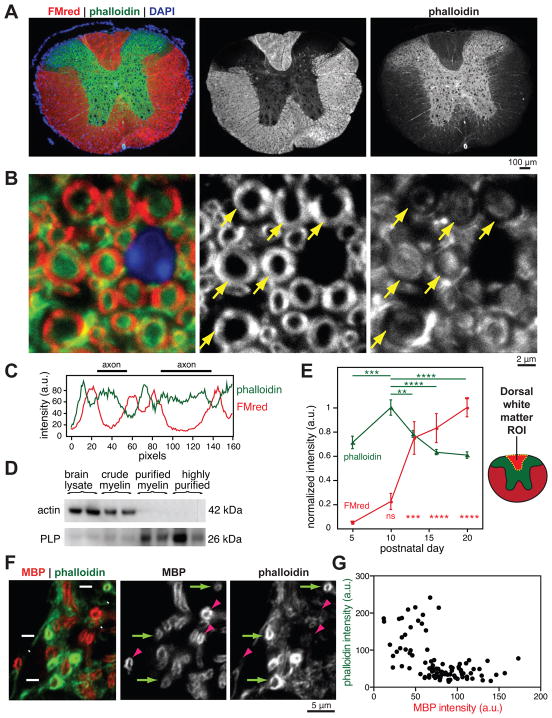
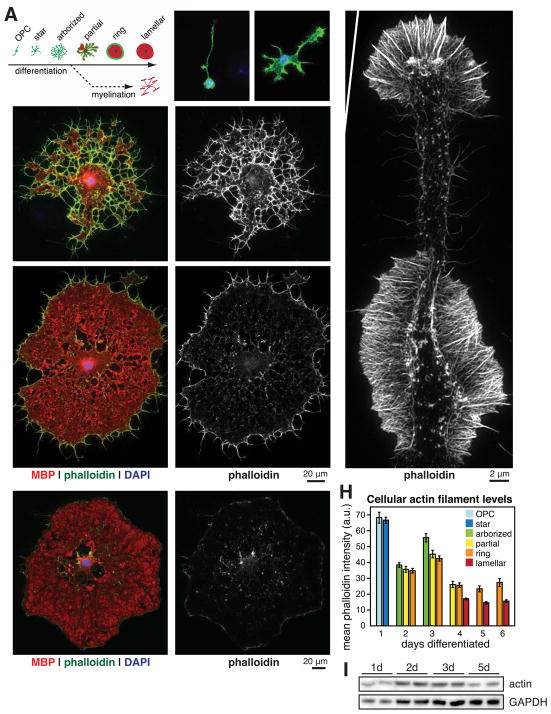
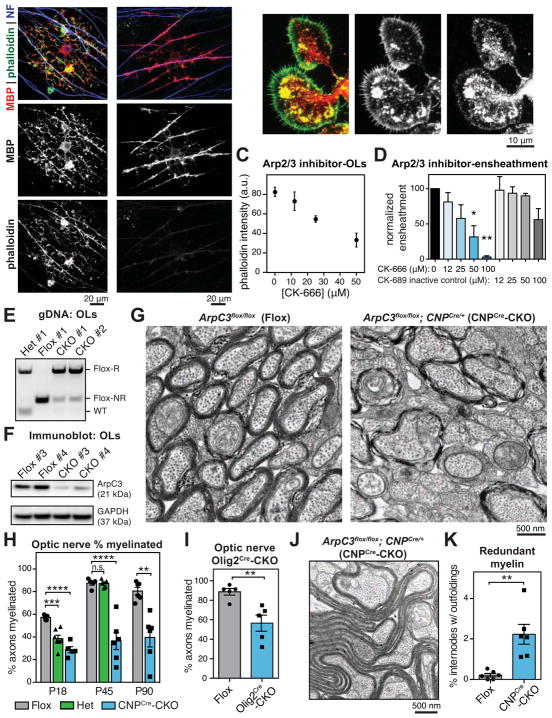
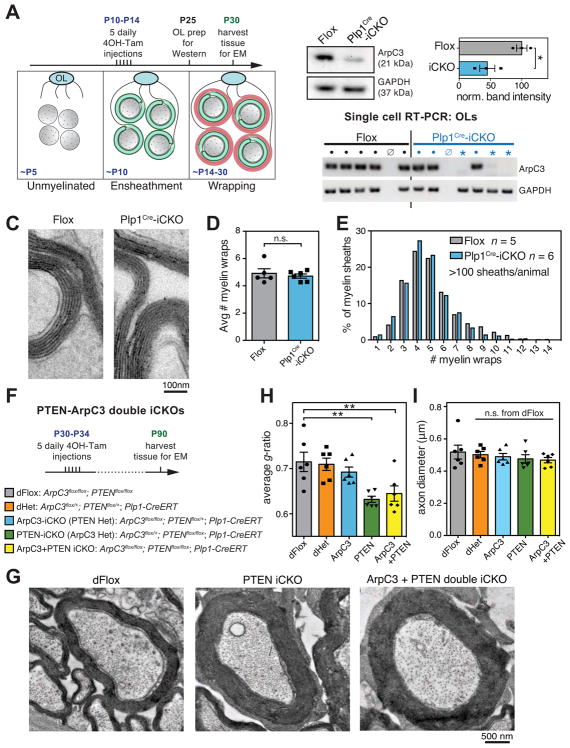
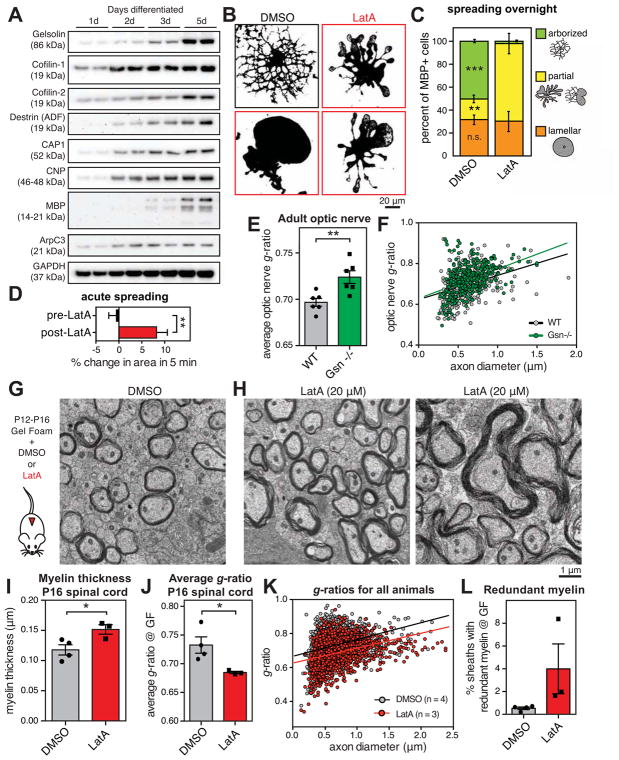
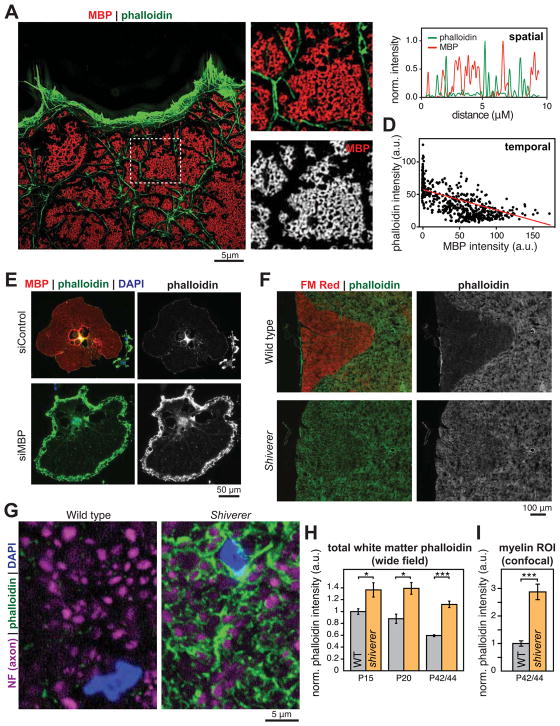
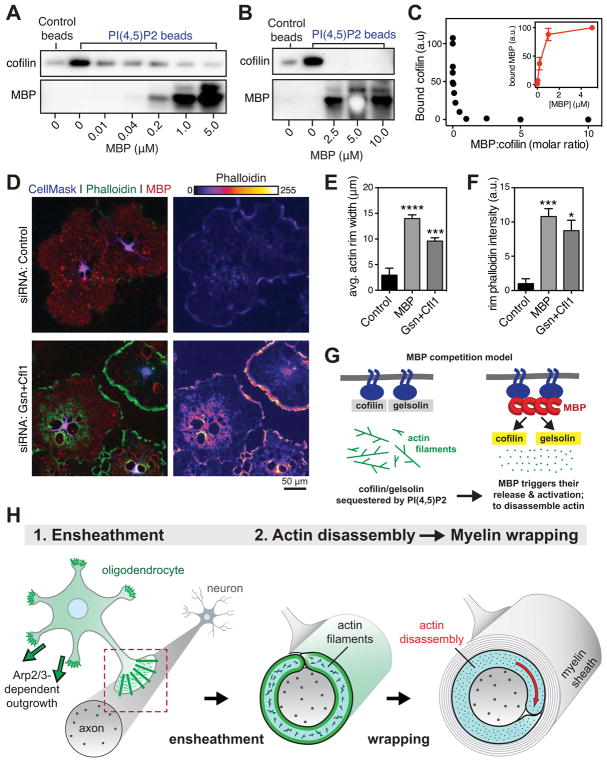
Myelin is essential in vertebrates for the rapid propagation of action potentials, but the molecular mechanisms driving its formation remain largely unknown. Here we show that the initial stage of process extension and axon ensheathment by oligodendrocytes requires dynamic actin filament assembly by the Arp2/3 complex. Unexpectedly, subsequent myelin wrapping coincides with the upregulation of actin disassembly proteins and rapid disassembly of the oligodendrocyte actin cytoskeleton and does not require Arp2/3. Inducing loss of actin filaments drives oligodendrocyte membrane spreading and myelin wrapping in vivo, and the actin disassembly factor gelsolin is required for normal wrapping. We show that myelin basic protein, a protein essential for CNS myelin wrapping whose role has been unclear, is required for actin disassembly, and its loss phenocopies loss of actin disassembly proteins. Together, these findings provide insight into the molecular mechanism of myelin wrapping and identify it as an actin-independent form of mammalian cell motility.


Figures

Figure 1
Figure 1. Loss of actin filaments during myelination in vivo
(A–C) P45 mouse spinal cord transverse sections stained for compact myelin with FluoroMyelin Red (FMred, red), actin filaments with Alexa 488-phalloidin (phalloidin, green), and nuclei (DAPI, blue). (A) Wide field epifluorescence showing low levels of actin filaments in mature white matter. (B) Confocal microscopy revealed lowest levels of actin filaments (phalloidin, green) in compact myelin (FMred, red). Arrows point to compact myelin. (C) Representative line scan through two myelinated axons from (B); a.u., arbitrary units. (D) Immunoblotting of brain lysate and fractionated compact myelin from adult mice. n = 3 mice fractionated on two separate days. (E) Wide field quantification of phalloidin and FMred staining intensities in mouse dorsal white matter regions of interest (ROI) during postnatal development. Error bars: SEM from n = 5–6 animals per time point; multiplicity adjusted P values shown for P10 (phalloidin) or P5 (FMred) compared to other days, calculated using Tukey’s multiple comparisons test, ***p < 0.001, ****p < 0.0001. (F and G) Confocal microscopy of developing P5 mouse spinal cord transverse sections, stained for MBP (red) and phalloidin (green). Arrows, early sheaths with low MBP intensity and high phalloidin intensity. Arrowheads, more mature sheaths with high MBP intensity and low phalloidin. (G) Quantification of individual P5 myelin sheaths showed that actin filament levels (phalloidin) decreased with increasing MBP intensity. See also Figure S1.
Figure 2
Figure 2. Two phases of actin dynamics during OL differentiation
(A–F) OL differentiation time course. (A), Cartoon depicting stereotyped stages of OL morphology changes during differentiation in culture in the absence (top) or presence (bottom) of neurons. (B–F), Primary rat OPCs were fixed before differentiation (B) or after differentiating for 3 (C), 5 (D), or 6 (E and F) days. OLs were immunostained for MBP (red) and stained for actin filaments (phalloidin, green and on right, D′–F′) and nuclei (DAPI, blue). (G) Structured illumination microscopy of phalloidin staining in a single OL process. (H) Quantification of actin filament levels in OLs at each stage of differentiation. Error bars: SEM from n > 50 OLs per day. (I) Immunoblot of total OL actin protein (top, 42 kDa) and GAPDH (bottom, 37 kDa) at 1, 2, 3, and 5 d differentiation. See also Figure S2 and Movie S1.
Figure 3
Figure 3. Actin assembly by Arp2/3 is required for myelin initiation
(A) Cocultures of DRG neurons and OPCs grown for 7 (left) or 9 (right) days, then fixed and stained for MBP, phalloidin, and axons (neurofilament, NF). (B) OPCs were differentiated for 1d and immunostained for the Arp2/3 subunit ArpC1 (red), and counterstained with phalloidin (green). (C and D) OLs required Arp2/3 for normal levels of actin filaments and to ensheath axons. (C) A dilution series of Arp2/3 inhibitor CK-666 was applied to OLs for 24 hr, then OLs were fixed and stained for actin filaments with phalloidin (see also Figure S3). (D) Axon ensheathment assay of OPCs on RGC neurons, treated with a dilution series of CK-666 or the inactive control compound CK-689. Graph shows quantification of axonal ensheathment per Olig2+ OPC/OL, normalized to DMSO-treated controls. n = 2 experiments. *p < 0.05, **p < 0.01, Dunnett’s multiple comparison test. (E and F) Recombination (E) and reduction of ArpC3 protein (F) in OLs purified from P18–20 ArpC3Flox/Flox (Flox), ArpC3Flox/+; CNPCre/+ (heterozygote) and ArpC3Flox/Flox; CNPCre/+ (CNPCre-CKO) mice by immunopanning. Flox-R, recombined; Flox-NR, non-recombined; bands were confirmed by sequencing. n = 4 CNPCre-CKO, 3 Flox, 1 heterozygote. (F) Immunoblot showing reduction of ArpC3 protein in CNPCre-CKO OLs. n = 2 animals per genotype. (G and H) Transmission electron microscopy of optic nerves from Flox (left), CNPCre-CKO (right), and heterozygote (not shown) mouse littermates. Quantification in (H) shows percent axons myelinated at P18, P45, and P90. Each data point is average from a single animal. n = 5–7 animals per age, per genotype. **p < 0.01, ***p < 0.001, ***p < 0.0001, Dunnett’s multiple comparison test (P18 and P45) or Student’s t-test (P90). (I) Percent axons myelinated in optic nerves from P72 Flox and ArpC3Flox/Flox; Olig2Cre/+ (Olig2Cre-CKO) mouse littermates. n = 5 animals per genotype; **p < 0.01, Student’s t-test. (J) EM micrograph shows an example of a myelin outfolding in a P90 CNPCre-CKO mouse. (K) Quantification of outfoldings in Flox versus CNPCre-CKO littermates at P90. n = 6 animals per genotype; **p < 0.01, Student’s t-test. Error bars: SEM. See also Figures S2, S3, S4, S5, and Movies S2 and S3.
Figure 4
Figure 4. Arp2/3 is dispensable for myelin wrapping
(A) Experimental paradigm for tamoxifen injections to ablate ArpC3 during myelin wrapping. (B) Reduction of ArpC3 mRNA and protein in OLs purified at P25 from ArpC3Flox/Flox (Flox) and ArpC3Flox/Flox; Plp1-CreERT (induced CKO, Plp1Cre-iCKO) mice that were injected with tamoxifen from P10–14. Top left, immunoblotting of ArpC3 from immunopanned OLs. Top right, densitometry of ArpC3 protein in OLs purified from n = 3 animals per genotype; *p < 0.05, Student’s t-test. Bottom, single cell RT-PCR analysis shows ArpC3 knockout OLs (GAPDH but no ArpC3, *), WT OLs (both GAPDH and ArpC3 bands, ●), or no cells (neither GAPDH nor ArpC3, ø). n > 22 reactions per animal, from one Flox and two Plp1Cre-iCKO mice. (C–E) Transmission electron microscopy of P30 optic nerves showed no difference in number of myelin wraps in Plp1Cre-iCKOs. (C), example micrographs, (D), average number of myelin wraps per animal, and (E), distribution of number of wraps in all animals. Error bars: SEM from n = 5–6 animals per genotype; >100 myelin sheaths per animal; n.s. = not significant, Student’s t-test. (F) Experimental paradigm for tamoxifen injections to ablate PTEN and/or ArpC3 at P30, and full genotypes of mice. (G) Transmission electron microscopy of optic nerves at P90 showing increased myelin wrapping in PTEN-iCKO (middle) and ArpC3+PTEN double iCKO (right) mice, compared to double floxed controls (left). (H) g-ratio analysis of optic nerves at P90 shows lower g-ratios after deletion of PTEN or both ArpC3+PTEN. (I) Axon diameter was unaffected. Error bars: SEM from n = 6 animals per genotype; >100 myelin sheaths measured per animal; n.s. = not significant, *p < 0.05, **p < 0.01, Dunnett’s multiple comparison test. See also Figure S5.
Figure 5
Figure 5. Actin disassembly drives myelin wrapping
(A) Induction of actin disassembly proteins as OLs differentiate. Primary rat OPCs differentiated for indicated time prior to immunoblotting. (B) Primary rat OPCs were differentiated for 2 days until arborized, then treated overnight with DMSO (carrier, top left) or 125 nM LatA to disassemble the actin cytoskeleton (micrographs outlined in red). Micrographs show thresholded MBP immunostaining. (C) Quantification of morphology after overnight treatment with DMSO or LatA. Cartoon shows examples of each morphology. n = 3 biological replicates. (D) Live cell imaging of 3d differentiated primary rat OPCs treated with LatA. Quantification of percent area change over 5 min before or after LatA treatment, measured from image stills. n = 7 OLs from 2 experimental days, **p < 0.01, paired Student’s t-test. (E and F) Quantification of g-ratios of myelinated axons as a function of axon diameter, in adult gelsolin KO mice (green) compared to wild-type littermate controls (gray). n = 6 animals per genotype. **p < 0.01, Student’s t-test. (G–L) Actin disassembly accelerates myelin wrapping in vivo. Gelfoam pre-loaded with DMSO or LatA was surgically implanted in the dorsal thoracic spinal cord of mice from P12–P18. Representative TEM micrographs show DMSO-treated (G) and LatA-treated (H) mice. LatA treatment induced thicker myelin and occasional redundant myelin outfoldings (right). (I) Myelin in LatA-treated mice was thicker, and (J and K) average g-ratio was lower. (L) Percentage of myelin sheaths with obvious outfoldings. n = 4 animals treated with DMSO, 3 with LatA, on two experimental days; *p < 0.05, Student’s t-test. Error bars: SEM. See also Figure S6.
Figure 6
Figure 6. Loss of MBP leads to accumulation of actin filaments
(A–C) Structured illumination microscopy of MBP (red) and actin filaments (phalloidin, green) in a 5d differentiated OL; boxed area shown in more detail in (B). (C) Representative line scan showing no spatial overlap between MBP and actin filaments in mature OLs. (D) MBP and actin filament levels were anticorrelated in OLs through differentiation. Each data point is one OL. (E) RNAi knockdown of MBP in OLs caused aberrant accumulation of actin filaments. Rat OPCs were transfected with control (nontargetting) or MBP-specific siRNA, differentiated into OLs, and stained for MBP (red), actin filaments (phalloidin, green), and nuclei (DAPI, blue). (F–I) Failure of OL actin disassembly in Shiverer mice that lack MBP. (F) Spinal cord transverse sections from P36 wild-type (top) and Shiverer (bottom) littermates, stained for compact myelin with FMred (red) and actin filaments with phalloidin (green and grayscale on right). (G) Confocal microscopy revealed high levels of actin filaments (phalloidin, green) in OL processes that ensheath axons (neurofilament, purple). Quantification of phalloidin staining grossly in dorsal white matter (H), and specifically around axons (myelin ROI, I). Error bars: SEM from n = 3 animals per genotype at both P15 and P20, 6 animals per genotype at P42/44; *p < 0.05, ***p < 0.001, Student’s t-test. See also Figure S7.
Figure 7
Figure 7. Model of how MBP regulates OL actin disassembly
(A–C) MBP competes with actin disassembly proteins for binding to PI(4,5)P2. (A and B) 10μM (A) or 1μM (B) recombinant human cofilin-1 protein was incubated with control or PI(4,5)P2 beads with the indicated concentration of native MBP, washed, and bound protein eluted with sample buffer. Immunoblots show bound cofilin (top) and bound MBP (bottom). (C) Densitometry quantification of PI(4,5)P2-bound cofilin as a function of the molar ratio of MBP:cofilin. Inset, bound MBP. n = 3 experimental days. See also Figure S7. (D–F) Dual RNAi of gelsolin and cofilin phenocopies MBP RNAi. OPCs were transfected with nontargeting siRNA (control, top) or siRNAs targeting gelsolin and cofilin (Gsn+Cfl1, bottom) or MBP (see Figure 6E) then differentiated for 6 days into mature OLs. (D) MBP (red) and actin filaments (phalloidin, green and false colored on right). (E and F) Quantification of width (E) and phalloidin intensity (F) in actin rims at the OL cell edge. *p < 0.05, ***p < 0.001, ***p < 0.0001; Dunnett’s multiple comparisons test; n = 3 experimental days. Error bars: SEM. (G) Model of how MBP may regulate actin disassembly during myelination. Left, actin disassembly factors cofilin and gelsolin are normally sequestered by PI(4,5)P2 (PIP2), preventing them from disassembling actin filaments. Right, MBP binds to PI(4,5)P2 on the OL membrane, releasing cofilin/gelsolin to disassemble actin. (H) Two-step model of myelin wrapping. (1) Ensheathment of axons by OL processes requires actin filaments (green), which also limit aberrant myelin membrane growth. (2) Local actin disassembly in the inner tongue induces myelin wrapping.

Comment in

References

    1. Aggarwal S, Yurlova L, Snaidero N, Reetz C, Frey S, Zimmermann J, Pähler G, Janshoff A, Friedrichs J, Müller DJ, et al. A Size Barrier Limits Protein Diffusion at the Cell Surface to Generate Lipid-Rich Myelin-Membrane Sheets. Dev Cell. 2011;21:445–456. - PubMed
    1. Baryłko B, Dobrowolski Z. Ca2+-calmodulin-dependent regulation of F-actin-myelin basic protein interaction. Eur J Cell Biol. 1984;35:327–335. - PubMed
    1. Bauer NG, Richter-Landsberg C, Ffrench-Constant C. Role of the oligodendroglial cytoskeleton in differentiation and myelination. Glia. 2009;57:1691–1705. - PubMed
    1. Bercury KK, Macklin WB. Dynamics and mechanisms of CNS myelination. Dev Cell. 2015;32:447–458. - PMC - PubMed
    1. Boggs JM, Rangaraj G. Interaction of lipid-bound myelin basic protein with actin filaments and calmodulin. Biochemistry. 2000;39:7799–7806. - PubMed

Publication types

MeSH terms