

Review
doi: 10.1021/cr500314d.
Epub 2015 Jul 13.
Noninvasive Imaging of Nanomedicines and Nanotheranostics: Principles, Progress, and Prospects
Affiliations
- PMID: 26166537
- PMCID: PMC4610064
- DOI: 10.1021/cr500314d
Item in Clipboard
Review
Noninvasive Imaging of Nanomedicines and Nanotheranostics: Principles, Progress, and Prospects
Chem Rev.
.
No abstract available
Figures
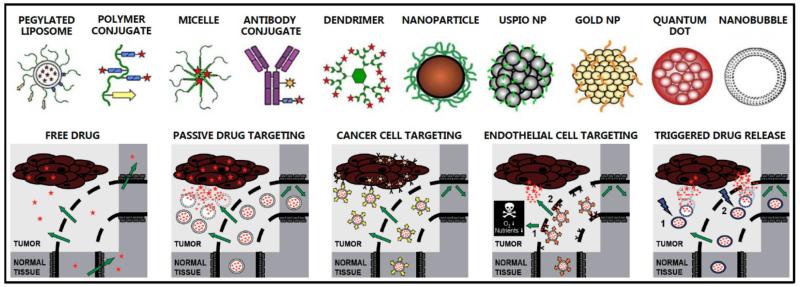
Examples of routinely used drug delivery systems and drug targeting strategies.
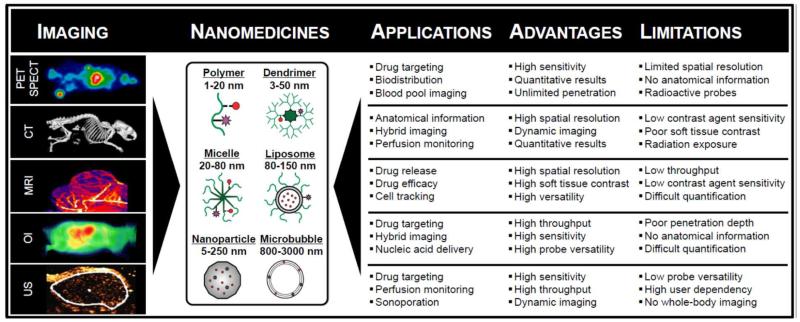
Schematic depiction of non-invasive imaging techniques routinely used in nanomedicine research, as well as an overview of their specific applications, advantages and limitations.
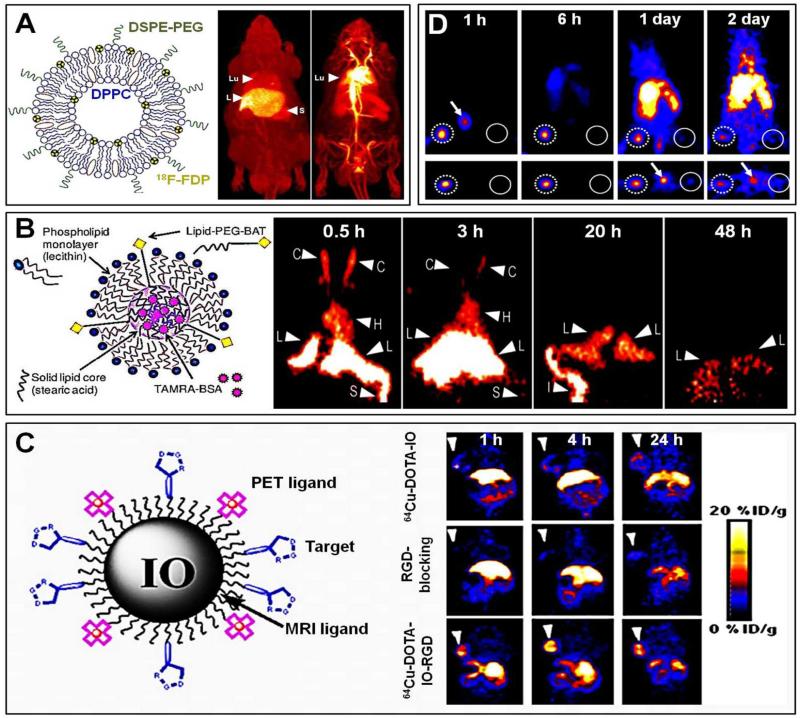
A. Left: Schematic structure of a liposomal nanomedicine formulation composed of DSPE-PEG and DPPC, labeled with 18F-FDP. Right: Whole-body maximum intensity projections (MIP) of free 18F-FDP (left) and 18F-FDP-containing (right) liposomes in rats at 90 min after i.v. administration. The left panel exemplifies uptake of free 18F-FDP in liver (L), spleen (S) and lungs (Lu), while the right panel clearly shows that 18F-FDP-containing liposomes are still primarily present in systemic circulation at this time point. B. Schematic depiction of BAT-containing (for 64Cu-labeling) solid lipid nanoparticles. Coronal micro-PET images obtained at 0.5, 3, 20 and 48 h after the i.v. injection of 64Cu-labeled solid lipid nanoparticles are shown shown on the right. Initially, strong signals were detected in the heart (H) and carotid arteries (C), whereas at later time points, signals were localized in the liver (L), intestine (I) and spleen (S). C. Schematic depiction of iron oxide-based nanocarriers co-functionalized with PET tracers and integrin-specific RGD peptides. Coronal PET images obtained at 1, 4 and 24 h after the i.v. injection of 64Cu-labeled control iron oxide nanoparticles (64Cu-DOTA-IO; top row), RGD-targeted nanoparticles after pre-blocking with excess free RGD (64Cu-DOTA-IO-RGD; middle row), and RGD-targeted iron oxide nanoparticles (64Cu-DOTA-IO-RGD; bottom row) exemplifying efficient and specific targeting to integrins in U87MG xenografts (arrowheads). D. PET imaging of sentinel lymph node identification in a 4T1 metastatic mouse model. Metastatic sentinel lymph nodes (dotted circles; left) and normal contralateral lymph nodes (solid circles; right) were visualized at 1, 6, 24 and 48 h after the injection of multimodal 64Cu-labeled mesoporous silica nanoparticles (MSN-Dye-Gd-64Cu) into the foot soles of the mice, indicating localization to sentinel lymph nodes. Arrows indicate probe accumulation in the bladder. Images are reprinted and adapted with permission from -. Copyright 2007 Elsevier, Copyright 2008 Society of Nuclear Medicine, Copyright 2012 Elsevier, Copyright 2011 American Chemical Society.
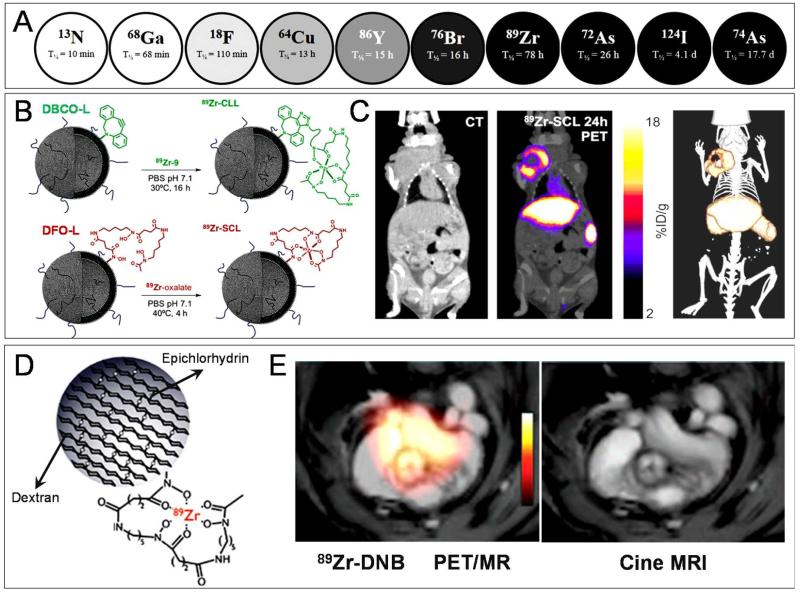
A. Overview of shorter to longer lived PET radionuclides commonly employed in nuclear medicine and nanomedicine research. B. PEGylated liposomes were labeled with 89Zr using two different labeling strategies: ‘click labeling’ and ‘surface chelation’. For click labeling, dibenzoazacyclooctyne (DBCO) was used, while for surface chelation, deferoxamine (DFO) was employed. Due to the higher labeling efficiency and stability, only surface-chelated liposomes (89Zr-SCL) were used for in vivo studies. C. NCr nude mice bearing 4T1 breast cancer tumors were used to evaluate the biodistribution and the target site accumulation of 89Zr-SCL. PET-CT imaging was performed at 24 h post i.v. injection, showing prominent accumulation in tumor (upper left), liver (central) and spleen (lower right). D.
89Zr-labeled polymeric nanoparticles based on dextran (89Zr-DNP) were generated for macrophage imaging in atherosclerotic plaques. Polymeric dextran chains were crosslinked with epichlorhydrin and functionalized with deferoxamine (DFO) for 89Zr chelation. E. PET-MR imaging of 89Zr-DNP showing strong accumulation in the aortic root of atherogenic ApoE−/− mice at 48 h p.i. Images are reprinted and adapted with permission from ref ;; Copyright 2014 Society of Nuclear Medicine, Copyright 2013 American Heart Association.
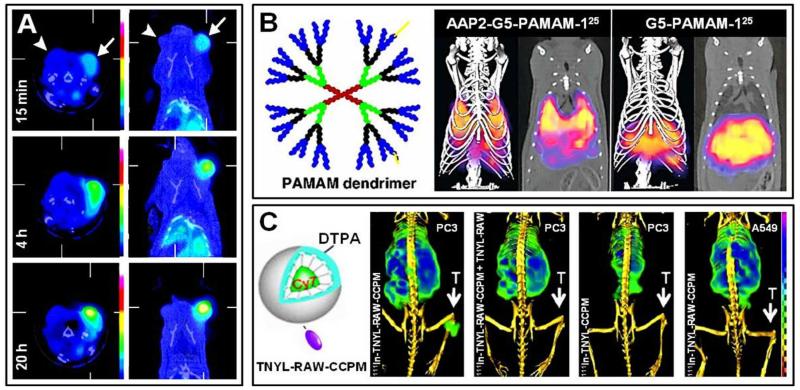
A. Transaxial and coronal SPECT-CT images of rats bearing head-and-neck squamous cell carcinoma tumors on either side of the skull base. Rats were i.v. injected with 99mTc-labeled liposomal doxorubicin, and probe accumulation was visualized and quantified in RFA-treated tumors (right; arrow) and sham-treated tumors (left; arrowhead). B. Hybrid SPECT-CT imaging of drug targeting to the lung using 125I-labeled APP2 antibody-modified G5-PAMAM dendrimers versus control dendrimers. Images were obtained at 1 h post i.v. injection. 3D volumetric SPECT with iso-surface CT images and corresponding 2D coronal slices are shown. C. SPECT-CT imaging of mice bearing PC3 (EphB4R-positive) or A549 (EphB4R-negative) tumors at 24 h after the i.v. administration of 111In-labeled EPhB4R-targeted core-cross linked polymeric micelles (TNYL-RAW-CCPM) and control CCPM. To confirm probe specificity, PC3 tumor-bearing mice were also pretreated with excess free TNYL-RAW peptide, for blocking purposes. Images are reprinted and adapted with permission from ref , and . Copyright 2010 Radiological Society of North America, Copyright 2011 Wiley Intersciences, Copyright 2011 Elsevier.
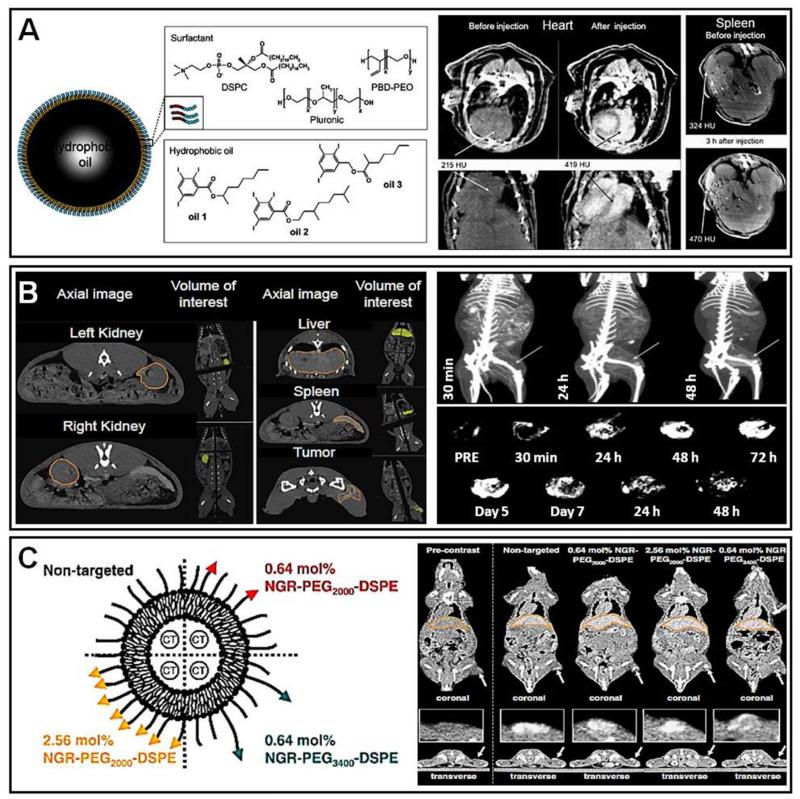
A. Left: Schematic depiction of PBD-PEG nanoemulsions. Right: After the i.v. injection of an iodine-containing PBD-PEG nanoemulsion into healthy mice, CT images were obtained in the heart (at 12 min p.i.; arrows in middle panels) and spleen region (at 3 h p.i.; arrows in right panels), confirming classical nanomedicine behavior, with initially high amounts present in systemic circulation, and subsequently significant accumulation in RES organs, such as spleen. B. Left: Axial CT images of rabbit kidneys, liver, spleen and tumor obtained at 48 h after the i.v. injection of liposomes containing iohexol. Right: Anterior views of 3D CT maximum intensity projections (MIP) of a VX2 sarcoma-bearing rabbit at 30 min, 24 and 48 h after the i.v. administration of iodine-containing liposomes. Arrows highlight the VX2 tumor, and EPR-mediated passive drug targeting can be visualized via the gradual opacification of the tumor area. Bottom panels show 3D CT MIP of the segmented tumor volumes before and up to 14 days after liposome injection. C. Left: Schematic depiction of non-targeted and several different NGR-targeted iodine-containing PEGylated liposomes. Right: Coronal micro-CT images of H520 tumor-bearing mice at 48 h after the i.v. injection of the four different liposomal nanomedicine formulations. Tumors are highlighted with arrows. The transversal images in the bottom panels provide non-invasive and quantitative information on the heterogeneity of tumor accumulation and intratumoral distribution upon using targeted vs. non-targeted liposomes. Images are reprinted and adapted with permission from ref , and . Copyright 2010 Elsevier, Copyright 2011 Elsevier, Copyright 2009 American Chemical Society.
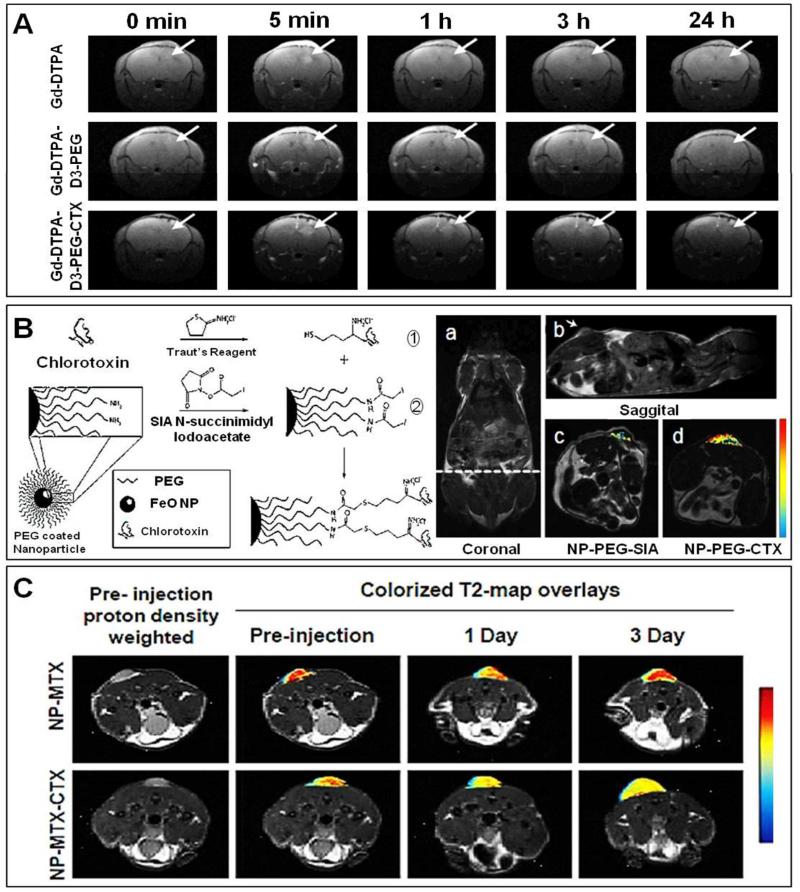
A. Transversal MR images of orthotopic 9L gliosarcoma upon i.v. injection of Gd-DTPA, Gd-DTPA-D3-PEG and Gd-DTPA-D3-PEG-CTX. The signal enhancement indicated by the arrows corresponds to probe accumulation in the tumor lesions from as early as 5 min p.i. onwards. Over time, the signal fades with different kinetics for the different formulations, showing that actively targeted nanoparticles (i.e. chlorotoxin-modified DTPA-D3-PEG) are retained more efficiently at the pathological site than passively targeted nanoparticles. B. Left: Schematic depiction of (the preparation of) CTX-targeted iron oxide (IO) nanoparticles. Right: MR images of a 9L tumor-bearing mouse in coronal (a; dotted line displays the location of the transversal sections displayed in panels c and d), sagittal (b) and transversal (c-d) planes, comparing the tumor targeting potential of passively targeted IO nanoparticles (c) to that of CTX-modified actively targeted IO nanoparticles (d) at 3 h post i.v. injection. The changes in R2 relaxivity values are depicted by color-coded intensity maps, showing more efficient tumor localization for actively targeted nanoparticles. C. MR images of 9L tumor-bearing mice upon the i.v. injection of passively and CTX-modified actively targeted methotrexate (MTX) -containing IO nanoparticles, exemplifying that over time, the latter are retained in tumors more efficiently than the former. Images are reprinted and adapted with permission from ref , and . Copyright 2011 Elsevier. Copyright 2008 Wiley Intersciences. Copyright 2008 Future Medicine.
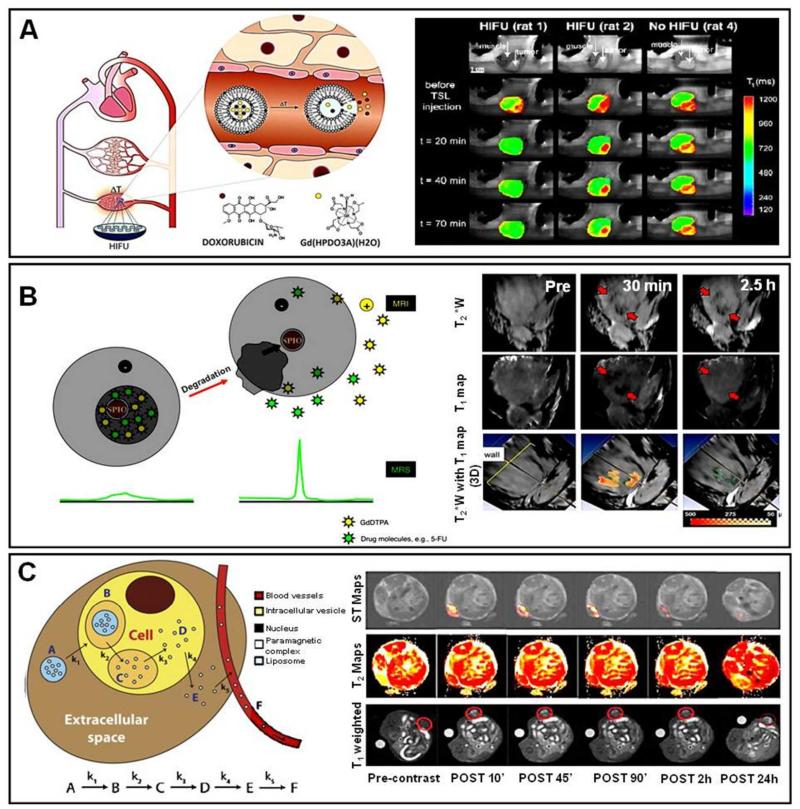
A. Temperature-sensitive liposomes (TSL) co-loaded with the T1 MR contrast agent Gd-HPDO3A and doxorubicin were i.v. injected into 9L gliosarcoma-bearing rats, and the tumor area was heated in a controlled manner using MR-guided HIFU. MR imaging was performed before and at several time points after TSL administration and HIFU treatment, exemplifying the release of the MR probe from TSL specifically in heated tumors. Significant inter-individual variability in content release in different tumor-bearing animals can also be observed, e.g. due to central tumor necrosis (see rat 2). B. Schematic depiction of a theranostic PLGA-based nanomedicine formulation containing super-paramagnetic iron oxide (SPIO) nanoparticles, Gd-DTPA and 5-FU. Top right: The tumor localization of the SPIO/Gd-DTPA/5-FU-loaded nanoformulations can be clearly identified as dark regions (red arrows) on the T2*-weighted MR images, resulting from SPIO-generated contrast. Middle right: T1 shortening at 30 min p.i., due to the rapid release of Gd-DTPA, and subsequent disappearance of this signal at 2.5 h, due to the rapid diffusion of Gd-DTPA out of the tumor region. Lower right: 3D renderings of the tumor region, showing T2*-weighted images overlaid with quantitative T1 values (indicating Gd-DTPA release; in yellow/red). C. Left: Schematic depiction of the kinetic model used for the mathematical modeling of the temporal evolution of MR signals upon the intratumoral administration and cellular trafficking of two different paramagnetic liposome formulations acting as multicontrast MR agents. Right: MR images illustrating the temporal evolution of T1, T2 and ST signals upon the intratumoral injection of two different MR-responsive liposome formulations. The reported ST and T2 maps refer to Tm-DOTMA-loaded liposomes; the T1-weighted images refer to Gd-HPDO3A-loaded liposomes. Images are reprinted and adapted with permission from -. Copyright 2010-2011 Elsevier.
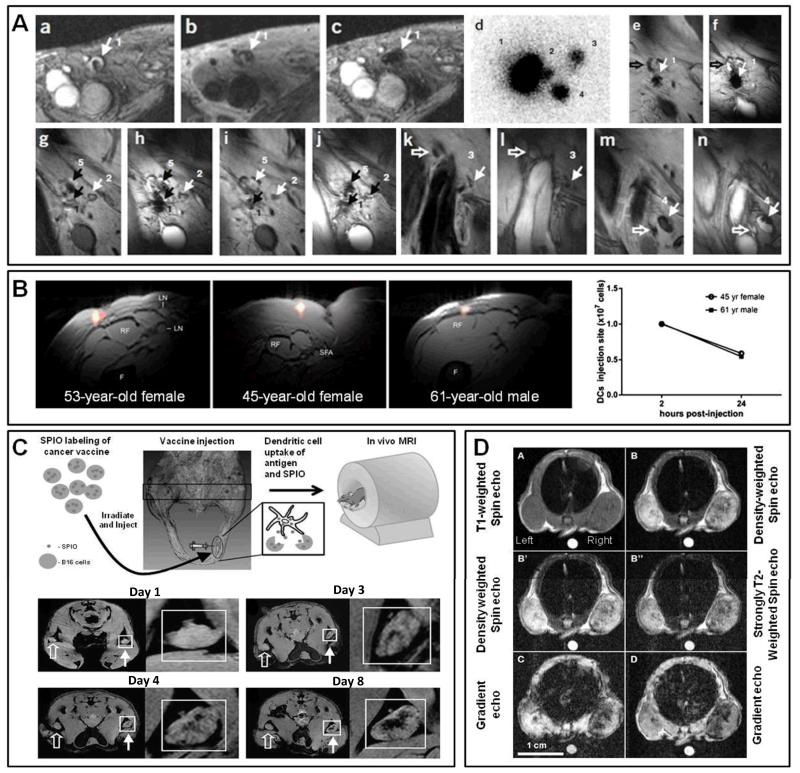
A. Magnetic resonance imaging of dendritic cell (DC) localization and migration in melanoma patients. (a-c): Gradient echo (a,c) and turbo spin echo (b) MR images show the localization of DC (co-labeled with SPIO and 111In) before and after injection in patient 1. In the gradient echo images (a), a hyperintense signal area (1) can be found near the right inguinal lymph node. In the spin echo image (b), which is less sensitive to SPIO, the corresponding lymph node (1) after vaccination could also be seen. (d-n): Tracking the in vivo migration of DC. d: In vivo scintigraphy image showing the migration of SPIO- and 111In-colabeled DC from the injection lymph node site (1) to several other lymph nodes (2-4) at 48 h after DC administration. e-n: Coronal gradient echo and spin echo images illustrating the migration of DC from lymph node 1 (e and f) to other lymph nodes (g-n). Open and closed arrows represent SPIO-negative and SPIO-positive lymph nodes. B. Initial proof-of-concept for 19F-based magnetic resonance imaging of intradermally injected DC labeled with a perfluorocarbon-based nanoemulsion into the leg of 3 different colorectal adenocarcinoma patients. The pseudocolor images of 19F-DC are overlaid onto 1H MR anatomical images (F = femur, RF = rectus femoris, SFA = superficial femoral artery, LN = lymph node). On the right, the in vivo data from 2 patients were quantified at 4 h (and not at 2 h; as indicated in the legend) and 24 h post injection, showing that more approximately half of the DC migrate away from the injection site within 24 h. C. Top: Schematic depiction of in vivo MR cell tracking of inactivated B16 melanoma cell vaccines labeled with SPIO, which after injection into the footpad of mice and drainage via dendritic cells eventually accumulate in the popliteal lymph node (PLN). Bottom: Multigradient T2-weighted MR images showing gradual vaccine/dendritic cell migration into the PLN (see insets). Closed arrows indicate SPIO-labeled vaccines, open arrows depict unlabeled cell vaccines. D. MR imaging and magnetic drug targeting to tumors using i.v. injected maghemite nanocrystal-containing magnetoliposomes (ML). Tumors on the right were exposed to a magnet. A) T1-weighted spin echo; B) and B’) density-weighted spin echo; B”) strongly T2-weighted spin echo; C) gradient echo; and D) 3D-spoiled gradient echo. An oil phantom (bright spot on the bottom of the images) was placed on the back of the animals for reference purposes. The tumor on the right clearly appeared darker than the control tumor on the left, exemplifying efficient magnetic drug targeting. Images adapted with permission from -. Copyright 2005 Nature Publishing Group, Copyright 2014 International Society for Magnetic Resonance in Medicine, Copyright 2009 American Association for Cancer Research, Copyright 2006 Radiological Society of North America.
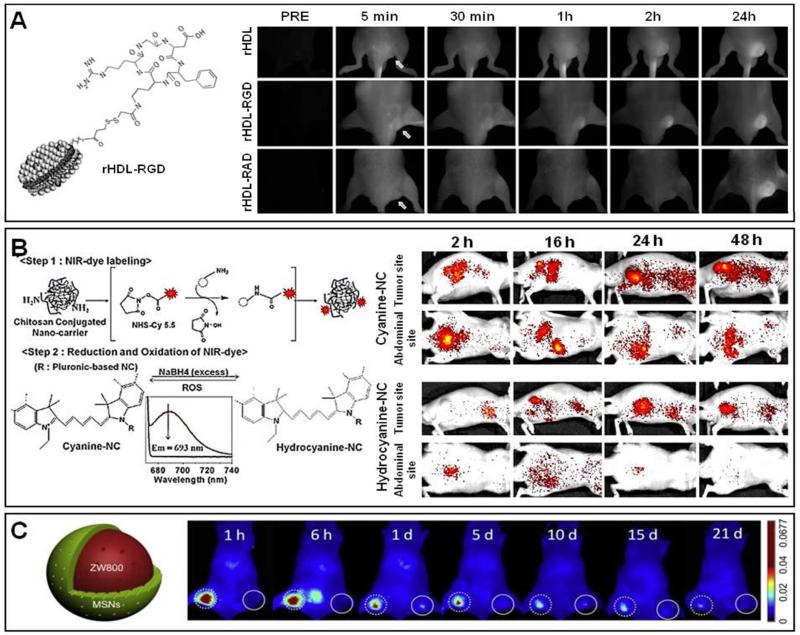
A. Left: Schematic depiction of an HDL nanoparticle targeted to tumor blood vessels using RGD. Right: 2D FRI of mice bearing subcutaneous EW7 Ewing’s sarcoma xenografts i.v. injected with NIRF-labeled rHDL, rHDL-RGD, and rHDL-RAD nanoparticles, showing rapid binding and tumor targeting of RGD-modified rHDL. Arrows highlight the tumor. B. Left: Schematic depiction of cyanine- and hydrocyanine-containing nanochitosan (NC). Right: 2D FRI of nude mice bearing SCC7 tumors after the i.v. injection of hydrocyanine-NC and cyanine-NC. Background signals from the abdominal and liver region were evident in case of cyanine-conjugated NC, whereas tumor-specific signals were prominent in case of hydrocyanine-conjugated NC. C. Left: Schematic depiction of a mesoporous silica nanoparticle (MSN) containing the fluorophore ZW800. Right: 2D FRI of sentinel lymph nodes (SLN) after the food pad injection of MSN nanoparticles. Dotted circle: Tumor SLN. Solid line: Normal SLN. Images reprinted and adapted with permission from ;;. Copyright 2010 Federation of American Society for Experimental Biologists (FASEB), Copyright 2011 Elsevier, Copyright 2012 Elsevier.
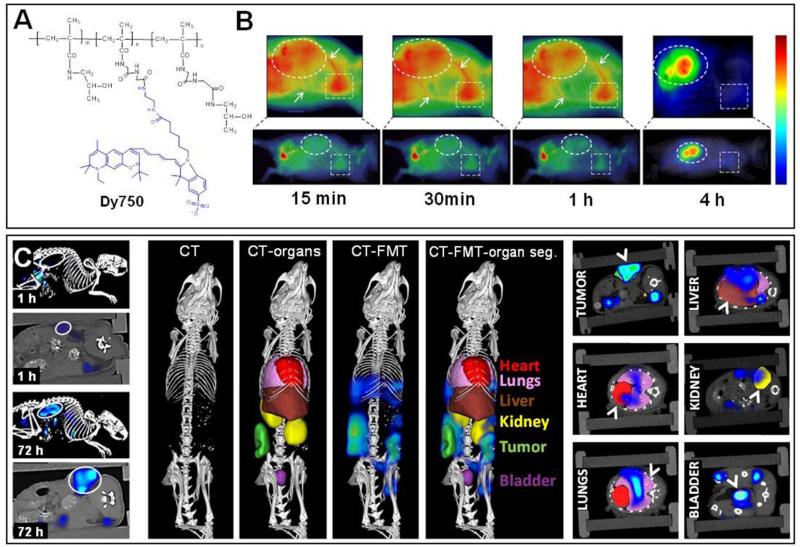
A. Schematic depiction of a NIRF (Dy750) -labeled pHPMA-based polymeric drug carrier. B. 2D FRI of the biodistribution of pHPMA-Dy750 in CT26 tumor-bearing mice, confirming prolonged circulation times (heart highlighted in square, large blood vessels with arrows) and efficient EPR-mediated drug targeting to tumors over time (circle). C. Hybrid CT-FMT imaging of nanomedicine biodistribution. Left: 3D FMT images fused with high resolution micro-CT, demonstrating biodistribution of pHPMA-Dy750 in mice bearing CT26 tumors at 1 and 72 h. Middle: Principle of whole-body CT-FMT, which relies on CT-based organ segmentation, and subsequent fusion with FMT-based probe accumulation. Right: 2D CT planes fused with FMT signals representing pHPMA-Dy750 accumulation in tumor, heart, lung, liver, kidney and bladder are shown. Images are reproduced and adapted with permission from . Copyright 2013 American Chemical Society.
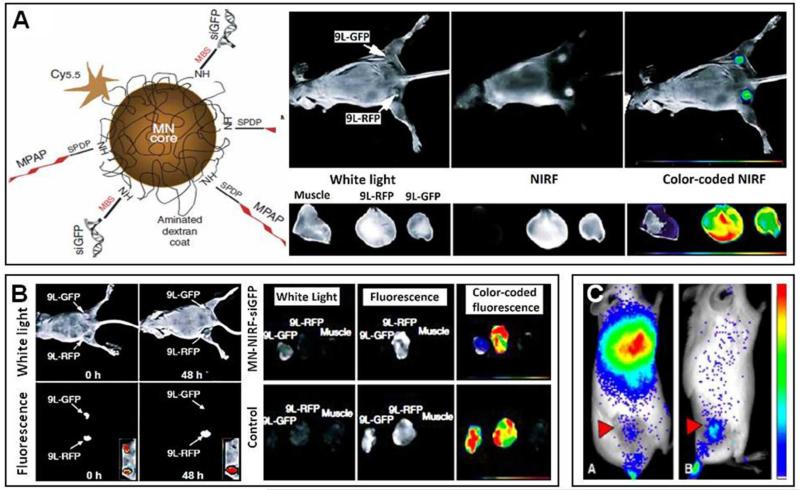
A. Left: Schematic depiction of iron oxide-based magnetic nanoparticles (MN) containing a NIRF (Cy5.5) and siRNA directed against GFP. Right: Optical imaging of GFP- and RFP- transfected 9L gliosarcoma-bearing nude mice treated with MN-NIRF-siGFP. High NIRF signals in both GFP- and RFP- transfected tumors (indicated by arrows), and low accumulation in muscle tissue, confirm relatively efficient tumor targeting. B.
In vivo (left) and ex vivo (right) optical imaging of the gene silencing efficacy of MN-NIRF-siGFP, showing strong and selective GFP silencing in GFP-transfected tumors, but not in RFP-transfected control tumors. C. Optical imaging of DNA delivery using bioluminescence imaging. N2A tumor-bearing mice were treated with linear PEI polyplexes (left) and G5-PAMAM polyplexes (right) containing plasmid DNA encoding for luciferase, and gene delivery and transfection efficacy were assessed at 24 h p.i., showing that L-PEI mainly delivered DNA to the lung, whereas G5-PAMAM enabled relatively selective delivery to tumors (arrowheads). Images reprinted and adapted with permission from and . Copyright 2007 Nature Publishing Group, Copyright 2009 Elsevier.
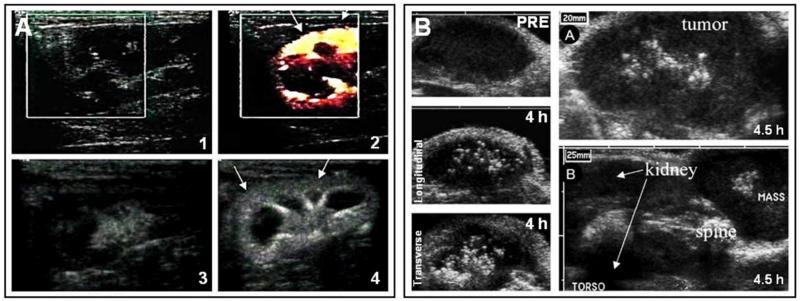
A. Power Doppler US imaging of the right rabbit kidney before (panel 1) and after (panel 2) the i.v. administration of ST-68N-based nanobubbles, illustrating high perfusion. Arrows indicate the kidney capsule. Pulse inversion harmonic images of the right kidney before and after ST-68N administration are shown in panels 3 and 4, respectively. B. B-mode US imaging of MDA-MB-231 xenografts upon the intratumoral injection of PEG-PLLA-PFP-based nanobubbles loaded with doxorubicin. US images were taken before (upper left panel), and at 4 h after i.t. administration, in longitudinal (middle left panel) and transversal (lower lower panel) planes. The upper right panel exemplifies tumor localization of i.v. administered nano/microbubbles at 4.5 h p.i. The lower right panel depicts a trans-torso image of the same mouse, illustrating accumulation in tumor (designated as “mass”), kidneys and spine. Images reprinted and adapted with permission from ;. Copyright 2006 Elsevier, Copyright 2007 Oxford University Press.
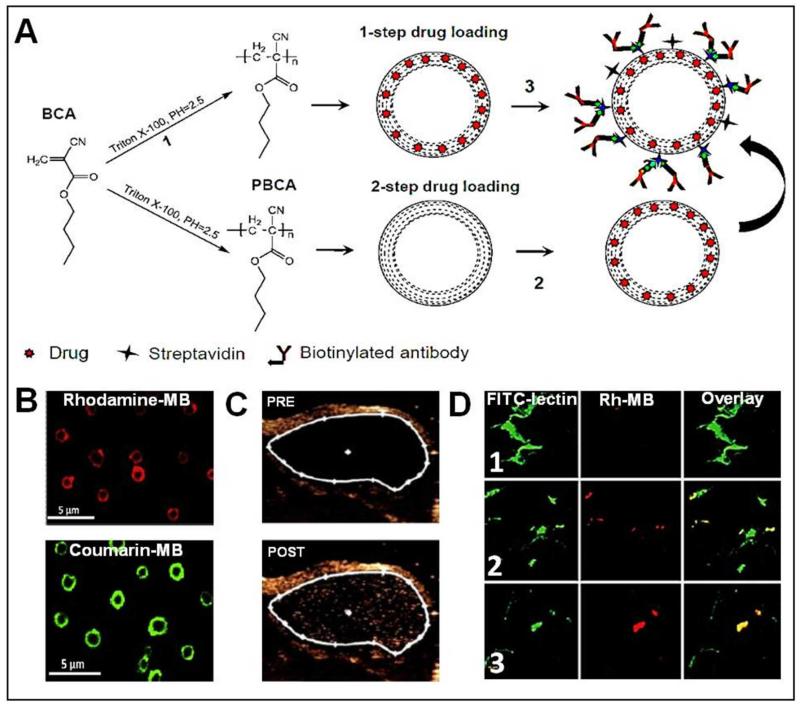
A. Schematic depiction of the synthesis of VEGFR2-antibody-targeted polymeric MB loaded with (model) drugs via a 1-step or 2-step procedure. B. Two-photon laser scanning microscopy images of MB loaded with the model drugs Rhodamine-B (red) and Coumarin-6 (green). C. US imaging of CT26 tumors prior to and 7 min after the i.v. administration of Rhodamine-B-loaded and VEGFR2-targeted MB, showing efficient binding to angiogenic blood vessels. D. Fluorescence microscopy analysis of model drug delivery to tumors upon the i.v. injection of Rhodamine-B-loaded and VEGFR2-targeted MB without exposure to US (panel 1), with exposure to three destructive US pulses at 7 min p.i. (panel 2), and with continuous exposure to US for 7 min (panel 3), exemplifying significant Rhodamine-B release in tumors upon combining MB and US. Images reprinted and adapted with permission from . Copyright 2012 Elsevier.
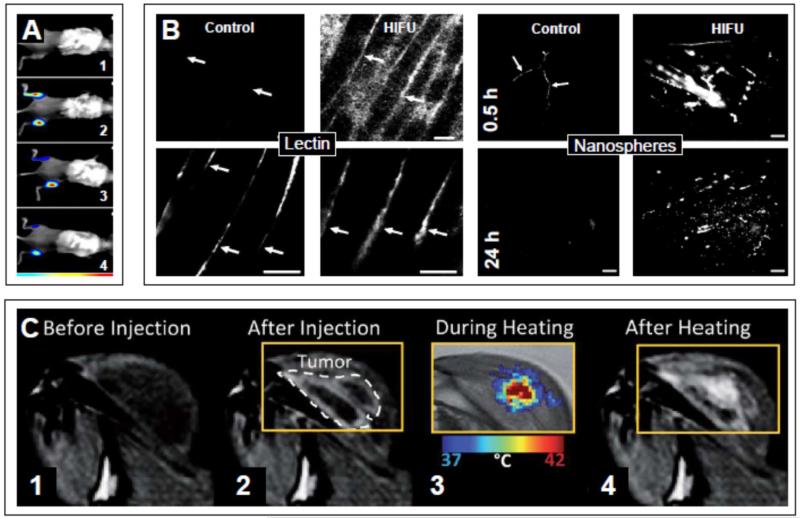
A. 2D FRI images of mice intratumorally injected with MB plus TOTO-3 (a cell membrane-impermeable model drug), and treated with US (lower tumor) or left untreated (upper tumor). Optical imaging of TOTO-3 internalization and retention in tumors was carried out before US (1), immediately afterwards (2), and 2 h (3) and 4 h (4) later. B. Accumulation of i.v. administered fluorescently labeled lectin and nanospheres in HIFU-pretreated and control muscle tissue in mice at 0.5 and 24 h. Both probes showed significantly more extravasation upon HIFU treatment. Bar: 50 μm. C. MR monitoring of US-induced and hyperthermia-mediated T1-contrast agent release from temperature-sensitive liposome. Immediately after liposome administration, the perfusion of tumor blood vessels can be visualized (panel 2). Subsequently, US-mediated mild hyperthermia is applied to the tumor, which can be monitored via real-time MR-thermometry (panel 3), and which leads to efficient Gd-HPDO3A (model drug) release from the temperature-sensitive liposomes only in the heated area (panel 4). Images are reprinted and adapted from , and . Copyright 2009 Elsevier, Copyright 2009 Elsevier, Copyright 2011 Informa Healthcare.
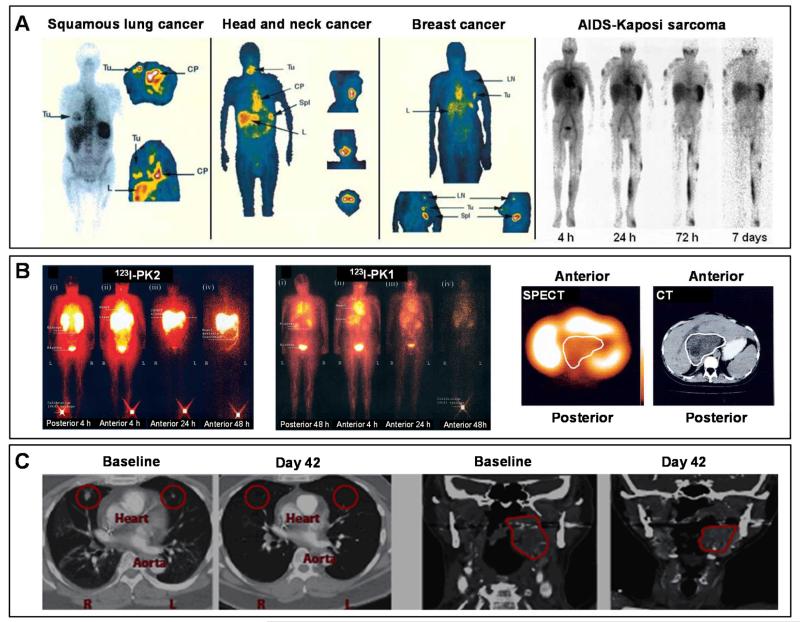
A. Monitoring passive drug targeting. The tumor accumulation of 111In-labeled PEGylated liposomes was evaluated in patients suffering from squamous cell lung carcinoma, head and neck cancer, and breast cancer. Gamma camera images were captured at 72 h post i.v. injection, showing clear contrast enhancement in tumors (Tu). Head and neck cancers and squamous lung carcinomas showed high accumulation of the liposomes in the tumor, while breast cancers showed relatively low accumulation. CP represents the cardiac pool (i.e. liposomes in circulation), and L and Spl illustrate accumulation of the liposomes in liver and spleen, respectively. Ln indicates a metastatic lymph node, which also accumulates liposomes fairly efficiently. In the right panel, the longitudinal biodistribution of liposomes in a patient suffering from AIDS-related Kaposi sarcoma is presented, showing strong accumulation in primary tumors (upper and lower leg region), as well as in metastatic lesions (shoulder and facial region). B. Monitoring active drug targeting. Left panels: Gamma camera imaging upon the administration of 123I-labeled Gal-pHPMA-GFLG-doxorubicin (PK2), targeting asialoglycoprotein receptors overexpressed by hepatocytes via incorporated galactosamine moieties, as well as of 123I-labeled PK1 (similar polymer-drug conjugate, but without the liver-specific targeting ligand). Anterior and posterior images at 4 and 24 h exemplify efficient targeting of PK2 to the liver. Right panels: hybrid SPECT-CT imaging of PK2, illustrating accumulation in the peripheral (healthy) regions of the liver, rather than in the central tumor mass (dark area in the middle of the CT image). C. Monitoring treatment efficacy. Left panels: Contrast-enhanced CT scans obtained in a cholangiosarcoma patient with lung metastases treated with PSMA-targeted and docetaxel-loaded PLGA nanoparticles (DTXL-TNP). The red circles indicate metastatic lesions observed prior to treatment, which disappeared at day 42 after treatment initiation. Right panels: Contrast-enhanced CT scans obtained in a patient suffering from tonsillar cancer (red circle) treated with DTXL-TNP, showing significant tumor shrinkage at day 42 after treatment initiation. Images are adapted and reproduced with permission from , and . Copyright 2006 American Association for Cancer Research, Copyright 2012 American Society of Clinical Oncology, Copyright 2012 American Association for the Advancement of Science.
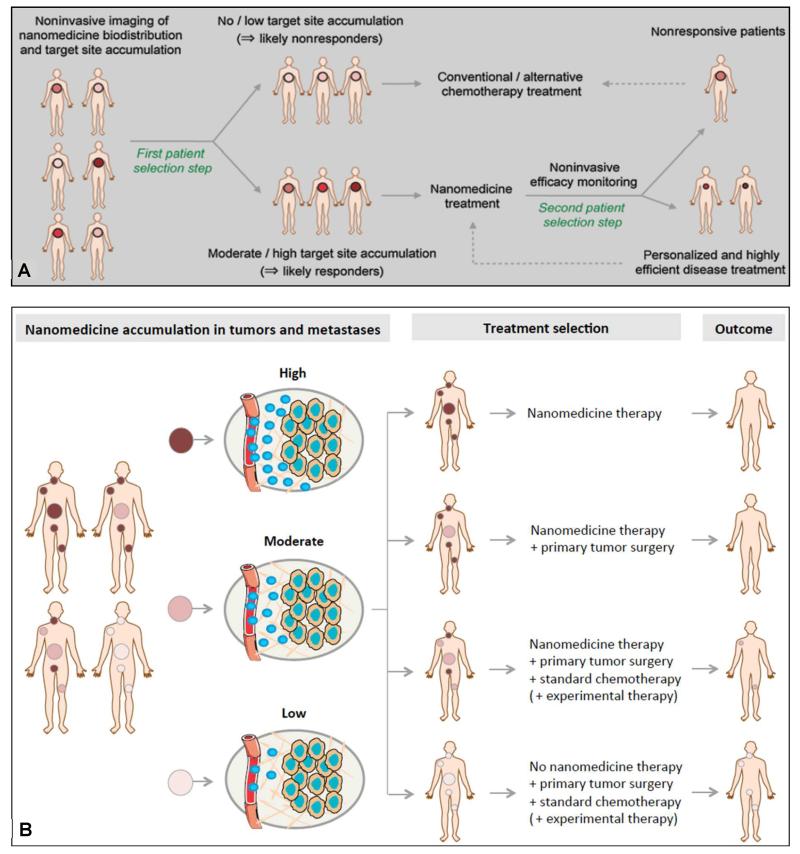
Schematic depiction demonstrating how the combination of non-invasive imaging and tumor-targeted drug delivery can be used to individualize and improve nano-chemotherapeutic treatment regimens. Ideally, not only accumulation in primary tumors should be considered (A), but also localization in metastases (B). Depending on the accumulation pattern of nanomedicine formulations in both primary tumors and metastases, optimized treatment regimens can be envisaged for each individual patient, enabling personalized and optimized therapies. Images reproduced with permission from ,. Copyright 2012 American Association for Cancer Research. Copyright 2015 Informa Healthcare.
References
-
- European Science Foundation’s Forward Look Nanomedicine: An EMRC Consensus Opinion. European Science Foundation; 2005. www.esf.org.
-
- Kataoka K, Harada A, Nagasaki Y. Block Copolymer Micelles for Drug Delivery: Design, Characterization and Biological Significance. Adv. Drug Deliv. Rev. 2001;47:113–131. - PubMed
-
- Panyam J, Labhasetwar V. Biodegradable Nanoparticles for Drug and Gene Delivery to Cells and Tissue. Adv. Drug Deliv. Rev. 2003;55:329–347. - PubMed
-
- Torchilin VP. Recent Advances With Liposomes As Pharmaceutical Carriers. Nat. Rev. Drug Discovery. 2005;4:145–160. - PubMed
-
- Duncan R. Polymer Conjugates As Anticancer Nanomedicines. Nat. Rev. Cancer. 2006;6:688–701. - PubMed
Publication types
MeSH terms
Grants and funding
LinkOut - more resources
Full Text Sources
Other Literature Sources
