. 2016 Nov;13(6):785-794.
doi: 10.1038/cmi.2015.72. Epub 2015 Jul 13.

Transcription factor IRF8 controls Th1-like regulatory T-cell function

Affiliations

Transcription factor IRF8 controls Th1-like regulatory T-cell function

Wonyong Lee et al. Cell Mol Immunol. 2016 Nov.

Abstract

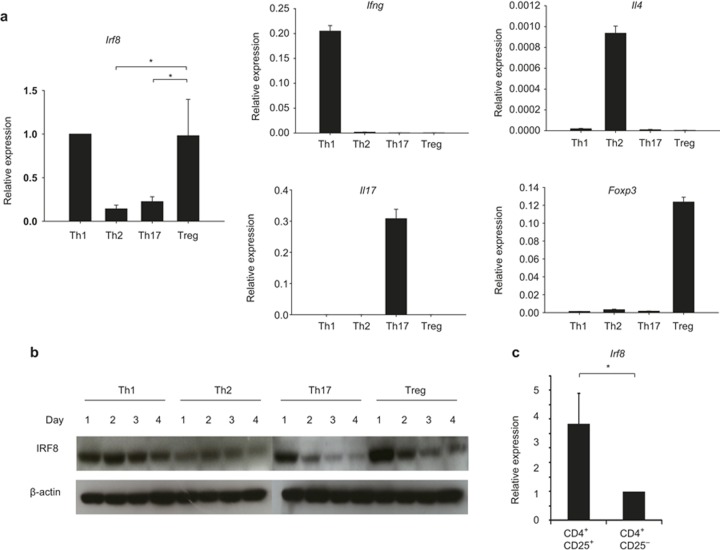
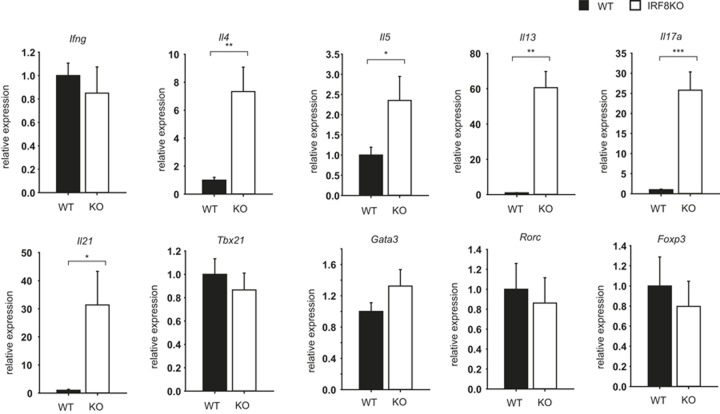
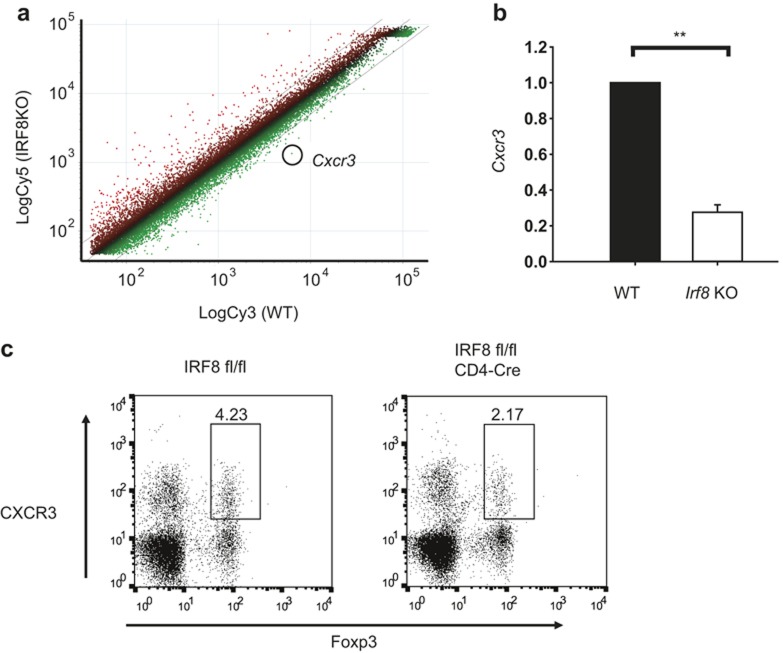
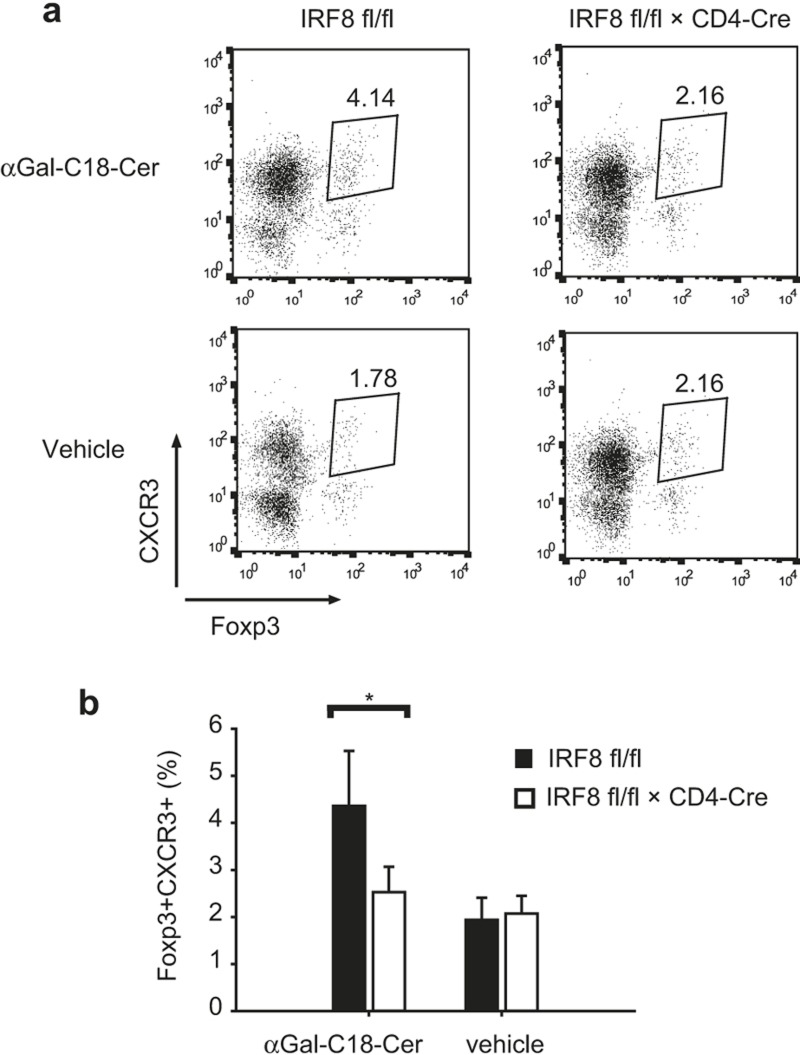
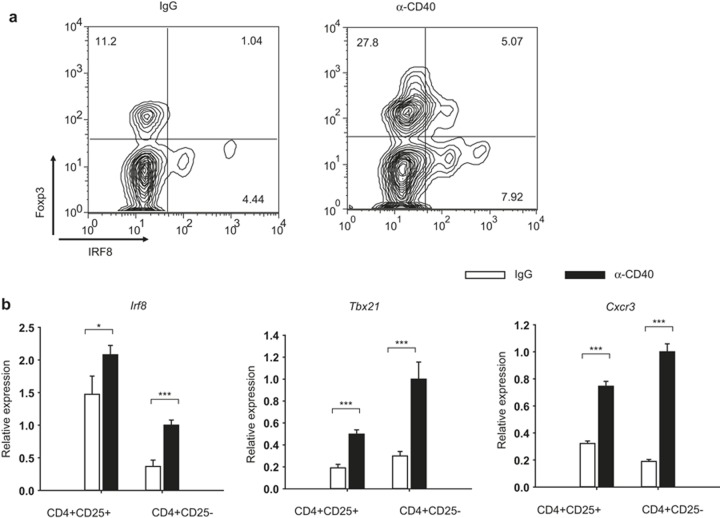
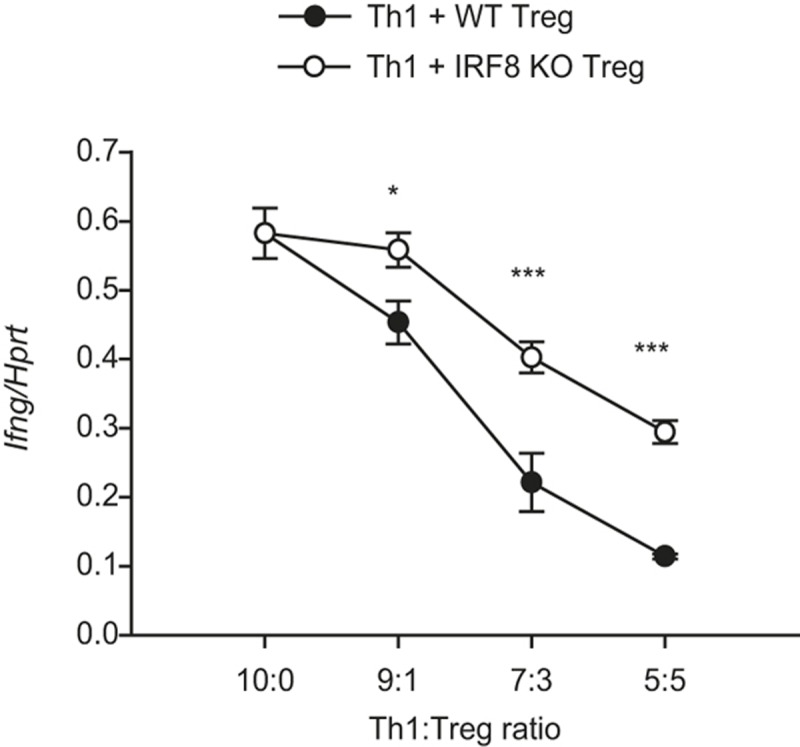
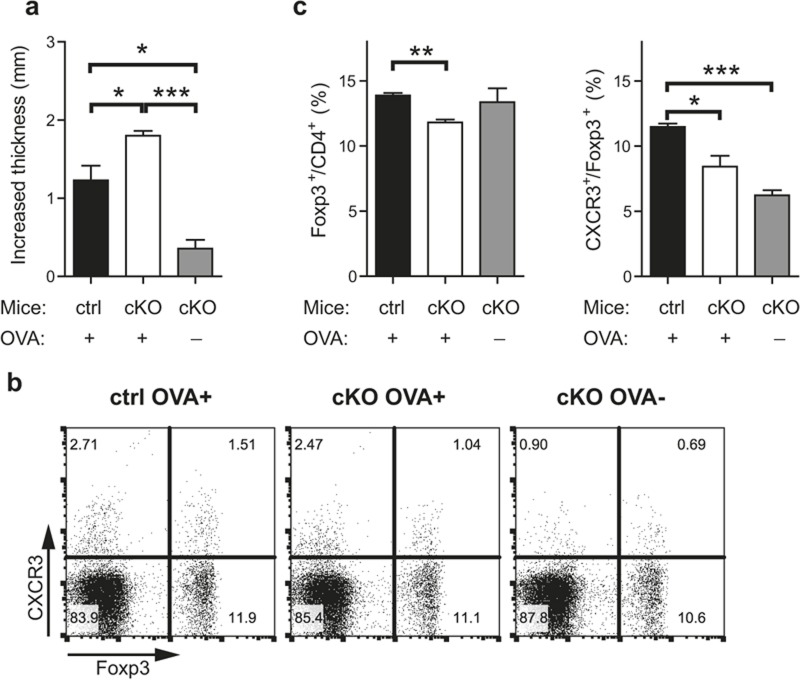
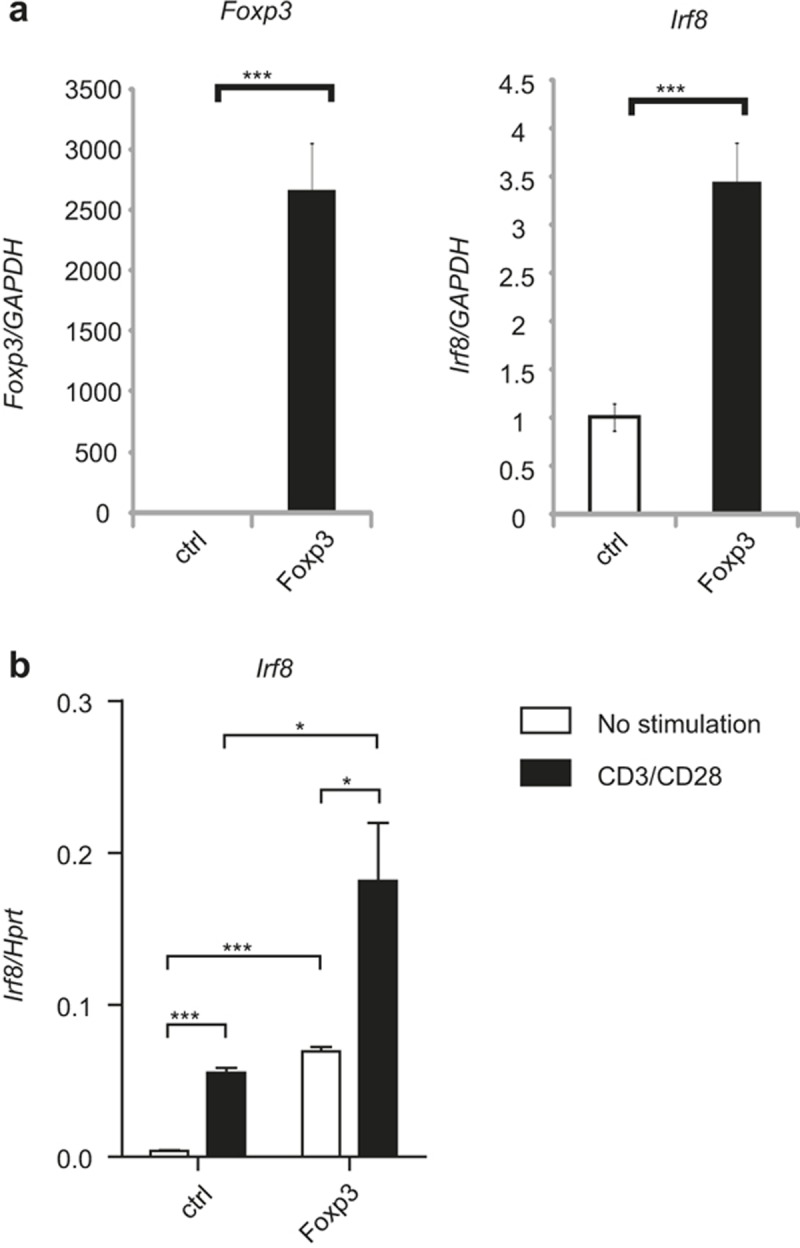
Recent studies have suggested that regulatory T (Treg) cells comprise a heterogeneous population that regulates various aspects of the immune response, and that Treg cells use the factors that are expressed in their target cells to regulate them. We searched for factors that regulate Th1 response in Treg cells using a meta-analysis. In the process, we discovered that transcription factor interferon regulatory factor 8 (IRF8) was selectively expressed in Treg and Th1 cells. IRF8-deficient Treg cells showed defective expression of CXCR3 and aberrant expression of the Il4 and Il17 genes. Upon treatment with alpha galactosyl-C18-ceramide (αGal-C18-Cer), IRF8-deficient mice showed defective Treg cell recruitment in the liver. Eliciting Th1 immune response by anti-CD40 antibody injection in mice induced IRF8 expression in Treg cells. The expression of IRF8 was induced by Foxp3 in Treg cells. IRF8 had no effect on T-bet expression in Treg and vice versa. Thus, our results strongly suggest that IRF8 controls Th1 immune response in Treg cells independent of T-bet.


Figures

Figure 1
Figure 1
Treg- and Th1-specific expression of Irf8. (a) Splenic naïve CD4 T cells from C57BL/6 mice were stimulated with anti-CD3 and anti-CD28 and polarized in vitro under Th1, Th2, Th17, and Treg conditions for four days. RNA was isolated from the cells and subjected to quantitative RT-PCR. (b) Experiments were done as in (a). Cells were harvested at days 1, 2, 3, and 4, and western blotting was performed with an anti-IRF8 or anti-β-actin antibody (c). Splenic CD4 T cells were sorted based on the surface expression of CD4 and CD25. RNA was isolated from the cells and subjected to quantitative RT-PCR. The y-axis shows the relative expression amount of each gene to the internal control Hprt (encoding HPRT).The error bar shows standard deviation (n = 3). Statistical difference was analyzed by Student's t-test. *p < 0.05. Data are representative of three independent experiments with similar results.
Figure 2
Figure 2
Aberrant expression of Il4 and Il17 in IRF8-deficient cells. Splenic naïve CD4 T cells from wild-type or IRF8-deficient mice were differentiated in vitro into Treg for four days. RNA was isolated from the cells and subjected to quantitative RT-PCR. The amount of each gene was normalized to the internal control Hprt (encoding HPRT). The y-axis shows the relative amount between wild-type and IRF8 knockout (KO) (the value of wild type was arbitrarily set 1). The error bar shows standard deviation (n = 3). Statistical difference was analyzed by Student's t-test. *p < 0.05; **p < 0.01; ***p < 0.001. Data are representative of three to five independent experiments with similar results.
Figure 3
Figure 3
Defective expression of CXCR3 in IRF8-deficient Treg cells. (a) Scatterplot of the microarrary analysis. Cxcr3 gene was down-regulated 4.6-fold in IRF8-deficient CD4+CD25+ cells compared that in wild-type counterpart. (b) Splenic CD4+CD25+ cells were isolated from wild-type or IRF8-deficient mice. RNA was isolated from the cells and subjected to quantitative RT-PCR. The error bar shows standard deviation (n = 3). Statistical difference was analyzed by Student's t-test. **p < 0.01. (c) Splenic cells from control (IRF8 fl/fl) or CD4-specifgic IRF8-deficient (IRF8 fl/fl × CD4-Cre) mice were stained with anti-CD4, anti-Foxp3, and anti-CXCR3 antibodies, and analyzed by fluorescence-activated cell sorting (FACS). Cells were gated on CD4.
Figure 4
Figure 4
Defective recruitment of CXCR3+ Treg cells to an inflammation site. (a) Wild-type or CD4-specific IRF8-deficient mice were injected with αGal-C18-Cer or vehicle control intraperitoneally. After one day, CD4 T cells were isolated from the liver and the expression of Foxp3 and CXCR3 was analyzed by FACS. Data are representative of three independent experiments with similar results. (b) Ratio of Foxp3+CXCR3+ cells in CD4 T cells from the liver. Three experiments of (a) were combined. The error bar shows standard deviation (n = 3∼8). Statistical difference was analyzed by Student's t-test. *p < 0.05.
Figure 5
Figure 5
IRF8 is induced in Treg upon Th1 immune response. (a) Anti-CD40 antibody was injected into C57BL/6 mice intraperitoneally on days 0, 2, and 4. On day 6, splenic cells were stained with anti-CD4, anti-Foxp3, and anti-CXCR3 antibodies, and analyzed by FACS. Cells were gated on CD4. Data are representative of six independent experiments with similar results. (b) Anti-CD40 antibody was injected as described in (a). On day 6, splenic CD4+CD25+ or CD4+CD25 cells were isolated by FACS. RNA was isolated from the cells and the expression of genes was measured by quantitative RT-PCR. The y-axis shows the relative expression amount of each gene to the internal control Hprt (encoding HPRT). The error bar shows standard deviation (n = 3). Statistical difference was analyzed by Student's t-test. *p < 0.05; ***p < 0.001.
Figure 6
Figure 6
IRF8 is required for Treg cell-mediated suppression of Th1 cells. In vitro-differentiated CD45.1+ Th1 cells were mixed with WT- or IRF8-deficient CD45.2+ iTreg cells at the ratios of 10:0, 9:1, 7:3, and 5:5 and cultured under Th1-polarizing conditions for two days. CD45.1+ cells were sorted, and expression of Ifng was examined by qRT-PCR. The error bar shows standard deviation (n = 3). Statistical difference was analyzed by Student's t-test. *p < 0.05, ***p < 0.001.
Figure 7
Figure 7
IRF8-expressing Treg cells play a role in controlling cell-mediated immune response. DTH was induced by injecting OVA into control or CD4-specific IRF8-deficient mice as described in the Materials and Methods section. (a) Footpad swelling of the challenged mice was measured, and increased thickness was calculated by subtracting thickness of immunized foot from that of unimmunized foot. ctrl: control mice (IRF8 fl/fl mice), cKO: conditional IRF8 KO mice (IRF8 fl/fl × CD4-Cre mice). (bc). Mice from (a) were killed, and cells from the right side of inguinal lymph nodes were isolated, stained with anti-CD4, anti-CXCR3, and anti-Foxp3 antibodies, and analyzed by flow cytometry. Cells were gated on CD4. The error bar shows S.E.M. (n = 3). Statistical difference between groups was analyzed by Student's t-test. *p < 0.05; **p < 0.01; ***p < 0.001.
Figure 8
Figure 8
Foxp3 controls IRF8 expression. (a) Naïve CD4 T cells isolated from C57BL/6 mice were transduced with either control (MIEG)- or Foxp3-retroviral vector and stimulated under Th0 conditions. Transduced cells were sorted based on GFP expression, and RNA was isolated from the cells. Expression of Foxp3 and Irf8 was measured by quantitative RT-PCR. The error bar shows standard deviation (n = 3). Statistical difference was analyzed by Student's t-test. ***p < 0.001. (b) EL4 cells were transfected with control (CMV) or Foxp3-expression vector and stimulated with anti-CD3 and anti-CD28. RNA was isolated from the cells and the expression of Irf8 was analyzed by quantitative RT-PCR. The error bar shows standard deviation (n = 3). Statistical difference was analyzed by Student's t-test. *p < 0.05, **p < 0.01. Data are representative of four independent experiments with similar results.

References

    1. Josefowicz SZ, Lu LF, Rudensky AY. Regulatory T cells: mechanisms of differentiation and function. Annu Rev Immunol 2012; 30: 531–564. - PMC - PubMed
    1. Sakaguchi S, Yamaguchi T, Nomura T, Ono M. Regulatory T cells and immune tolerance. Cell 2008; 133: 775–787. - PubMed
    1. Campbell DJ, Koch MA. Phenotypical and functional specialization of FOXP3+ regulatory T cells. Nat Rev Immunol 2011; 11: 119–130. - PMC - PubMed
    1. Hall BM, Verma ND, Tran GT, Hodgkinson SJ. Distinct regulatory CD4+T cell subsets; differences between naive and antigen specific T regulatory cells. Curr Opin Immunol 2011; 23: 641–647. - PubMed
    1. Koch MA, Tucker-Heard G, Perdue NR, Killebrew JR, Urdahl KB, Campbell DJ. The transcription factor T-bet controls regulatory T cell homeostasis and function during type 1 inflammation. Nat Immunol 2009; 10: 595–602. - PMC - PubMed

Publication types

MeSH terms