. 2015 Jul 20;25(14):1842-51.
doi: 10.1016/j.cub.2015.06.021. Epub 2015 Jul 9.

Aurora A Kinase Contributes to a Pole-Based Error Correction Pathway

Affiliations

Aurora A Kinase Contributes to a Pole-Based Error Correction Pathway

Anna A Ye et al. Curr Biol. .

Abstract

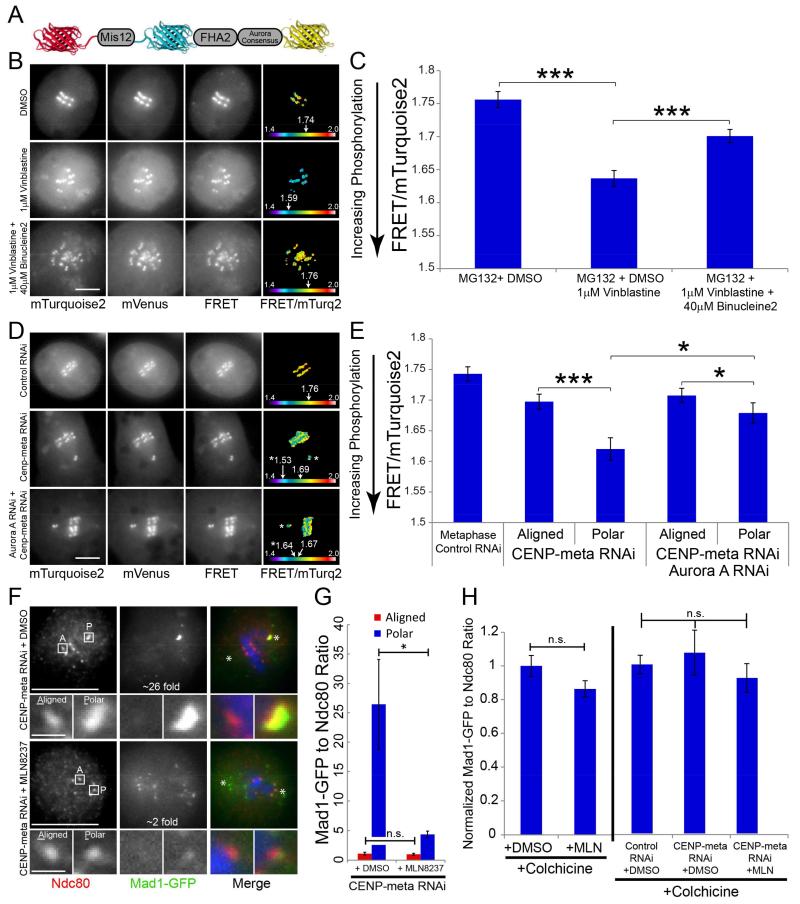
Chromosome biorientation, where sister kinetochores attach to microtubules (MTs) from opposing spindle poles, is the configuration that best ensures equal partitioning of the genome during cell division. Erroneous kinetochore-MT attachments are commonplace but are often corrected prior to anaphase. Error correction, thought to be mediated primarily by the centromere-enriched Aurora B kinase (ABK), typically occurs near spindle poles; however, the relevance of this locale is unclear. Furthermore, polar ejection forces (PEFs), highest near poles, can stabilize improper attachments by pushing mal-oriented chromosome arms away from spindle poles. Hence, there is a conundrum: erroneous kinetochore-MT attachments are weakened where PEFs are most likely to strengthen them. Here, we report that Aurora A kinase (AAK) opposes the stabilizing effect of PEFs. AAK activity contributes to phosphorylation of kinetochore substrates near poles and its inhibition results in chromosome misalignment and an increased incidence of erroneous kinetochore-MT attachments. Furthermore, AAK directly phosphorylates a site in the N-terminal tail of Ndc80/Hec1 that has been implicated in reducing the affinity of the Ndc80 complex for MTs when phosphorylated. We propose that an AAK activity gradient contributes to correcting mal-oriented kinetochore-MT attachments in the vicinity of spindle poles.


Figures

Figure 1
Figure 1
AAK activity is highest near spindle poles and counteracts the kt-MT attachment stabilizing effect of elevated PEFs. (A) Still frames from a time-lapse of a dividing S2 cell expressing inducible NOD-mCherry and inducible AAK-GFP. (B) Spinning disk confocal images showing examples of low (top) and high (bottom) over-expressing cells. Microtubule localization is more evident in the higher expressing cell. (C) Normalized fluorescence intensities of AAK-GFP and Tag-RFP-α-tubulin along the length of 14 mitotic spindles (normalized for variability in spindle length) from cells with a range of AAK-GFP over-expression. AAK-GFP is most abundant at centrosomes and its levels are slightly higher closer to the spindle poles than in the mid-spindle. (D) Plots of percent syntelic attachments versus NOD-mCherry fluorescence for cells with (green) and without (red) AAK-GFP over-expression. PEF-mediated stabilization of syntelic attachments is less potent in AAK-GFP over-expressing cells. Data from 6 independent experiments were fit with a hyperbolic function; Control; n = 64 cells, Aurora A over-expression; n = 117 cells. R-values are 0.81 (no Aurora A over-expression) and 0.72 (Aurora A over-expression). (E) Mean percent syntelic attachments for low and high NOD-expressing cells, defined by the halfway point of the expression range in control cells, in control versus AAK-GFP over-expressing (inset) cells. The percentage of syntelic attachments is significantly lower in AAK over-expressing cells than in control cells at low and high NOD expression levels. (F) AAK-GFP levels were quantified and the mean percent of syntelic attachments in cells from both the lower and upper half of the AAK-GFP over-expression range are significantly lower than groupings of control cells with comparable levels of NOD over-expression. (G) Maximum intensity projections of Ndc80-GFP (green), NOD-mCherry (red) expressing cells with and without over-expressed AAK-GFP (green) but with comparable levels of NOD-mCherry. The percentage of syntelic attachments, which is lower in the AAK-GFP over-expressing cell, is shown in the merged images. (H) Schematic of the microtubule-targeted Tau-Aurora FRET sensor used in this study. (I) Representative images of cells co-expressing TagRFP-T-α-tubulin and the Tau-Aurora FRET reporter treated with binucleine 2 and MG132. The FRET emission ratio images “FRET/mTurq2” are pseudo-colored and the color wedge spans ratio values of 1.5 (black) to 2.0 (yellow). Examples of cells with Weak/Undetectable (<5% reduction), Moderate (5-10% reduction), and Strong gradients (>10% reduction) as defined by the % reduction in normalized FRET emission ratio in the monopole center relative to 3 μm away are shown. (J-L) Normalized FRET ratios across monopoles (normalized tubulin intensity) from 10 cells per condition. Each plot contains data reflecting the percentage of each type of gradient in that condition (for example, the control RNAi plot is from 7 strong, 2, moderate and 1 weak/undetectable). Control RNAi, n = 35 cells; Aurora A RNAi, n = 45 cells; Tau-nonPhospho, n =41 cells. Scale bars, 10 μm (a, e, i), 5 μm (b, g). Error bars are SEM. Two-tailed p-values of Student’s t-test are reported: * p-value < 0.05, ** p-value < 0.005, *** p-value < 0.0005.
Figure 2
Figure 2
AAK contributes to elevated levels of kinetochore phosphorylation and reduced kt-MT attachment stability near spindle poles. (A) Schematic of the kinetochore-targeted Mis12-Aurora FRET sensor used in this study. (B) Representative images of the FRET reporter in the conditions shown in (C). The FRET emission ratio images “FRET/mTurq2” are pseudo-colored and the arrows point to the position on the color wedge (spanning ratio values of 1.4 to 2.0) corresponding to the average emission ratio measured for the kinetochore-targeted sensor in that cell. (C) Vinblastine treatment, to generate unattached kinetochores, lowers the emission ratio of the FRET reporter indicating that it is more phosphorylated. Binucleine 2 treatment leads to an increase in the reporter FRET emission ratio at kinetochores in vinblastine-treated cells demonstrating that ABK contributes to phosphorylation of the sensor at unattached kinetochores. Mean values from 3 independent experiments; DMSO; n = 106 cells, vinblastine; n = 104 cells, vinblastine + binucleine 2; n =108 cells. (D) Representative images of the FRET reporter in the conditions shown in (E). The FRET emission ratio images “FRET/mTurq2” are pseudo-colored and the arrows point to the position on the color wedge (spanning ratio values of 1.4 to 2.0) corresponding to the FRET emission ratios measured for the sensor at aligned and, when appropriate, polar kinetochores (asterisk) in that cell. (E) The mean FRET emission ratio of the sensor is lower at polar kinetochores, generated by depleting CENP-meta, than at aligned kinetochores. Co-depleting AAK leads to an increase in the emission ratio at polar kinetochores compared to polar kinetochores in CENP-meta depleted. Thus, the sensor is more phosphorylated at kinetochores near spindle poles than at bioriented kinetochores and AAK contributes to this difference in the phosphorylation state. Mean values from 3 independent experiments; Control RNAi; metaphase; n = 119 cells, CENP-meta RNAi; metaphase; n = 98, misaligned; n = 107; CENP-meta, Aurora A double RNAi; metaphase; n =106, misaligned; n = 120. (F) Single planes from representative images of CENP-meta depleted Mad1-GFP (green in merged images) expressing cells treated with DMSO or 125 nM MLN8237 and stained for Ndc80 (red) and DAPI (blue). Examples of aligned (A) and polar (P) kinetochores for each condition are shown in the (5× zoom) insets. The fold-enrichments of Mad1 at the polar relative to aligned kinetochores are indicated in the Mad1-GFP images for each cell. Asterisks indicate the position of the spindle poles. (G) Quantifications of fold Mad1-GFP enrichment at polar kinetochores in CENP-meta depleted cells treated with DMSO (control) or 125 nM MLN8237. Mean values from CENP-meta RNAi + DMSO; n = 18 polar kinetochores; n = 42 aligned kinetochores, CENP-meta RNAi + MLN; n = 46 polar kinetochores, n = 48 aligned kinetochores. (H) Levels of Mad1-GFP ratioed to Ndc80 at unattached kinetochores are unaffected by MLN treatment and CENP-meta depletion. Mean values from 2 independent experiments with colchicine +: DMSO, n = 255 kinetochores; MLN8237, n = 255 kinetochores; Control RNAi + DMSO, n = 200 kinetochores; CENP-meta RNAi + DMSO, n = 198 kinetochores; CENP-meta RNAi + MLN8237, n = 200 kinetochores. All error bars represent the SEM. Scale bars, 5 μm (b, d), 10 μm (f), 1 μm (f-insets). Two-tailed p-values of Student’s t-test are reported in (c, g, h) and p-values from Mann-Whitney Wilcoxon t-test are reported in (e): not significant (n.s.) p-value > 0.05, * p-value < 0.05, *** p-value < 0.0005.
Figure 3
Figure 3
AAK is required for efficient error correction in Drosophila S2 cells. (A) Representative maximum projections from confocal z-sections of control and AAK-depleted cells stained for Ndc80 (red in the merged image), phospho-Aurora B, tubulin (green) and DAPI (blue). Misaligned chromosomes with normal levels of centromere-enriched phospho-Aurora B are more prevalent in AAK depleted cells than in control cells. (B) Quantification of the percentage of MG132-treated cells with normal metaphase plates and misaligned chromosomes in control and AAK-depleted cells. Mean values from 3 independent experiments; Control RNAi; n = 317 cells, Aurora A RNAi; n = 326 cells. (C) Representative maximum projections from confocal z-sections of DMSO and MLN8237-treated cells stained for Ndc80 (red in the merged image), phospho-Aurora B, tubulin (green) and DAPI (blue). Treatment with 125 nM MLN8237 phenocopies AAK depletion. (D) Quantification of the percentage of MG132-treated cells with normal metaphase plates and misaligned chromosomes in DMSO- and MLN8237-treated cells. Mean values from 3 independent experiments; DMSO; n = 318 cells, 125 nM MLN8237; n = 322 cells. (E) Zoomed views of the insets highlighted in the DAPI channel in (a). In the merged image Ndc80 is red, tubulin is green and DAPI is blue. (F) Mean values of each type of attachment at misaligned chromosomes in control- and AAK-depleted cells from 3 independent experiments; Control RNAi; n = 71 kinetochore pairs, Aurora A RNAi; n = 80 kinetochore pairs. (G) Zoomed views of the insets highlighted in the DAPI channel in (c). In the merged image Ndc80 is red, tubulin is green and DAPI is blue. Arrow points to a syntelic (S) attachment. (H) Mean values of each type of attachment at misaligned chromosomes in DMSO- and MLN8237-treated cells from 3 independent experiments; n = 75 kinetochore pairs each for DMSO and MLN conditions. (i) Still frames from a spinning disk confocal time-lapse of an Ndc80-GFP expressing S2 cell depleted of AAK. Inset shows an 8× zoom of the highlighted region. Two-tailed p-values of Student’s t-test are reported. Error bars are SEM. Scale bars are 5 μm (a, c) and 2 μm (e, g). Two-tailed p-values of Student’s t-test are reported: * p-value < 0.05, ** p-value < 0.005.
Figure 4
Figure 4
AAK contributes to error correction in mammalian cells and phosphorylates the N-terminal tail of Ndc80/Hec1 in human cells. (A) Representative maximum projections of confocal z-sections of PtK1 cells treated with 1 μM MLN8054 and stained for tubulin (red) and centromeres (green). Arrows point to polar, misaligned chromosomes. (B) Scatter plots of relative kinetochore positions normalized to the spindle length in control and MLN8054-treated PtK1 cells. The “0” position represents the spindle pole and the “50” position marks the mid-spindle (dashed black line). The average centromere position (black bar) is closer to the spindle poles in MLN8054-treated cells than in control cells and a significant population of kinetochores are “pinned” to the poles (near 0) in MLN8054-treated cells (red box). Control; n = 406 kinetochores, and 1 μM MLN8054; n = 642 kinetochores. (C) Representative images (maximum projection – left, and single focal plane – right) of a PtK1 cell treated with 1 μM MLN8054 and stained for tubulin (red) and centromeres (green). Arrows point to a merotelic kinetochore at the metaphase plate that is attached to both spindle poles. (D) MLN8054 treatment leads to a significant increase in the average number of merotelic attachments per cell relative to control cells. Control; n = 191 kinetochores from 11 cells, 1 μM MLN8054; n = 144 kinetochores from 9 cells. (E) MLN8054 treatment leads to a significant increase in the percentage of lagging chromosomes in anaphase cells relative to control cells. Mean values of lagging chromosomes from 3 independent experiments for Control; n = 270 anaphase chromosomes, and 1 μM MLN8054; n = 268 anaphase chromosomes. (F) Representative images of control (DMSO) and AAK inhibited (300 nM MLN8237) HeLa cells stained for pSer55-Ndc80 (red) and Ndc80 (green). (G) Mean values of pSer55-Ndc80 to Ndc80 ratios for DMSO; n = 280 kinetochores from 14 cells, and 300 nM MLN; n = 275 kinetochores from 12 cells. (H) An in vitro phosphorylation assay with purified Ndc80 bonsai complex plus and minus purified AAK blotted for anti-pSer55. AAK directly phosphorylates Ndc80 in vitro. (I) Representative images of GSK923295-treated HeLa cells plus and minus MLN8237 stained for pSer55-Ndc80 (red) and Ndc80 (green). (J) Polar kinetochores are more phosphorylated than aligned kinetochores in GSK923295-treated cells and the polar bias in Ser55 phosphorylation is lost in the presence of MLN8237. Mean values of pSer55-Ndc80 to Ndc80 ratios from 4 independent experiments for GSK923295; aligned, n = 408 kinetochores from 68 cells; polar, n = 239 kinetochores from 68 cells; and 3 independent experiments for GSK923295 + MLN 8237; aligned, n = 465 kinetochores from 55 cells; polar, n = 207 kinetochores from 55 cells. (K) A spatiotemporal model for the path from mal- to bioriented chromosomes. As a syntelic attachment moves poleward it becomes stabilized as it encounters increasing PEFs until encountering the AAK phosphorylation gradient. AAK mediates error correction by phosphorylating kt-MT attachment factors such as Ndc80/Hec1 at Ser55. The AAK gradient also facilitates congression by biasing CENP-E activity towards the mid-spindle and by allowing PEFs to push chromosome arms away from the poles without stabilizing syntelic attachments. Error bars are SEM. Scale bars are 5 μm (a, c) and 10 μm (f). Two-tailed p-values of Student’s t-test are reported: not significant (n.s.) p-value > 0.05, * p-value < 0.05, ** p-value < 0.005, *** p-value < 0.0005.

Comment in

Similar articles

Cited by

References

    1. Cimini D, Moree B, Canman JC, Salmon ED. Merotelic kinetochore orientation occurs frequently during early mitosis in mammalian tissue cells and error correction is achieved by two different mechanisms. J Cell Sci. 2003;116:4213–4225. - PubMed
    1. Kitajima TS, Ohsugi M, Ellenberg J. Complete kinetochore tracking reveals error-prone homologous chromosome biorientation in mammalian oocytes. Cell. 2011;146:568–581. - PubMed
    1. Cimini D, Wan X, Hirel CB, Salmon ED. Aurora kinase promotes turnover of kinetochore microtubules to reduce chromosome segregation errors. Curr Biol. 2006;16:1711–1718. - PubMed
    1. Kelly AE, Funabiki H. Correcting aberrant kinetochore microtubule attachments: an Aurora B-centric view. Curr Opin Cell Biol. 2009;21:51–58. - PMC - PubMed
    1. Tanaka TU, Rachidi N, Janke C, Pereira G, Galova M, Schiebel E, Stark MJ, Nasmyth K. Evidence that the Ipl1-Sli15 (Aurora kinase-INCENP) complex promotes chromosome bi-orientation by altering kinetochore-spindle pole connections. Cell. 2002;108:317–329. - PubMed

Publication types

MeSH terms