Review
. 2015 Feb;178(1):43-88.
doi: 10.1002/jpln.201400327. Epub 2015 Jan 12.

Innovative methods in soil phosphorus research: A review

Affiliations
Review

Innovative methods in soil phosphorus research: A review

Jens Kruse et al. J Plant Nutr Soil Sci (1999). 2015 Feb.

Abstract

Phosphorus (P) is an indispensable element for all life on Earth and, during the past decade, concerns about the future of its global supply have stimulated much research on soil P and method development. This review provides an overview of advanced state-of-the-art methods currently used in soil P research. These involve bulk and spatially resolved spectroscopic and spectrometric P speciation methods (1 and 2D NMR, IR, Raman, Q-TOF MS/MS, high resolution-MS, NanoSIMS, XRF, XPS, (µ)XAS) as well as methods for assessing soil P reactions (sorption isotherms, quantum-chemical modeling, microbial biomass P, enzymes activity, DGT, 33P isotopic exchange, 18O isotope ratios). Required experimental set-ups and the potentials and limitations of individual methods present a guide for the selection of most suitable methods or combinations.

Keywords: nutrient cycling; phosphate; soil chemistry; speciation; spectroscopy.


Figures

Figure 1
Figure 1
Schematic presentation of the soil phosphorus (P) cycle. The names in the black boxes (I = Inputs, P = Pools, R = Reactions, and L = Losses) are also used in Table 2 (below) to indicate which methods are suitable to characterize the respective part of the P cycle.
Figure 2
Figure 2
1D and 2D 31P, 1H NMR spectra of an extract originating from a humus soil sample in a boreal forest approx. 25 km N of Umeå, Sweden. The displayed spectral region contains signals from orthophosphate monoesters. The bold 1D 31P NMR spectrum originates from a soil extract without sulfide treatment, while the thin 1D and the 2D 31P, 1H NMR spectrum were obtained from a sulfide-treated extract. The chemical structures of scyllo-inositol hexakisphosphate (A) and of the lipid hydrolysis product α-glycerophosphate (B) are shown as inserts; the bold letters indicate the P–O–CH2 moiety that gives rise to the marked cross peak based on an interaction between the P and H atoms (Vestergren et al., 2013, unpublished).
Figure 3
Figure 3
(a) Examples of typical NIR absorption spectra from soil samples (Cambisols). (b) Model calibration results, predicted vs. measured, for NaOH soluble organic P (Po) (Niederberger et al., 2013, unpublished).
Figure 4
Figure 4
Raman spectrum of heated Ag3P18O4 and the respective peak shifts due to successive 18O exchange (Lewandowski and Amelung, 2013, unpublished). The color image of this figure is in the digital version of this article.
Figure 5
Figure 5
Van Krevelen diagram of assigned molecular masses (m/z) of dissolved organic matter (DOM) samples measured by FT ICR-mass spectrometry. Modified replot from Abdulla et al. (2013) with permission of ACS Publications. C, H, N, O, S, and P were considered in the sum formula calculations assignment. As an example the insert (lower right) shows all assigned masses with the same nominal mass m/z 369 which could be resolved only by high resolution mass spectrometry. A color image of this figure is in the digital version of this article.
Figure 6
Figure 6
(a) Precolumn derivatization of glyphosate and AMPA: the reaction of FMOC-Cl with glyphosate and AMPA results in the formation of glyphosate-FMOC and AMPA-FMOC with molecular masses of 391 and 333 g mol−1, respectively. (b) Total Ion Chromatogram of the FMOC-derivatives: the derivatized compounds are separated on a reverse phase liquid chromatography system and detected through Tandem Mass Spectrometry after Electrospray Ionization. (c) Operation in the Selected Reaction Monitoring mode allows detection of the compounds based on the m/z ratios of their product ions. The isotope-labelled glyphosate–1,2–13C2–15N and AMPA–13C–15N serve as internal standards (Abraham, 2014, unpublished).
Figure 7
Figure 7
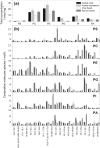
Phospholipid composition of soils from four different sites (arable: crest and depression, forest: pine and spruce) in Northern Germany as determined by Q-TOF MS/MS analysis (n = 5). (a) Total concentration of major phospholipid classes (phosphatidylserine, PS; phosphatidylcholine, PC; phosphatidylethanolamine, PE; phosphatidylglycerol, PG; phosphatidylinositol, PI; phosphatidic acid, PA) in nmol mg−1 soil dry weight (DW). (b) Molecular species composition (mol%) of PS, PC, PE, PG, PI and PA. The data present means and standard deviations of five replicas (Siebers et al., , unpublished).
Figure 8
Figure 8
Spatial distribution of (a) 12C14N and (b) 31P in free-living N2-fixing soil bacteria, and (c) 31P/12C and 14N/12C ratios as function of the 35Cl/12C ratio of the bacteria without (black) and under salt stress (white) (Vogts and Baum, 2013, unpublished). A color image of this figure is in the digital version of the article.
Figure 9
Figure 9
(a) Stacked and normalized P K-XANES fluorescence yield spectra of selected soil-relevant P reference compounds and (b) the respective P L2,3-edge spectra. (c) Long-range scan of amorphous Ca-phosphate at the P K-edge visualizing the XANES and the EXAFS region of the spectrum in energy space, (d) respective k-space transformed, and (e) Fourier transformed χ(k) data of amorphous Ca-phosphate, giving information on the type and distances of bondings (Kruse, 2013, unpublished).
Figure 10
Figure 10
Distribution of acid and alkaline phosphatase activity in the rhizosphere of Lupinus albus analyzed by soil zymography. The calibration line is given at the bottom (Spohn and Kuzyakov, , reploted with permission from Elsevier). A color image is in the digital version of this article.
Figure 11
Figure 11
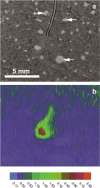
(a) Photograph of a soil area around a root tip of B. napus cv. Caracas that was subjected to 2D diffusive gradients in thin films (DGT) analysis. The root was growing away from the soil surface into the soil, so the actual root surface is covered and not directly accessible to the DGT gel for sampling. Dotted lines give the position of the root axis, but the exact position of the root tip is unknown. (b) Corresponding 2D DGT image of the P distribution around the root with a spatial resolution of 50 x 333 µm. Values are given as CDGT P concentration in ng L−1. Substantially increased P concentrations around the tip were observed, possibly caused by an acidification of the rhizosphere and subsequent P release from the soil solid phase or by P released from dead root border cells. A few entrapped air bubbles (some indicated by arrows) caused zones of very low P concentration in the DGT image (Santner et al., , unpublished). A color image is in the digital version of this article.
Figure 12
Figure 12
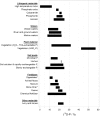
Compilation of published δ18O values for various soil relevant materials and waters of different origin. Data were taken from the Tamburini et al. (2014) and references citied within. Materials marked with an asterisk were taken from Kruse and Leinweber, 2014 (unpublished).

References

    1. Abdi D, Tremblay GF, Ziadi N, Bélanger G, Parent LÉ. Predicting soil phosphorus-related properties using reflectance spectroscopy. Soil Sci. Soc. Am. J. 2012;76:2318–2326.
    1. Abdulla HAN, Sleighter RL, Hatcher PG. Two dimensional correlation analysis of Fourier transform ion cyclotron resonance mass spectra of dissolved organic matter: A new graphical analysis of trends. Anal. Chem. 2013;85:3895–3902. - PubMed
    1. Acelas NY, Mejia SM, Mondragón F, Flórez E. Density functional theory characterization of phosphate and sulfate adsorption on Fe-(hydr)oxide: Reactivity, pH effect, estimation of Gibbs free energies, and topological analysis of hydrogen bonds. Comp. Theor. Chem. 2013;1005:16–24.
    1. Achat DL, Bakker MR, Zeller B, Pellerin S, Bienaimé S, Morel C. Long-term organic phosphorus mineralization in Spodosols under forests and its relation to carbon and nitrogen mineralization. Soil Biol. Biochem. 2010;42:1479–149.
    1. Addiscott TM, Brockie D, Catt JA, Christian DG, Harris GL, Howse KR, Mirza NA, Pepper TJ. Phosphate losses through field drains in a heavy cultivated soil. J. Environ. Qual. 2000;29:522–532.