. 2015:2015:908971.
doi: 10.1155/2015/908971. Epub 2015 Jun 8.

Nanodosimetry-Based Plan Optimization for Particle Therapy

Affiliations

Nanodosimetry-Based Plan Optimization for Particle Therapy

Margherita Casiraghi et al. Comput Math Methods Med. 2015.

Abstract

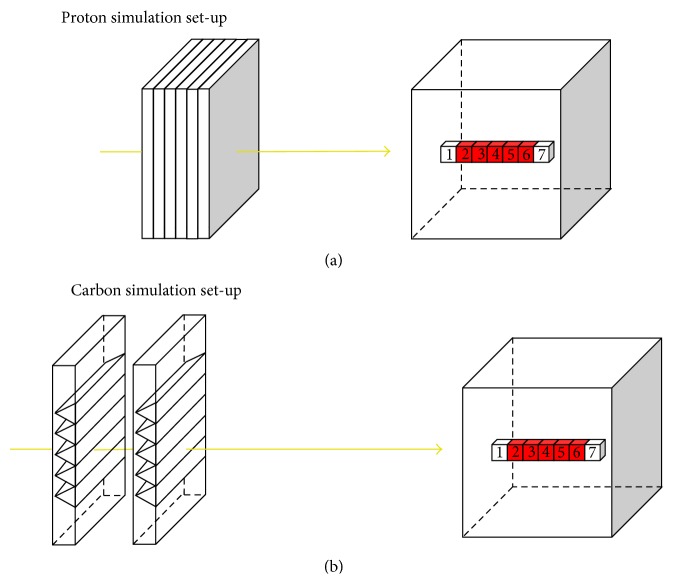
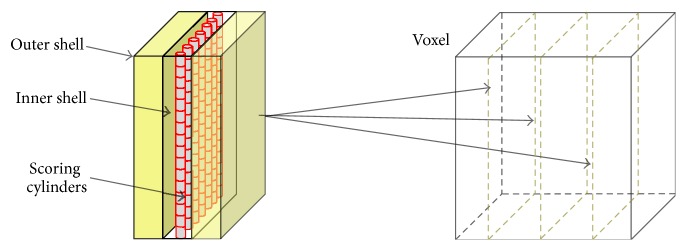
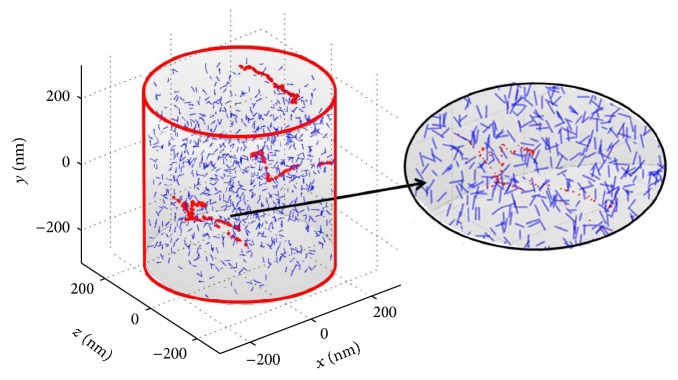
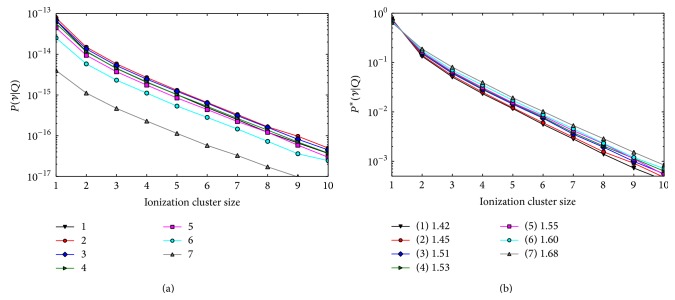
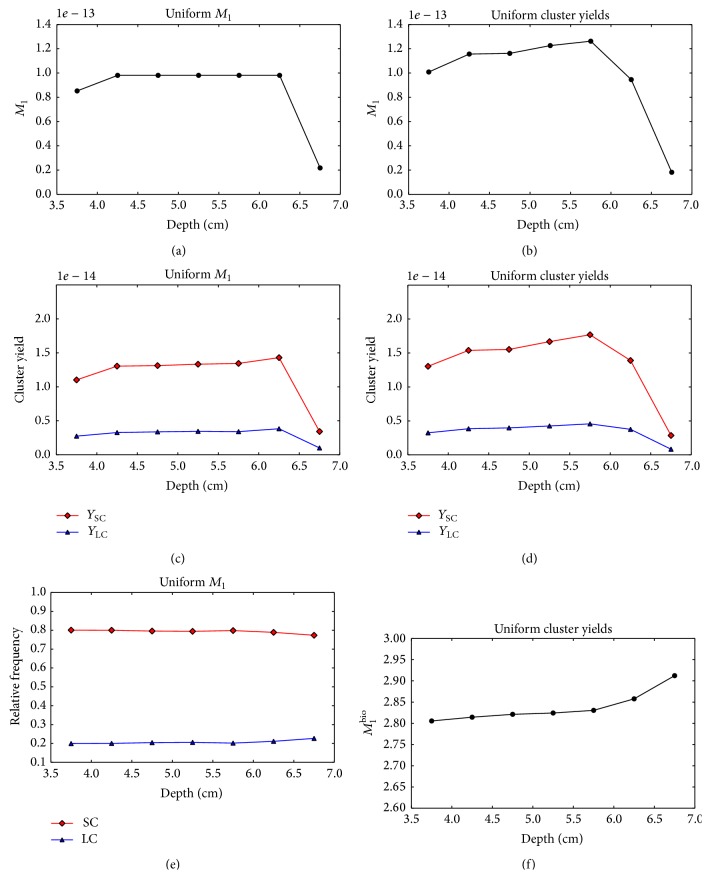
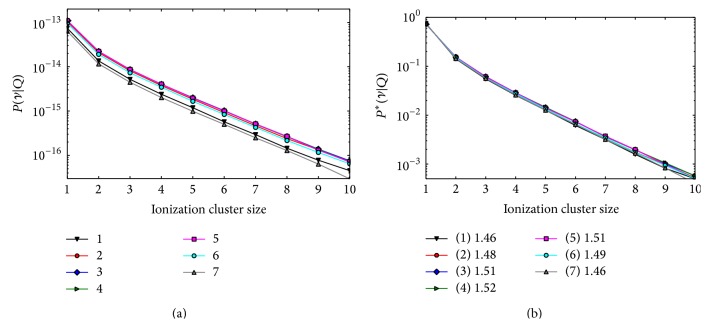
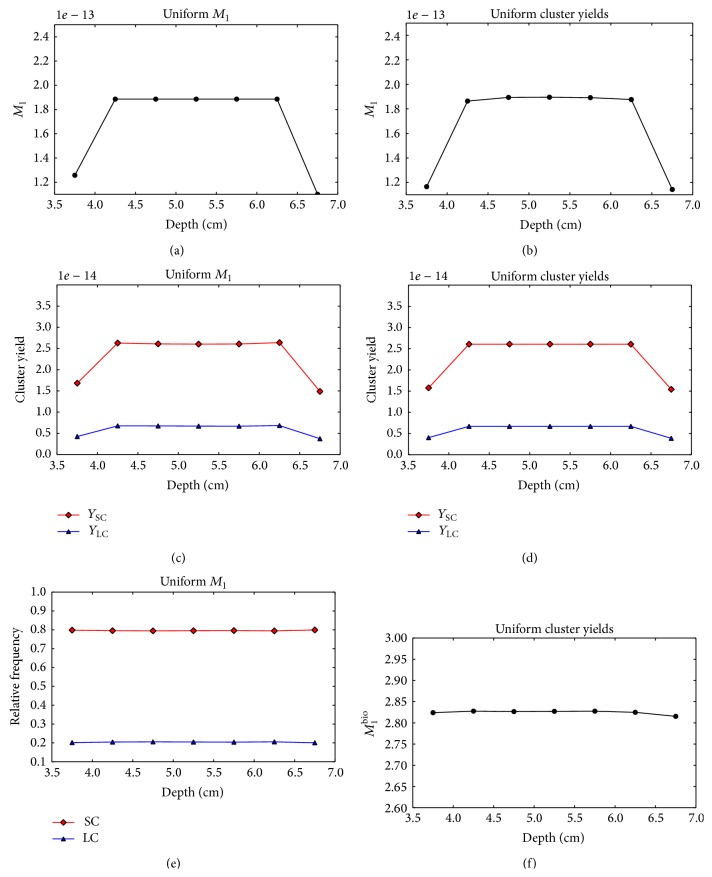
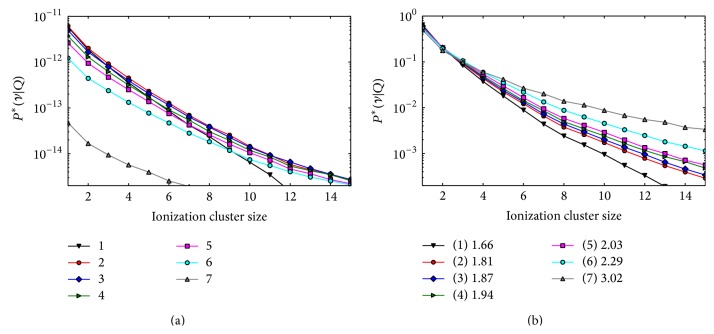
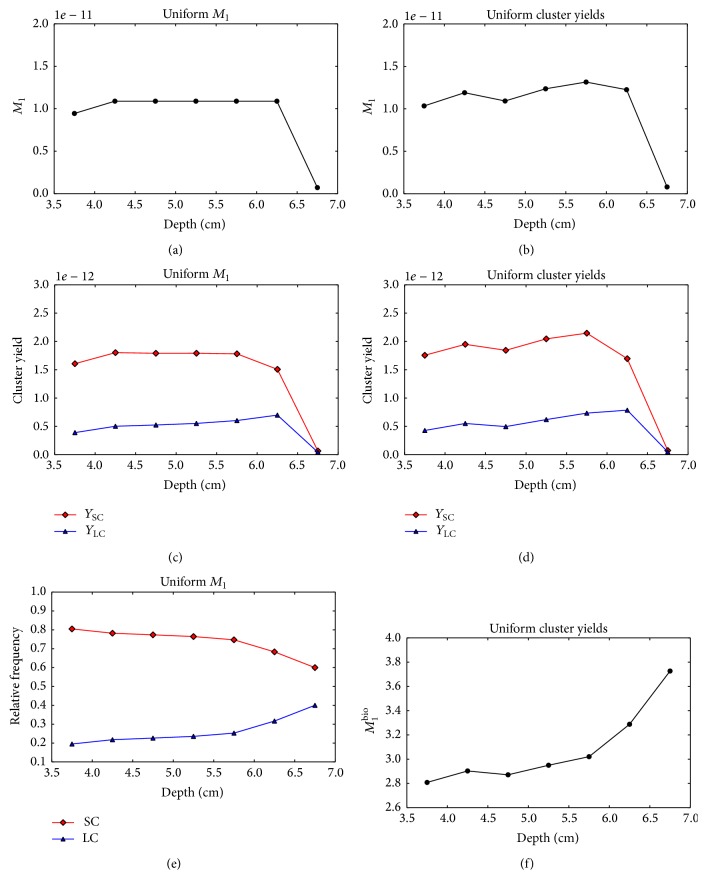
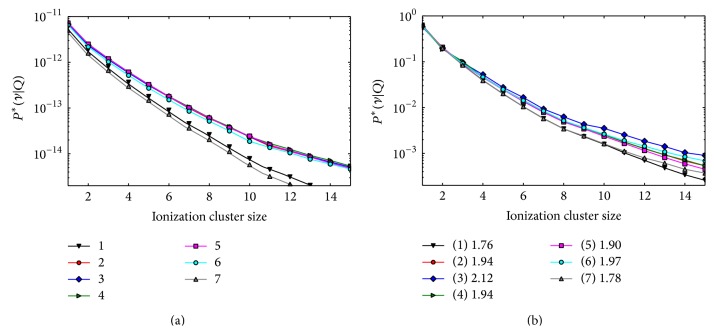
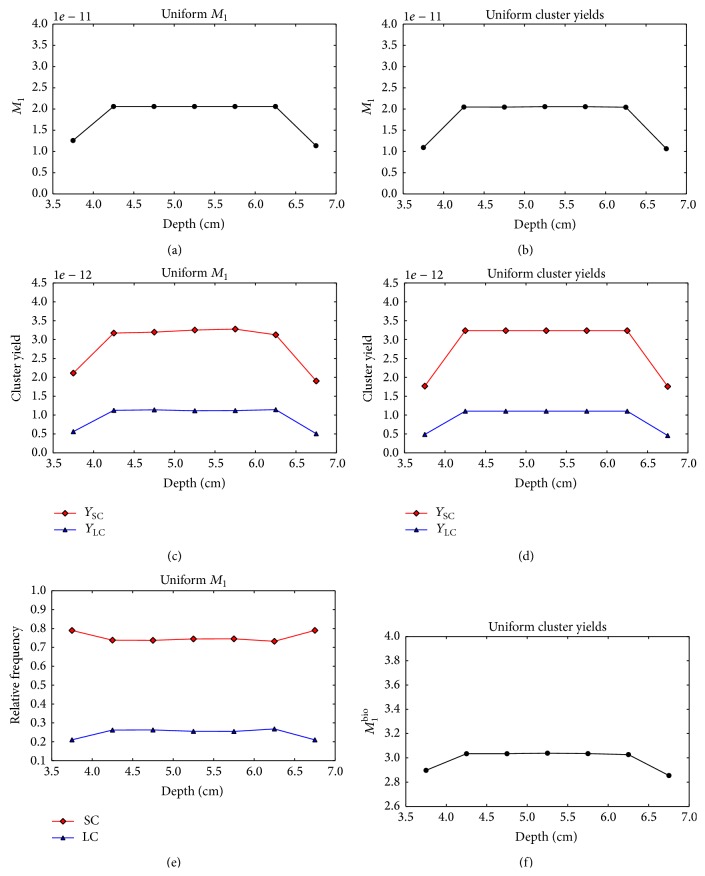
Treatment planning for particle therapy is currently an active field of research due uncertainty in how to modify physical dose in order to create a uniform biological dose response in the target. A novel treatment plan optimization strategy based on measurable nanodosimetric quantities rather than biophysical models is proposed in this work. Simplified proton and carbon treatment plans were simulated in a water phantom to investigate the optimization feasibility. Track structures of the mixed radiation field produced at different depths in the target volume were simulated with Geant4-DNA and nanodosimetric descriptors were calculated. The fluences of the treatment field pencil beams were optimized in order to create a mixed field with equal nanodosimetric descriptors at each of the multiple positions in spread-out particle Bragg peaks. For both proton and carbon ion plans, a uniform spatial distribution of nanodosimetric descriptors could be obtained by optimizing opposing-field but not single-field plans. The results obtained indicate that uniform nanodosimetrically weighted plans, which may also be radiobiologically uniform, can be obtained with this approach. Future investigations need to demonstrate that this approach is also feasible for more complicated beam arrangements and that it leads to biologically uniform response in tumor cells and tissues.


Figures

Figure 1
Figure 1
Sketch of the simulation set-up. Top: proton simulations with range shifters and water phantom shown. Bottom: carbon simulations with two ripple filters and water phantom shown. Red-colored voxels represent the target region.
Figure 2
Figure 2
Sketch, not in scale, of the microscopic simulation geometry. Slabs comprising an outer shell, an inner shell, and a region with scoring cylinders were placed at three positions in each voxel.
Figure 3
Figure 3
Representation of the track sampling procedure. The big cylinder represents one of the scoring cylinders. Small cylinders with random position and orientation were the SVs used for track sampling.
Figure 4
Figure 4
Composite ICSDs obtained in the five target voxels (2–6) and in the two normal tissue voxels (1 and 7) for the single-field proton plan with unit PB fluence. Left panel: absolute distributions. Due to the the large frequency of zero clusters, the zero bin is not shown for a better visualization of the plot. Right panel: conditional distributions. In the legend box, the left panel shows the coding of the corresponding voxels (refer to Figure 1 for the voxel numbering scheme). The legend box in the right panel also shows the M 1 for each voxel.
Figure 5
Figure 5
Nanodsimetric quantities calculated for the optimized single-field proton plans as a function of the voxel depth. Results of the uniform M 1 optimization and uniform cluster yield optimization are shown in the left and right columns, respectively. (a), (b) Composite M 1. (c), (d) Composite Y SC (squares) and Y LC (triangles). (e) Frequency of small clusters Y SC (squares) and large clusters Y LC (triangles) relative to the total yield Y SC + Y LC. (f) Composite M 1 bio.
Figure 6
Figure 6
Composite ICSDs obtained in the five target voxels (2–6) and in the two normal tissue voxels (1 and 7) for the two-field proton plan with unit PB fluence. Left panel: absolute distributions (frequencies of zero clusters not shown). Right panel: conditional distributions. The voxel numbering scheme is the same as Figure 4. The legend box, in the right panel shows the M 1 values for each voxel.
Figure 7
Figure 7
Nanodsimetric quantities calculated for the optimized two-field proton plans as a function of the voxel depth. Results of the uniform M 1 optimization and uniform cluster yield optimization are shown in the left and right columns, respectively. (a), (b) Composite M 1. (c), (d) Composite Y SC (squares) and Y LC (triangles). (e) Frequency of small clusters Y SC (squares) and large clusters, Y LC (triangles) relative to the total yield Y SC + Y LC. (f) composite M 1 bio.
Figure 8
Figure 8
Composite ICSDs obtained in the five target voxels (2–6) and in the two normal tissue voxels (1 and 7) for the single-field carbon plan with unit PB fluence. Left panel: absolute distributions (frequencies of zero clusters not shown). Right panel: conditional distributions. The voxel numbering scheme is the same as Figure 4. The legend box, in the right panel shows the M 1 values for each voxel.
Figure 9
Figure 9
Nanodsimetric quantities calculated for the optimized single-field carbon plans as a function of the voxel depth. Results of the uniform M 1 optimization and uniform cluster yield optimization are shown in the left and right columns, respectively. (a), (b) Composite M 1. (c), (d) Composite Y SC (squares) and Y LC (triangles). (e) Frequency of small clusters, Y SC (squares) and large clusters Y LC (triangles) relative to the total yield Y SC + Y LC. (f) Composite M 1 bio.
Figure 10
Figure 10
Composite ICSD obtained in the five target voxels (2–6) and in the two normal tissue voxels (1 and 7) for the two-field carbon plan with unit PB fluence. Left panel: absolute distributions (frequencies of zero clusters not shown). Right panel: conditional distributions. The voxel numbering scheme is the same as Figure 4. The legend box in the right panel shows the M 1 values for each voxel.
Figure 11
Figure 11
Nanodsimetric quantities calculated for optimized the two-field carbon plans as a function of the voxel depth. Results of the uniform M 1 optimization and uniform cluster yield optimization are shown in the left and right columns, respectively. (a), (b) Composite M 1. (c), (d) Composite Y SC (squares) and Y LC (triangles). (e) Frequency of small clusters Y SC (squares) and large clusters Y LC (triangles) relative to the total yield Y SC + Y LC. (f) Composite M 1 bio.

References

    1. Paganetti H., van Luijk P. Biological considerations when comparing proton therapy with photon therapy. Seminars in Radiation Oncology. 2013;23(2):77–87. doi: 10.1016/j.semradonc.2012.11.002. - DOI - PubMed
    1. Mihailescu D., Borcia C. Biophysical models in hadrontherapy. Journal of Advanced Research in Physics. 2012;3(1)011210
    1. International Atomic Energy Association (IAEA) IAEA. TECDOC-1560. Vienna, Austria: IAEA; 2007. Dose reporting in ion beam therapy.
    1. International Atomic Energy Association (IAEA) TRS-461. Vienna, Austria: International Atomic Energy Association (IAEA); 2008. Relative biological effectiveness in ion beam therapy.
    1. Palmans H., Rabus H., Belchior A. L., et al. Future development of biologically relevant dosimetry. The British Journal of Radiology. 2015;88(1045) doi: 10.1259/bjr.20140392.20140392 - DOI - PubMed

LinkOut - more resources