

The role of visceral and subcutaneous adipose tissue fatty acid composition in liver pathophysiology associated with NAFLD
- PMID: 26167414
- PMCID: PMC4496966
- DOI: 10.4161/21623945.2014.978662
The role of visceral and subcutaneous adipose tissue fatty acid composition in liver pathophysiology associated with NAFLD
Abstract
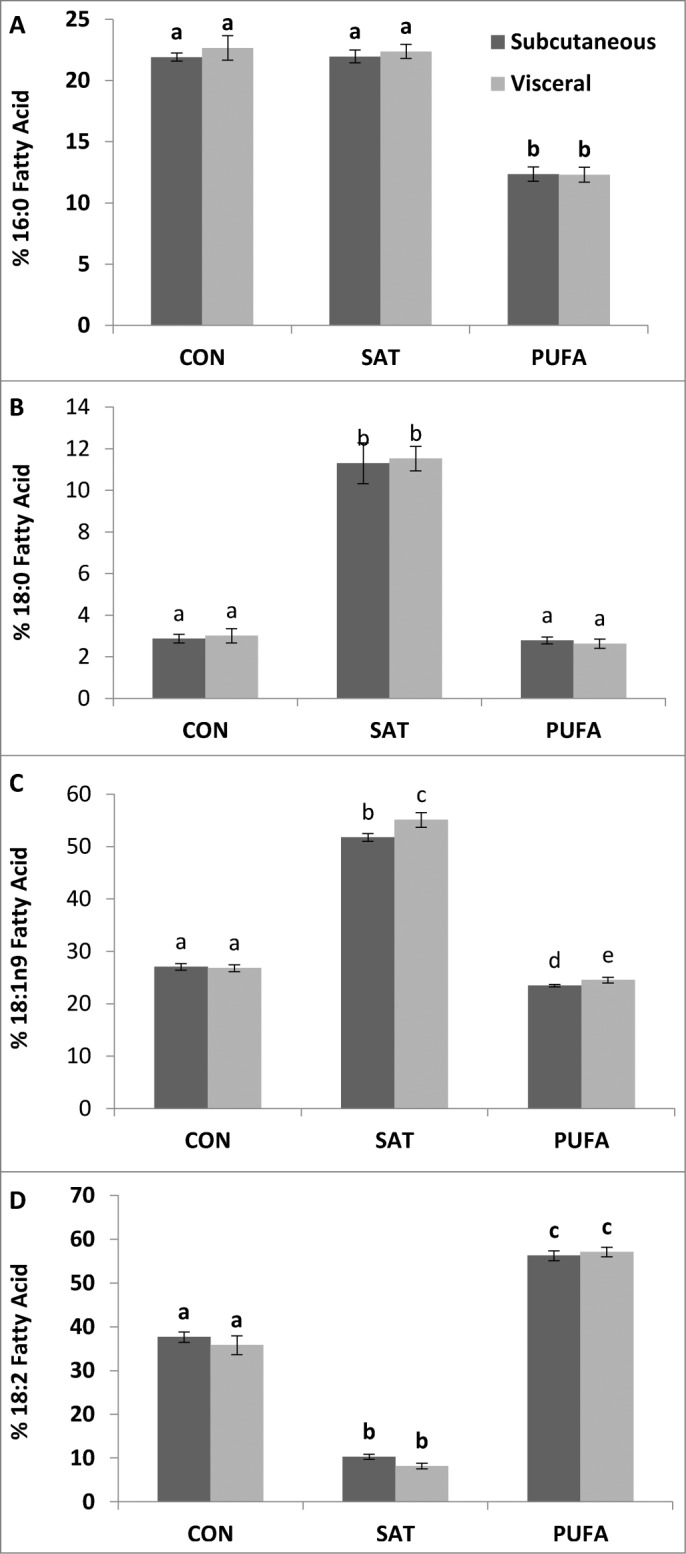
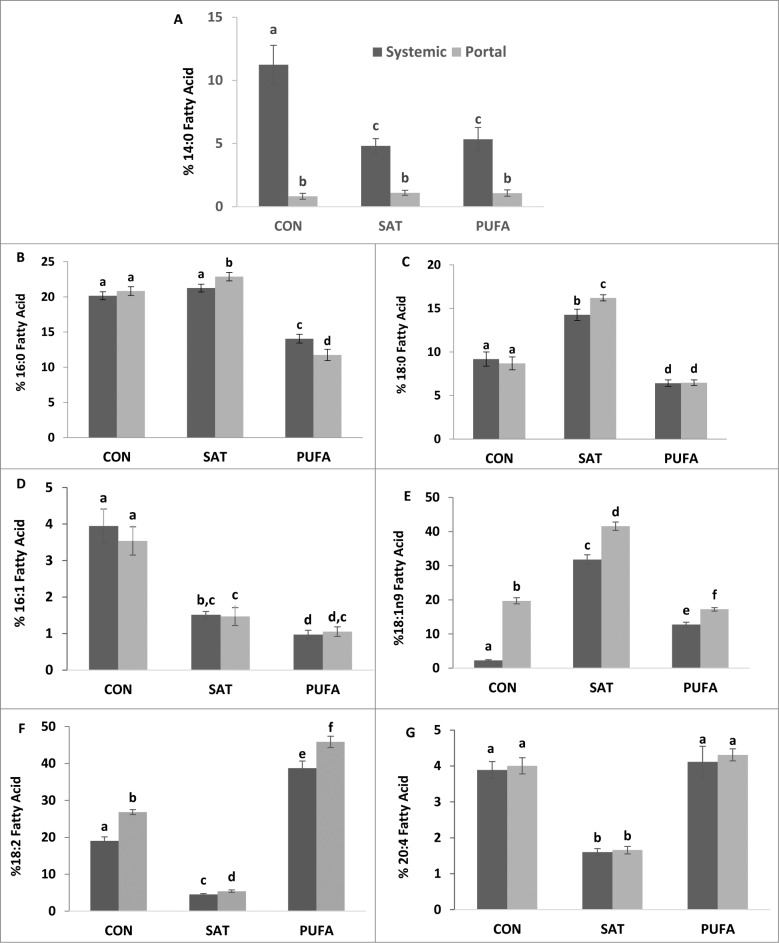
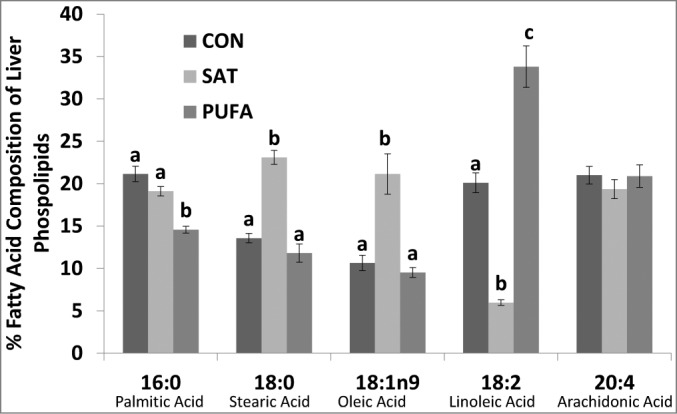
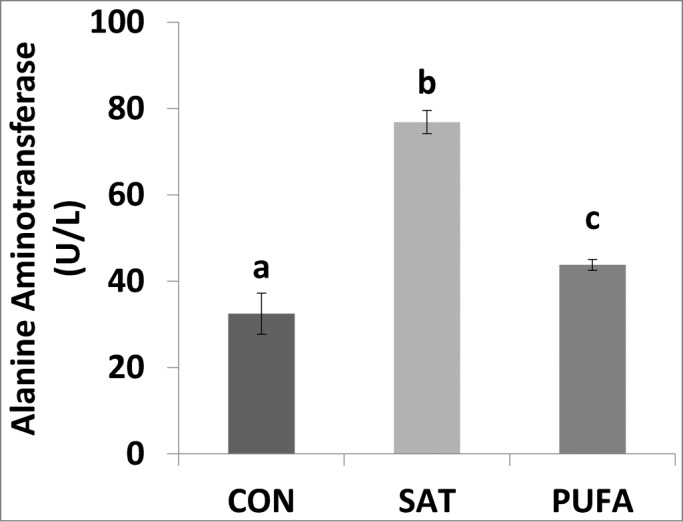
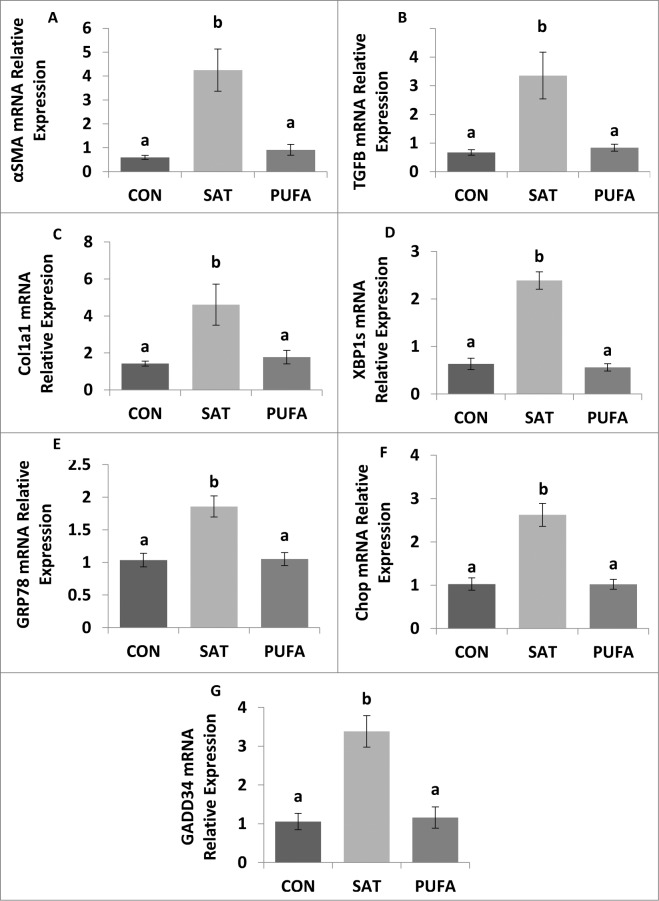
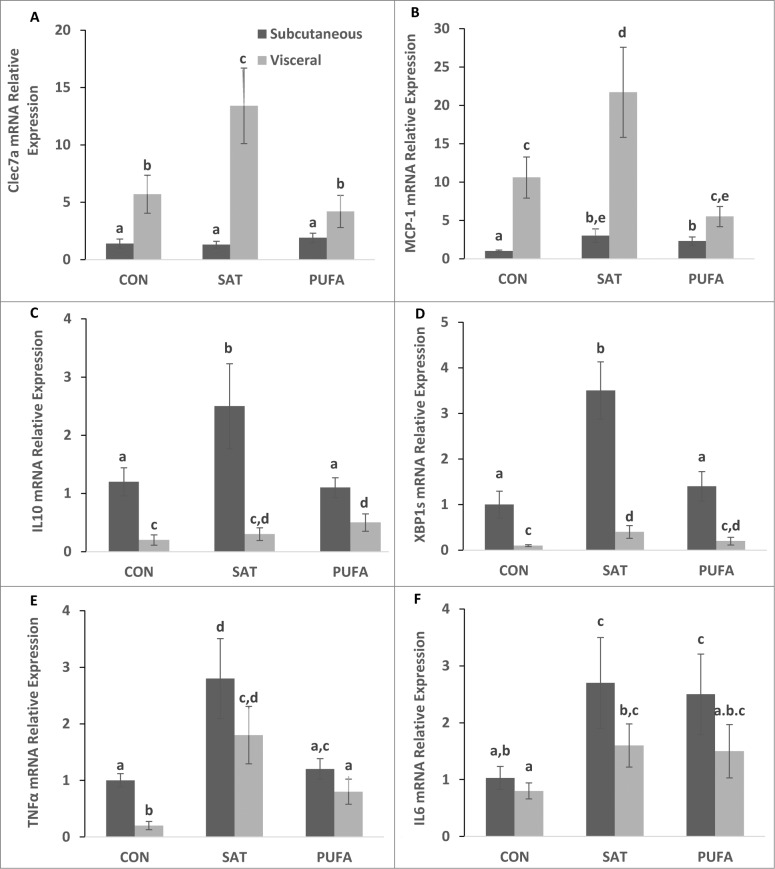
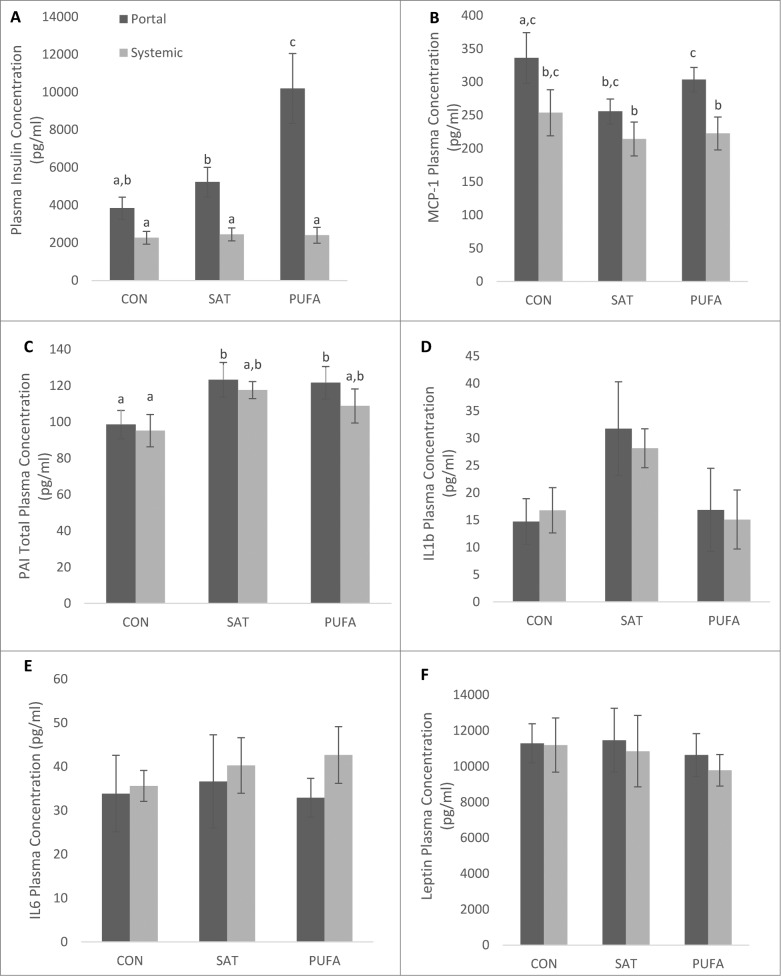
Visceral adiposity is associated with type-2-diabetes, inflammation, dyslipidemia and non-alcoholic fatty liver disease (NAFLD), whereas subcutaneous adiposity is not. We hypothesized that the link between visceral adiposity and liver pathophysiology involves inherent or diet-derived differences between visceral and subcutaneous adipose tissue to store and mobilize saturated fatty acids. The goal of the present study was to characterize the fatty acid composition of adipose tissue triglyceride and portal vein fatty acids in relation to indices of liver dysregulation. For 8 weeks rats had free access to control (CON; 12.9% corn/safflower oil; 3.6 Kcal/g), high saturated fat (SAT; 45.2% cocoa butter; 4.5 Kcal/g) or high polyunsaturated fat (PUFA; 45.2% safflower oil; 4.5 Kcal/g) diets. Outcome measures included glucose tolerance, visceral and subcutaneous adipose tissue triglyceride, liver phospholipids and plasma (portal and systemic) free fatty acid composition, indices of inflammation and endoplasmic reticulum stress in the liver and adipose tissue depots and circulating adipo/cytokines. Hepatic triglycerides were significantly increased in both high fat diet groups compared to control and were significantly higher in PUFA compared to SAT. Although glucose tolerance was not different among diet groups, SAT increased markers of inflammation and ER stress in the liver and both adipose tissue depots. Fatty acid composition did not differ among adipose depots or portal blood in any dietary group. Overall, these data suggest that diets enriched in saturated fatty acids are associated with liver inflammation, ER stress and injury, but that any link between visceral adipose tissue and these liver indices does not involve selective changes to fatty acid composition in this depot or the portal vein.
Keywords: adipose tissue distribution; dyslipidemia; fatty liver; metabolic syndrome; obesity; saturated fat.
Figures
References
-
- Sanada H, Yokokawa H, Yoneda M, Yatabe J, Sasaki Yatabe M, Williams SM, Felder RA, Jose PA. High body mass index is an important risk factor for the development of type 2 diabetes. Intern Med 2012; 51:1821-6; PMID:22821094; http://dx.doi.org/10.2169/internalmedicine.51.7410 - DOI - PMC - PubMed
-
- Brown CD, Higgins M, Donato KA, Rohde FC, Garrison R, Obarzanek E, Ernst ND, Horan M. Body mass index and the prevalence of hypertension and dyslipidemia. Obes Res 2000; 8:605-19; PMID:11225709; http://dx.doi.org/10.1038/oby.2000.79 - DOI - PubMed
-
- Lamon-Fava S, Wilson PW, Schaefer EJ. Impact of body mass index on coronary heart disease risk factors in men and women. The Framingham Offspring Study. Arterioscler Thromb Vasc Biol 1996; 16:1509-15; PMID:8977456; http://dx.doi.org/10.1161/01.ATV.16.12.1509 - DOI - PubMed
-
- Miyake T, Kumagi T, Hirooka M, Furukawa S, Koizumi M, Tokumoto Y, Ueda T, Yamamoto S, Abe M, Kitai K, et al. . Body mass index is the most useful predictive factor for the onset of nonalcoholic fatty liver disease: a community-based retrospective longitudinal cohort study. J Gastroenterol 2013; 48:413-22; PMID:22933183; http://dx.doi.org/10.1007/s00535-012-0650-8 - DOI - PubMed
-
- Anjana M, Sandeep S, Deepa R, Vimaleswaran KS, Farooq S, Mohan V. Visceral and central abdominal fat and anthropometry in relation to diabetes in Asian Indians. Diabetes Care 2004; 27:2948-53; PMID:15562212; http://dx.doi.org/10.2337/diacare.27.12.2948 - DOI - PubMed
Grants and funding
LinkOut - more resources
Full Text Sources
Other Literature Sources
Research Materials