. 2015 Sep;12(9):852-8.
doi: 10.1038/nmeth.3480. Epub 2015 Jul 13.

Photoactivatable genetically encoded calcium indicators for targeted neuronal imaging

Affiliations

Photoactivatable genetically encoded calcium indicators for targeted neuronal imaging

Shai Berlin et al. Nat Methods. 2015 Sep.

Abstract

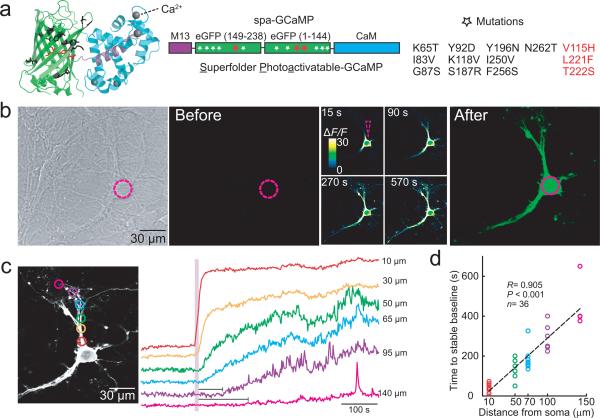
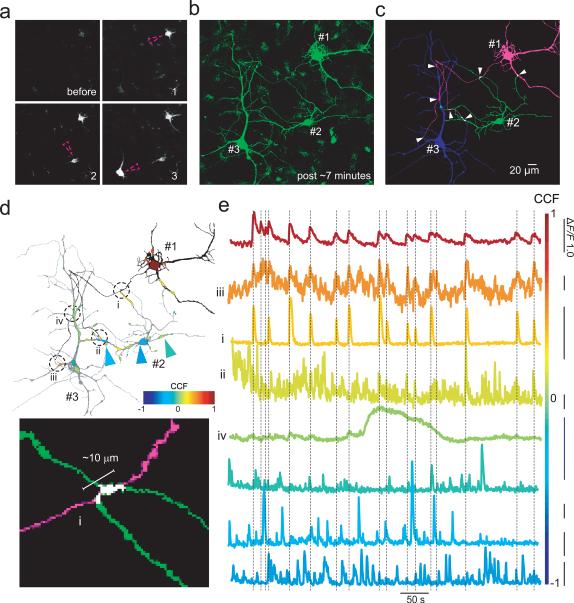
Circuit mapping requires knowledge of both structural and functional connectivity between cells. Although optical tools have been made to assess either the morphology and projections of neurons or their activity and functional connections, few probes integrate this information. We have generated a family of photoactivatable genetically encoded Ca(2+) indicators that combines attributes of high-contrast photolabeling with high-sensitivity Ca(2+) detection in a single-color protein sensor. We demonstrated in cultured neurons and in fruit fly and zebrafish larvae how single cells could be selected out of dense populations for visualization of morphology and high signal-to-noise measurements of activity, synaptic transmission and connectivity. Our design strategy is transferrable to other sensors based on circularly permutated GFP (cpGFP).


Figures

Figure 1
Figure 1. Structure and activity highlighted simultaneously by spa-GCaMP6f in cultured hippocampal neurons
a, Cartoon (left, PDB: 3SG4) and schematic of spa-GCaMP (middle), consisting of M13 (violet), a circularly permutated GFP (cpGFP, green) and calmodulin (CaM, cyan), indicating three necessary and sufficient mutations for photoactivation (red stars) and superfolding (white stars), denoted on the right. Note that all mutations are within the cpGFP, leaving the Ca2+ transduction domains intact. b, Representative transmitted-light (left) and 3D fluorescence projection micrographs showing densely cultured neurons expressing spa-GCaMP6f, before and after photoactivation by 405 nm illumination of the soma (dashed violet circle)(n>50). (middle) Single plane, time-lapse, color-coded fluorescence micrographs after photoactivation, normalized to the basal fluorescence at 0 s (see Online Methods). c, Dendritic highlighting following somatic photoactivation occurs rapidly in proximal, thick processes and more slowly, following a delay (horizontal bars below traces) in distal, thinner processes (distances are relative to center of soma.) d, Summary of distance-dependent filling, fitted with a linear regression (Pearson correlation, P<0.001, n = 36).
Figure 2
Figure 2. spa-GCaMP6s and spa-GCaMP6f report on action potentials and local calcium in dendritic spines of cultured hippocampal neurons
a-b, APs recorded in loose patch (bottom black traces) are reliably followed by fluorescence transients in spa-GCaMP6s (red) and spa-GcaMP6f (cyan) expressing cells. Number of action potentials per burst noted above fluorescence traces. c, Summary of ΔF/F of responses to different numbers of APs (n; spa-GCaMP6s (red)= 18, 8, 8, 5, 7, 12, spa-GCaMP6f (cyan)-9, 3, 4, 3, 4, 10; *, p<0.05, ± s.e.m., one way ANOVA). d-e, Calcium imaging in individual dendritic spine heads and shafts following photoactivation of spa-GCaMP6f. d, Highlighting of small compartments and individual spines following somatic photoactivation (as shown in Fig. 1). Prior to photoactivation (before), activity is undetectable, but becomes increasingly apparent once filling occurs (after violet bar). e, (top image and traces) A spine with a thin, long (2.5 μm) neck exhibits Ca2+ activity in the head (green arrowhead and corresponding trace) that is irregularly associated with Ca2+ activity in the shaft (magenta arrowhead and trace; black arrowheads atop traces denote concurrent activity in head and shaft compartments). (bottom image and traces) A stubby spine with a fat, short (0.4 μm) neck, exhibits a high correlation between Ca2+ activity in head and shaft. f, Inverse dependence of spine neck-length and the cross-correlation factor (CCF) of Ca2+ activity in head and shaft. Spines in (e) represented by magenta-green inverted triangle and square, respectively. (Pearson correlation, n = 10 cells, n = 35 spines, dashed red line, linear fit).
Figure 3
Figure 3. Functional highlighting of functionally connected cultured hippocampal neurons
a, Time lapse images of sequential somatic photoactivation (violet circle) of three closely situated sspa-GCaMP6f expressing neurons (1, 2 and 3) with ~2-5 minutes apart between photoactivation (n = 7). b, 3D projection image showing filling of the three neurons 7 min after photoactivation of cell #3. c, Sequential photoactivation enables neurons 1-3 to be traced with high fidelity, then color-coded to help identify crossing points between processes (white arrowheads) that could form potential synaptic contacts. d, (top) Black and white image (as shown in c) overlaid with a cross-correlation map (see Online Methods). Selected points of contact shown in c (arrowheads) are underscored by dashed circles and roman numerals. (bottom) A high power image of a potential contact between the long and thin axon-like process of neuron #1 (magenta) and a thick dendritic segment of neuron #2 (region “i”, green), spanning over 10 μm. e, Time resolved fluorescent traces of Ca2+ activity (color coded based on the correlation map shown in d as well as enumerated with roman numerals as shown in d) for the different points of contact (size of region on correlation map reflects the region of interest from which fluorescence was collected. Hot colors (yellow to red) indicate strong correlated activity with neuron #1 (top, dark red trace), whereas cold colors (light green to blue) indicate less of a correlation. Bottom three traces depict regions (arrowheads in d) outside the selected regions in neuron #2.
Figure 4
Figure 4. In vivo highlighting and imaging neural activity in Drosophila
a, Cartoon and transmitted-light micrograph of Drosophila larval nervous system, including the ventral nerve cord (VNC), with motor nerves extending to muscle and stimulation electrode. b, 3D projection images of VNC (outlined) from a transgenic larva expressing spa-GCaMP6f in motor neurons, before (left) and 5 minutes after (right) photoactivation (dashed pink region). Note the spread of fluorescence outside the region of photoactivation. c, Photoactivation of a large posterior region of the VNC enables imaging structure and activity of individual somata and neuropil. (right) Color-coded traces of time resolved fluorescence intensity following antidromic electrical stimulation (1 s at 20 Hz, every 20 s) yields large fluorescence transients from neuropil and individual somata, summarized in d (±s.e.m., n = 3 animals per group, t-test, P<0.05). Fluorescence baseline and transients are stable over 300 seconds of chronic imaging. e, Schematic of the in vivo experimental imaging set-up of adult Drosophila flies where female flies are mounted and head cuticle is opened to reveal the brain. A glass capillary filled with 2 M sucrose is placed next to the extended proboscis, from which sucrose is presented. f, Contrast images showing the subesophogeal zone (SEZ) region of a transgenic fly expressing spa-GCaMP6f in sweet taste cells (Gr5a-Gal4>UAS-spa-GCaMP6f) before (left, 0 s) and after (right, 150 s) 2P-photoactivation (red dashed area). g, (top trace) 2 M Sucrose, but not 100 mM denatonium (bottom trace), repeatedly elicits responses in nerve terminals following photoactivation. h, Summary of first responses to 2 M sucrose (n = 3 females flies, 5 SEZs).
Figure 5
Figure 5. In vivo highlighting and imaging neural and glial activity in larval zebrafish
a, 3D projection images of photoactivated sspa-GCaMP6f, transiently expressed in zebrafish (UAS-sspa-GCaMP6f injected into mnx-Gal4 embryo), in spinal cord motor neurons in 3 dpf larva before (left) and after (right) photoactivation of the soma (pink circle, which fills the axon and its bifurcations; inset-arrowheads) (n =7). b, Spontaneous activity recorded from the soma of another motor neuron following photoactivation. c, 2P photoactivation of retinal Müller glial cell (UAS-sspa-GCaMP6f injected into 1003-Gal4 embryo) highlighted the structure spanning the retinal layers in (GCL, gangion cell layer; IPL, inner plexiform layer; INL, Inner nuclear layer; ONL, outer nuclear layer) (n = 3). (left) 3D projection image of highlighted Müller cell ~10 minutes after 2P photoactivation. (right) Higher power image of the stalk of the cell showing three regions of interest (arrowheads). d, Compartmentalized Ca2+ activity from regions shown in c. e, 2P photoactivation in retinal ganglion cell axonal arbor in 5 dpf larva. Single plane fluorescent micrographs showing gradual filling of an axon arbor (1 - 20 min) that was repeatedly photoactivated at a single axon terminal (dashed red triangles) using 760 nm. i, 3D projection of highlighted arbor 30 minutes after initial photoactivation. ii, After 1 hr, the arbor has comparable brightness using same imaging settings. iii, After 4 hr, the arbor is half as bright, but still visible with increased imaging power (iv). f, Axon arbor remodeling is highlighted by diffusion of photoactivated molecules. Overlay (black) of arbors imaged at 30 minutes (green) and 4 hrs (magenta) post-photoactivation showed both pruning and growth of axonal branches.
Figure 6
Figure 6. Transferability of engineering strategy to other GECIs
a, Schematic of pa-G-GECO1.2* construction strategy with three mutations required for photoactivation (red stars) along a M84K mutation (yellow star; see Supplementary Notes and Figure 20). b, 3D projection fluorescence micrographs of hippocampal neurons expressing pa-G-GECO1.2* before (0 s) and after (300 s) somatic photoactivation (pink dashed regions). (Right) Contrast image showing the degree of photoactivation at 300 s. (inset) Magnified dendrite with highlighted dendritic spines (white arrowheads). c, Ca2+ activity recorded in soma of a hippocampal neuron expressing pa-G-GECO1.2*, following somatic photoactivation (n = 3). Images display pa-G-GECO1.2* fluorescence of a neuron at trough (left) and peak (right) of fluorescent transients, displayed in d. Note spread of activity throughout the cell.

References

    1. Cajal SR. Estructura de los centros nerviosos de las aves. Revista Trimestral de Histología Normal y Patológica. 1888;1:1–10.
    1. Chung K, Deisseroth K. CLARITY for mapping the nervous system. Nat. Methods. 2013;10:508–13. - PubMed
    1. Lichtman JW, Livet J, Sanes JR. A technicolour approach to the connectome. Nat. Rev. Neurosci. 2008;9:417–22. - PMC - PubMed
    1. Livet J, et al. Transgenic strategies for combinatorial expression of fluorescent proteins in the nervous system. Nature. 2007;450:56–62. - PubMed
    1. Wickersham IR, Finke S, Conzelmann KK, Callaway EM. Retrograde neuronal tracing with a deletion-mutant rabies virus. Nat. Methods. 2007;4:47–9. - PMC - PubMed

Publication types