. 2015 Aug;17(8):1074-1087.
doi: 10.1038/ncb3201. Epub 2015 Jul 13.

An siRNA-based functional genomics screen for the identification of regulators of ciliogenesis and ciliopathy genes

Gabrielle Wheway #  1 Miriam Schmidts #  2   3   4   5 Dorus A Mans #  3   4 Katarzyna Szymanska #  1 Thanh-Minh T Nguyen #  3   4 Hilary Racher  6 Ian G Phelps  7 Grischa Toedt  8 Julie Kennedy  9 Kirsten A Wunderlich  10 Nasrin Sorusch  10 Zakia A Abdelhamed  1 Subaashini Natarajan  1 Warren Herridge  1 Jeroen van Reeuwijk  3   4 Nicola Horn  11 Karsten Boldt  11 David A Parry  12 Stef J F Letteboer  3   4 Susanne Roosing  13 Matthew Adams  14 Sandra M Bell  14 Jacquelyn Bond  14 Julie Higgins  14 Ewan E Morrison  14 Darren C Tomlinson  14 Gisela G Slaats  15 Teunis J P van Dam  16 Lijia Huang  17 Kristin Kessler  18 Andreas Giessl  19 Clare V Logan  1 Evan A Boyle  20 Jay Shendure  20 Shamsa Anazi  21 Mohammed Aldahmesh  21 Selwa Al Hazzaa  22   23 Robert A Hegele  24 Carole Ober  25 Patrick Frosk  26 Aizeddin A Mhanni  26 Bernard N Chodirker  26 Albert E Chudley  26 Ryan Lamont  6 Francois P Bernier  6 Chandree L Beaulieu  17 Paul Gordon  6 Richard T Pon  6 Clem Donahue  27 A James Barkovich  28 Louis Wolf  29 Carmel Toomes  1 Christian T Thiel  18 Kym M Boycott  17 Martin McKibbin  30 Chris F Inglehearn  1 UK10K ConsortiumUniversity of Washington Center for Mendelian GenomicsFiona Stewart  31 Heymut Omran  32 Martijn A Huynen  16 Panagiotis I Sergouniotis  33   34 Fowzan S Alkuraya  21   35 Jillian S Parboosingh  6 A Micheil Innes  6 Colin E Willoughby  36 Rachel H Giles  15 Andrew R Webster  33   34 Marius Ueffing  11   37 Oliver Blacque  9 Joseph G Gleeson  13 Uwe Wolfrum  10 Philip L Beales  2 Toby Gibson  8 Dan Doherty  7   38 Hannah M Mitchison  2 Ronald Roepman  3   4 Colin A Johnson  1
Affiliations

An siRNA-based functional genomics screen for the identification of regulators of ciliogenesis and ciliopathy genes

Gabrielle Wheway et al. Nat Cell Biol. 2015 Aug.

Abstract

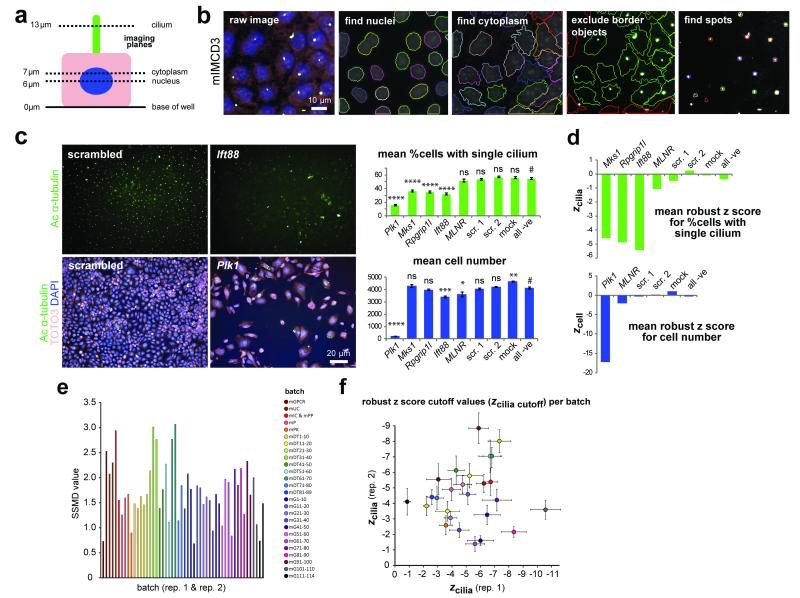
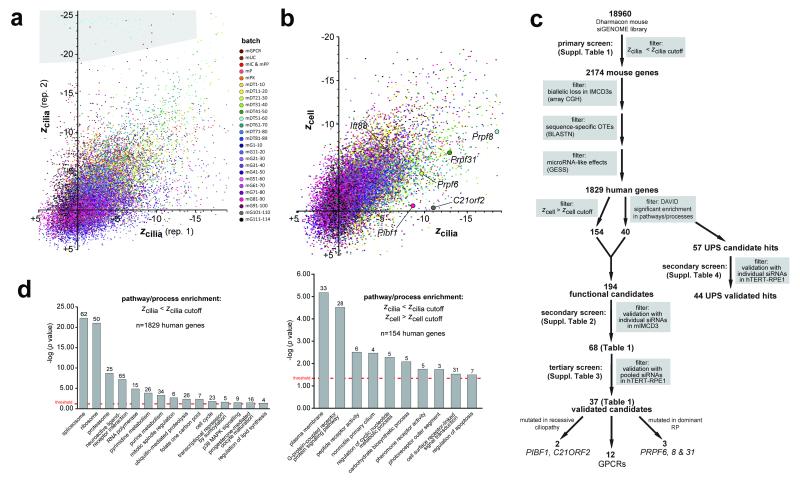
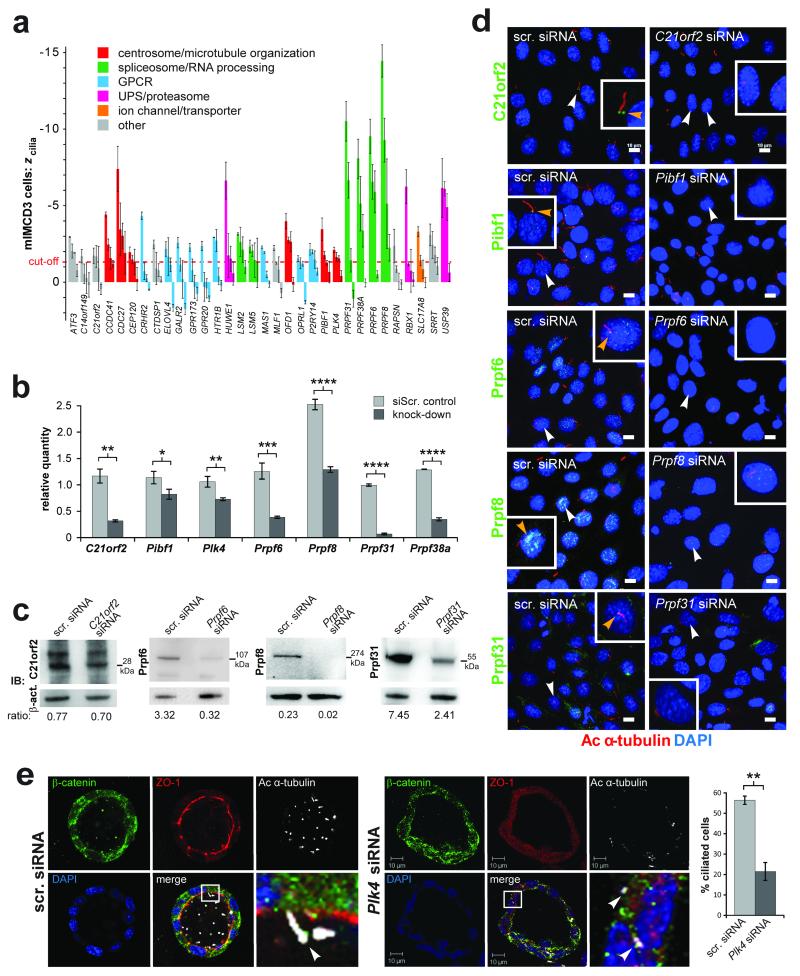
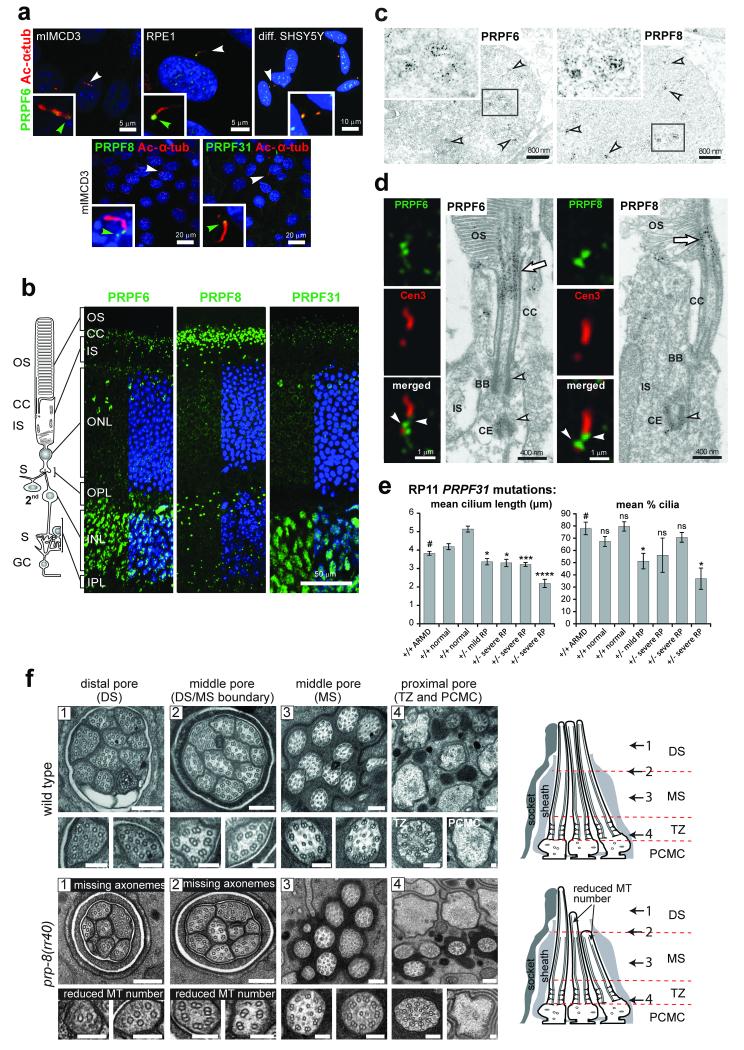
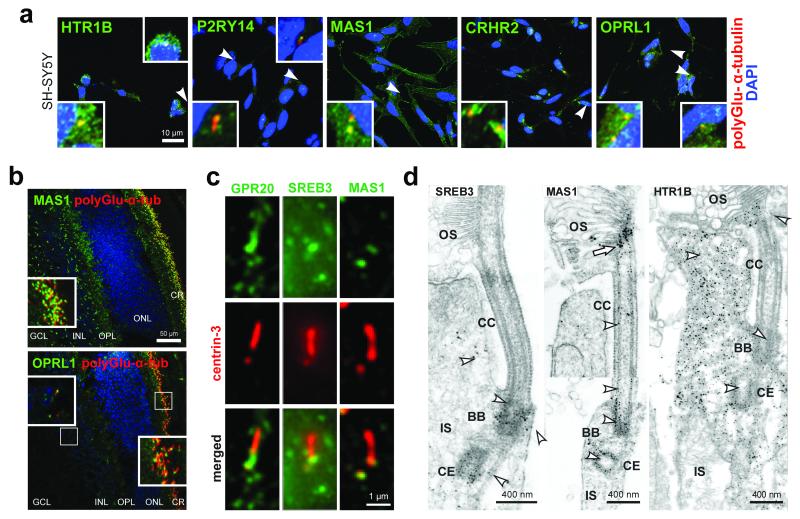
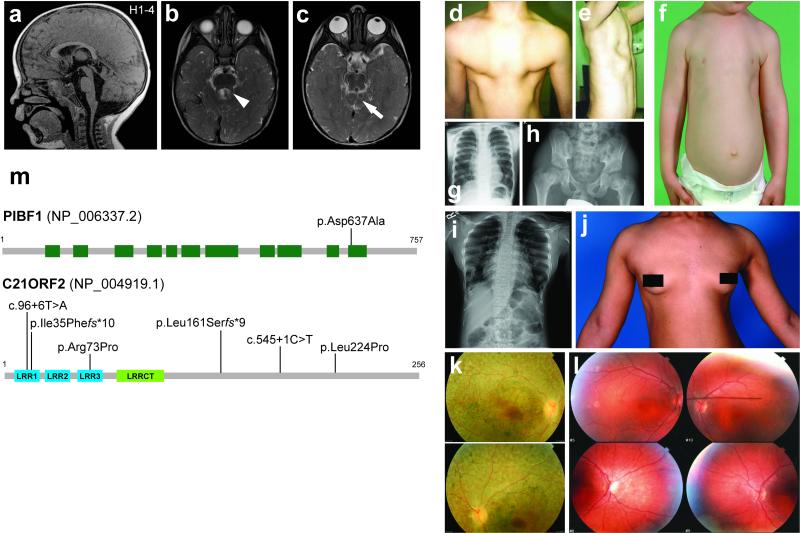
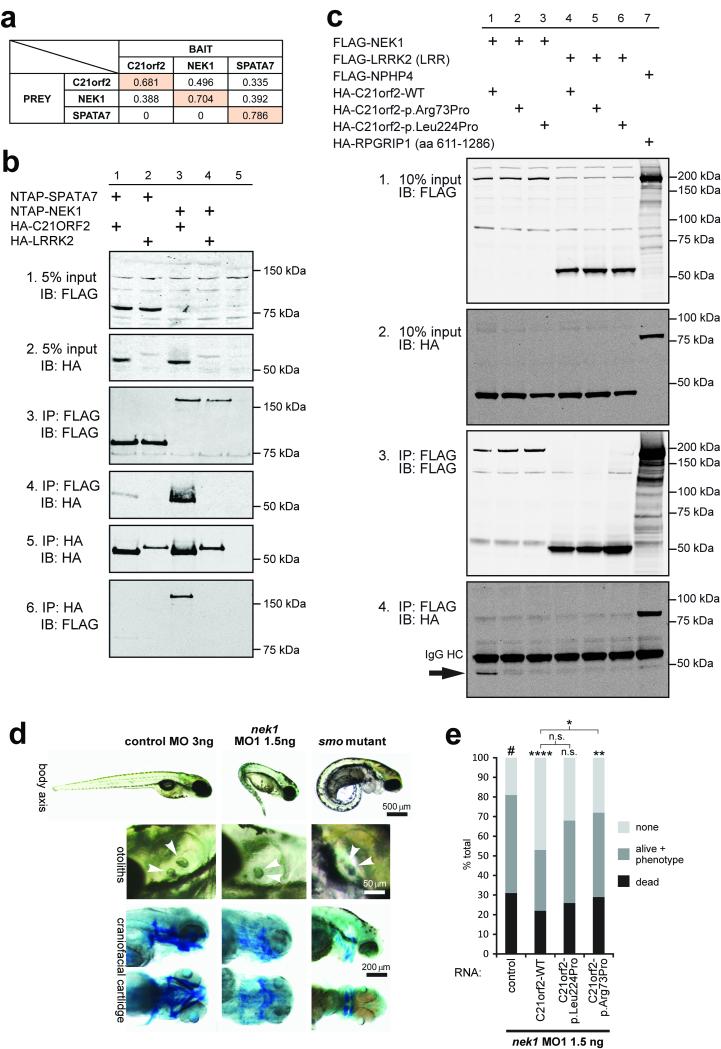
Defects in primary cilium biogenesis underlie the ciliopathies, a growing group of genetic disorders. We describe a whole-genome siRNA-based reverse genetics screen for defects in biogenesis and/or maintenance of the primary cilium, obtaining a global resource. We identify 112 candidate ciliogenesis and ciliopathy genes, including 44 components of the ubiquitin-proteasome system, 12 G-protein-coupled receptors, and 3 pre-mRNA processing factors (PRPF6, PRPF8 and PRPF31) mutated in autosomal dominant retinitis pigmentosa. The PRPFs localize to the connecting cilium, and PRPF8- and PRPF31-mutated cells have ciliary defects. Combining the screen with exome sequencing data identified recessive mutations in PIBF1, also known as CEP90, and C21orf2, also known as LRRC76, as causes of the ciliopathies Joubert and Jeune syndromes. Biochemical approaches place C21orf2 within key ciliopathy-associated protein modules, offering an explanation for the skeletal and retinal involvement observed in individuals with C21orf2 variants. Our global, unbiased approaches provide insights into ciliogenesis complexity and identify roles for unanticipated pathways in human genetic disease.


Figures

Figure 1
Figure 1. Automated high content imaging, validation of siRNA screen controls and calculation of cut-off values
(a) Schematic of a polarised mIMCD3 cell showing the focal planes used to image nuclei (blue), cytoplasm (pink) and ciliary axonemes (green). (b) mIMCD3 cells imaged using an Operetta high-content imaging system, with representative images from Harmony/Columbus software of cilia recognition (“find spots”). Scale bar = 10 μm. (c) Upper panels: significant effect on ciliogenesis following reverse transfection with positive control siRNA pool against Ift88 compared to non-targeting scrambled siRNA, imaged by immunostaining for acetylated (Ac) α-tubulin (green). Bar graph (green) quantitates the effect on ciliogenesis (% cells with a single cilium) for positive controls (Plk1, Mks1, Rpgrip1l, Ift88) and negative (−ve) controls including MLNR, scrambled (scr.) siRNAs and mock transfection. Lower panels: positive transfection control siRNA pool against Plk1 has a significant effect on cell number. Images show cells stained for acetylated α-tubulin (green), TOTO3 (pink) and DAPI (blue). Bar graph (blue) quantitates the effect on cell number following knock-down with control siRNAs. Scale bar = 20 μm. Significance of pairwise comparisons with all negative controls (#): ns, not significant; * p<0.05, ** p<0.01, *** p<0.001, **** p<0.0001 (paired two-tailed Student’s t-test), for n=32 independent replicates. (d) Bar graphs showing mean robust z score for % cells with a single cilium (zcilia) and mean robust z scores for cell number (zcell) for positive and negative siRNA controls. (e) Strictly standardised mean difference (SSMD) values for each replicate per batch in the screen. The average SSMD value for all batches was 1.717. Each bar is colour-coded by batch for sub-libraries in the ThermoFisher mouse siGENOME library (m, mouse; GPCR, G protein-coupled receptor; UC, ubiquitin conjugation; IC, ion channel; PP, protein phosphatase; P, protease; PK, protein kinase) or set of 10 plates (DT, druggable targets; G, genome libraries). (f) Robust z score cut-off values for cilia number (zcilia cutoff) calculated for each replicate per batch with error bars indicating median absolute deviation, where zcilia cutoff is the median z score for all positive controls. Dots are colour-coded by batch for sub-libraries as in (e).
Figure 2
Figure 2. Analysis and data filtering strategy for the whole genome siRNA screen
(a) Scatter plot of zcilia values of two screen replicates (rep. 1 and rep. 2). Each dot represents one targeted gene in the Thermo Fisher mouse siGENOME library, colour-coded by batch for either sub-library (m, mouse; GPCR, G protein-coupled receptor; UC, ubiquitin conjugation; IC, ion channel; PP, protein phosphatase; P, protease; PK, protein kinase) or set of 10 plates (DT, druggable targets; G, genome libraries). The median Pearson’s correlation coefficient (R2) between replicates was 0.71, if failed measurements in batch mDT51-60 were excluded (grey region). (b) Scatter plot of mean zcilia values plotted against robust z scores for cell number (zcell) for each targeted gene in the screen with each batch colour-coded as for (a); candidate hit genes are indicated. (c) Schematic to summarise data filtering steps in the primary, secondary and tertiary screens (complete datasets shown in Suppl. Tables 1-3, respectively). The number of genes filtered at each step are shown in bold, with the filter applied highlighted in grey boxes (see main text and On-line Methods for further details). Validated hits are listed in Table 1. (d) Classification enrichment for selected GO terms, or KEGG and BioCarta pathways/processes as determined using DAVID. Left bar graph: n=1829 screen hits with a significant effect on cilia number (zcilia< zcilia cutoff), without filtering for any effect on cell number, that had a human homologue. Right bar graph: 154 filtered screen hits with a human homologue that showed a significant effect on cilia number (zcilia< zcilia cutoff) but no significant effect on cell number (zcell> zcell cutoff), where zcell cutoff is the median z - 2MAD of all negative controls. The significance for terms or pathways was determined by a Benjamini-Hochberg q threshold value <0.05 (red dotted line) to correct for the false discovery rate, with the number of associated human genes shown above each bar.
Figure 3
Figure 3. Validation screens of ciliogenesis genes
(a) Robust z scores for % cells with a single cilium (zcilia) for selected validated genes from the secondary screen, each assayed in two replicates with four individual siRNAs in mouse mIMCD3 cells. Error bars indicate the range in values for the replicates. Cut-off value of zcilia cutoff = −1.34 is indicated (red dotted line), calculated as the median z of positive controls. Colours indicate selected functional annotations. (b) Bar graphs for quantitative PCR values for knock-down of the indicated target genes, for all assays when negative control (siScr.) cycle threshold (Ct) values<30. Transcript levels expressed as relative quantities, with the statistical significance of the indicted pair-wise comparisons: * p<0.05, ** p<0.01 and **** p<0.0001 (unpaired two-tailed Student’s t-test), for n=3 independent replicates. Error bars indicate s.d. (c) Western immunoblots (IB) showing knockdown of expression for the indicated proteins. Loading control is β-actin (act.), with the ratio of band intensities shown below. (d) IF confocal microscopy of mIMCD3 cells knocked-down with siRNAs for the indicated validated genes from the screen and immunostained for the cognate protein (green) and acetylated (Ac) α-tubulin (red). Magnified insets for selected cells (white arrowheads) are shown in white frames. All knockdowns cause loss of ciliary-associated protein (yellow arrowheads) and cilia. Scale bars = 10μm. (e) Knock-down of Plk4 in three-dimensional spheroid cultures of mIMCD3 cells causes statistically significant ciliogenesis defects (visualised by acetylated (Ac) α-tubulin in white); ** p<0.01 (paired two-tailed Student’s t-test), for n=3 independent experiments. The number of cells analysed were control: 204, 195 and 190; and Plk4 knockdown: 198, 106 and 212, respectively, for each experiment. Error bars indicate s.d. Scale bars = 10μm.
Figure 4
Figure 4. Ciliary localisation and functional effect on ciliary axonemal formation of pre-mRNA processing factors
(a) PRPF6, PRPF8 and PRPF31 (green) localise to proximal/basal regions of primary cilia (green arrowheads) and nuclear speckles in the indicated cell-lines. Selected cells (white arrowheads) are magnified (insets). (b) PRPF6, PRPF8 and PRPF31 (green) localise to the ciliary regions of photoreceptor cells (connecting cilium, CC) and nuclei of inner nuclear layer (INL) in longitudinal sections of adult murine retinas. Retinal layers are depicted schematically: photoreceptor outer segment (OS), connecting cilium (CC), and inner segment (IS); secondary neurons (2nd); ganglion cell layer (GC); synaptic region (S) in the outer and inner plexiform layer (OPL and IPL). (c) Immunoelectron microscopy confirms localisation of PRPF6 and PRPF8 in nuclear speckles in the INL (arrowheads). Frames indicate the magnified insets. (d) Immunofluorescence of PRPFs (green) and the ciliary marker centrin-3 (red), and immunoelectron microscopy, reveal localisation of PRPF6 and PRPF8 at the basal body (BB) and adjacent centriole (CE) of the CC (arrowheads) and apical CC (arrow). (e) Primary cilia length and number measurements for dermal fibroblasts from normal healthy controls, age-matched disease-control (ARMD), and four patients with RP type 11 of variable severity carrying heterozygous (+/−) PRPF31 frame-shift mutation c.1115_1125delGAAGCAGGCCA. Significance of pair-wise comparisons with the disease negative control (#): ns, not significant; * p<0.05, *** p<0.001, **** p<0.0001 (paired two-tailed Student’s t-test), for n=4 independent experiments. Error bars indicate s.d. (f) Transmission EM images of sensory cilia from sequential cross sections (numbered arrows in schematics) of C. elegans amphid pore in wild-type (N2) and prp-8(rr40) mutants. Wild-type amphid pores contain 10 ciliary axonemes, each consisting of a distal segment (DS; singlet A microtubules), middle segment (MS; doublet A/B microtubules), transition zone (TZ) and periciliary membrane compartment (PCMC). In prp-8(rr40) mutants, axonemes are missing in DS and DS/MS boundary, and microtubule (MT) number is reduced. Images are representative of four analysed amphid pores for each strain. Scale bars: (a) 20 μm and 5 μm; (b) 50 μm; (c) 800 nm; (d) 1 μm and 0.4 μm; (f) 200 nm (low magnification images), 100 nm (high magnification images).
Figure 5
Figure 5. Ciliary localisation of G protein-coupled receptors
(a) Localisation of selected indicated GPCRs (green) to proximal or basal regions of primary cilia (polyglutamylated α-tubulin; red) in differentiated SH-SY5Y neuronal cells. Magnified insets for selected cells (white arrowheads) are shown in white frames. Scale bar = 10μm. (b) Immunofluorescence (IF) labelling of MAS1 and OPRL1 (green) in the ciliary regions of photoreceptor cells (CR) (red; yellow arrowheads in magnified insets) in adult mouse retina. Abbreviations: GCL, ganglion cell layer; INL, inner nuclear layer; OPL, outer plexiform layer; ONL, outer nuclear layer. Scale bar = 50μm (c) High magnification immunofluorescence for GPCRs (green) and centrin-3 (red) reveals localisation of GPR20, SREB3, and MAS1 at the adjacent centriole and the basal body (arrowheads) of the connecting cilium. Scale bars = 1μm (d) IEM reveals SREB3, MAS1, and HTR1B at the basal body (BB) of the connecting cilium (CC) (arrowheads). Immunoelectron microscopy of MAS1 shows additional labelling throughout the CC and at the ciliary tip (arrow; two different images of photoreceptors are merged at the dashed line). Abbreviations: CE, centriole; IS, inner segment; OS, outer segment. Scale bars = 400nm.
Figure 6
Figure 6. Clinical features of ciliopathy patients with mutations in validated hits PIBF1 or C21orf2
(a-c) Brain MRI findings for PIBF1-related Joubert syndrome in individual H1-4. Molar tooth sign with moderate vermis hypoplasia, elevated and thickened superior cerebellar peduncles (arrowhead), and superior cerebellar dysplasia (arrow) indicated. (a) is a T1-weighted and (b-c) are T2-weighted images. (d-l) Clinical features of individuals with C21orf2 mutations including narrow and deformed thorax in UCL 78.1 (d-f; child), UCL-111.1 (g; child) and CR-F024.1 (i-j; adult). UCL78.1 presented with a slightly dysplastic pelvis (h) in later childhood. Examples of fundoscopy images revealing mild pigmentary depositions and some mottling shown for CR-F024.1 (k) and 111.2 (l); both patients were clinically blind at the time of examination. (m) Upper panel: schematic of the PIBF1 protein (NP_006337.2) showing the approximate positions of coiled coil domains (green boxes) and the p.Asp637Ala mutation. Lower panel: schematic of the C21orf2 protein (NP_004919.1) showing the positions of three leucine-rich repeats (LRR1-3, blue boxes), an LRRCT motif occurring C-terminal to LRRs (green box) and mutations.
Figure 7
Figure 7. Validated hit C21orf2 forms a ciliary functional module with NEK1 and SPATA7
(a) Interactions between C21orf2, NEK1 and SPATA7 were identified by tandem affinity purification. The values indicate sequence coverage of identified prey peptides (horizontal) co-purified with specific bait proteins (vertical); see Suppl. Table 8 for details. (b) Reciprocal coimmunoprecipitation of HA-C21orf2 and both NTAP-NEK1, and NTAP-SPATA7 (5% input: panels 1 and 2; immunoprecipitation (IP) assays in panels 3 to 6), but not the negative control HA-LRRK2 (LRR; panels 4 and 6: lanes 2 and 4) following immunoblot (IB) detection of either the HA or FLAG (Strep-tag II-FLAG, NTAP) epitopes. (c) FLAG-NEK1 coimmunoprecipitates wild-type (WT) C21orf2 (panel 4, lane 1; indicated by arrow), but not p.Arg73Pro or p.Leu224Pro mutant C21orf2 (panel 4, lanes 2 & 3) or the negative control HA-LRRK2 (LRR; lanes 4 to 6). Positive control co-IP (NPHP4-RPGRIP1L) is in lane 7, 10% input is shown in panels 1 and 2 and IP assays in panels 3 to 6. IgG heavy chain (HC) is indicated in panel 4. (d) Antisense morpholino oligonucleotide (MO1) injection against zebrafish nek1 resulted in ciliopathy phenotypes (ventrally curved body axis, hydrocephalus, smaller eyes and otolith defects at 3-4 dpf; upper and middle panels, otoliths indicated by arrowheads; scale bars = 500 or 50 μm, respectively). Lower panels: cartilage visualisation using Alcian Blue staining 4.5 dpf revealed impaired craniofacial cartilage development in nek1 morphants compared to control MO-injected embryos. These defects resembled, but were less severe, than those for zebrafish smo mutant embryos. Scale bar = 200 μm. (e) Co-injection of 1.5ng nek1 MO1 with 150pg human wild-type (WT) C21orf2 RNA (three independent experiments, total n=76 embryos) caused significant but incomplete phenotypic rescue, whereas RNA expressing the C21orf2 missense mutation p.Arg73Pro (C21orf2-p.Arg73Pro; three experiments, total n=72 embryos) rescued less effectively compared to negative control (#). Co-injection of 150pg C21orf2-p.Leu224Pro (three experiments, total n=91 embryos) had a marginal effect on rescue. Significance of pair-wise comparisons with the negative nek1 MO1-only control (#), or other comparisons indicated by braces, are: n.s., not significant; * p<0.05, ** p<0.01, **** p<0.0001 (unpaired two-tailed Student’s t-test).

References

    1. Goetz SC, Anderson KV. The primary cilium: a signalling centre during vertebrate development. Nat Rev Genet. 2010;11:331–44. - PMC - PubMed
    1. Adams M, Smith UM, Logan CV, Johnson CA. Recent advances in the molecular pathology, cell biology and genetics of ciliopathies. Journal of Medical Genetics. 2008;45:257–267. - PubMed
    1. Quinlan RJ, Tobin JL, Beales PL. Modeling ciliopathies: Primary cilia in development and disease. Curr Top Dev Biol. 2008;84:249–310. - PubMed
    1. Kim J, et al. Functional genomic screen for modulators of ciliogenesis and cilium length. Nature. 2010;464:1048–51. - PMC - PubMed
    1. Lai CK, et al. Functional characterization of putative cilia genes by high-content analysis. Mol Biol Cell. 2011;22:1104–19. - PMC - PubMed

Publication types

MeSH terms

Supplementary concepts