. 2015 Aug;18(8):1116-22.
doi: 10.1038/nn.4061. Epub 2015 Jul 13.

Learning enhances the relative impact of top-down processing in the visual cortex

Affiliations

Learning enhances the relative impact of top-down processing in the visual cortex

Hiroshi Makino et al. Nat Neurosci. 2015 Aug.

Abstract

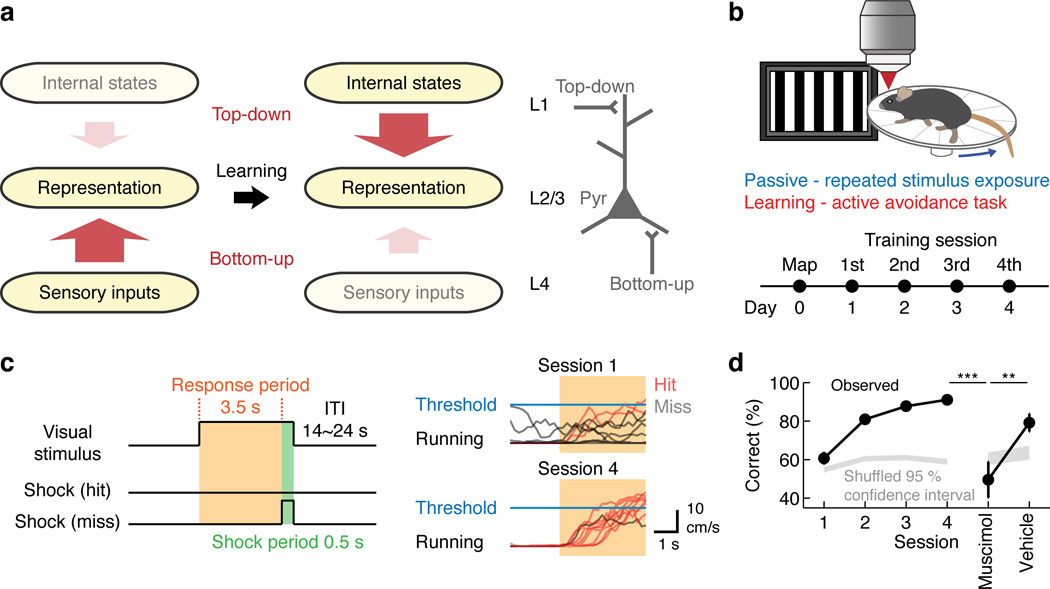
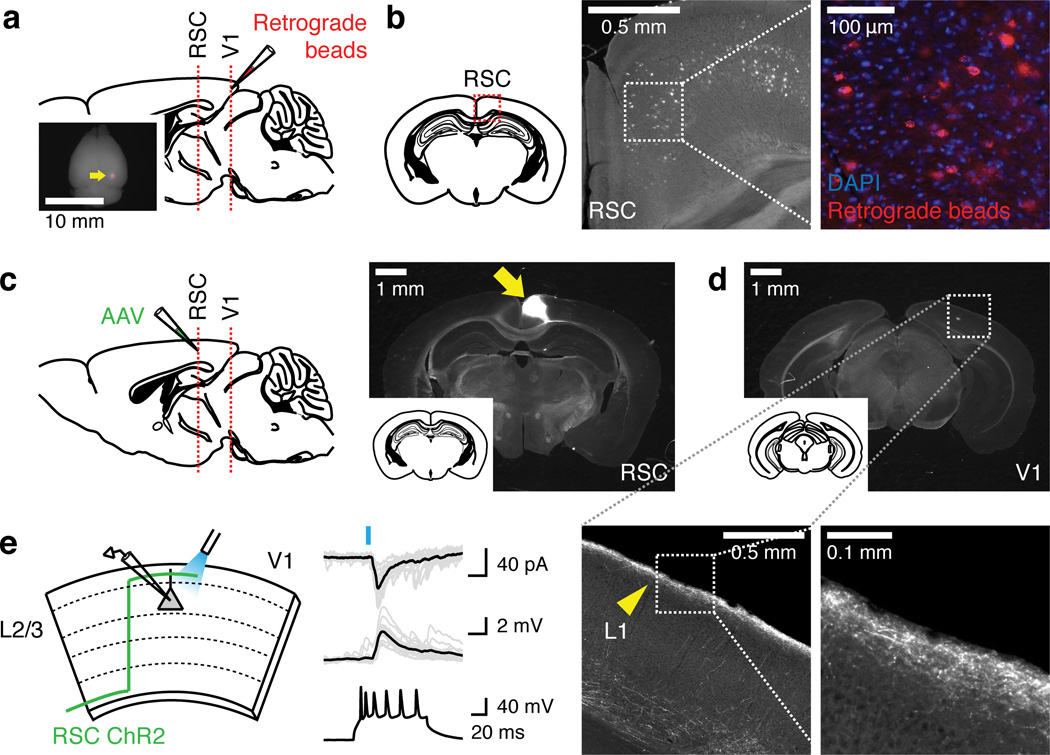
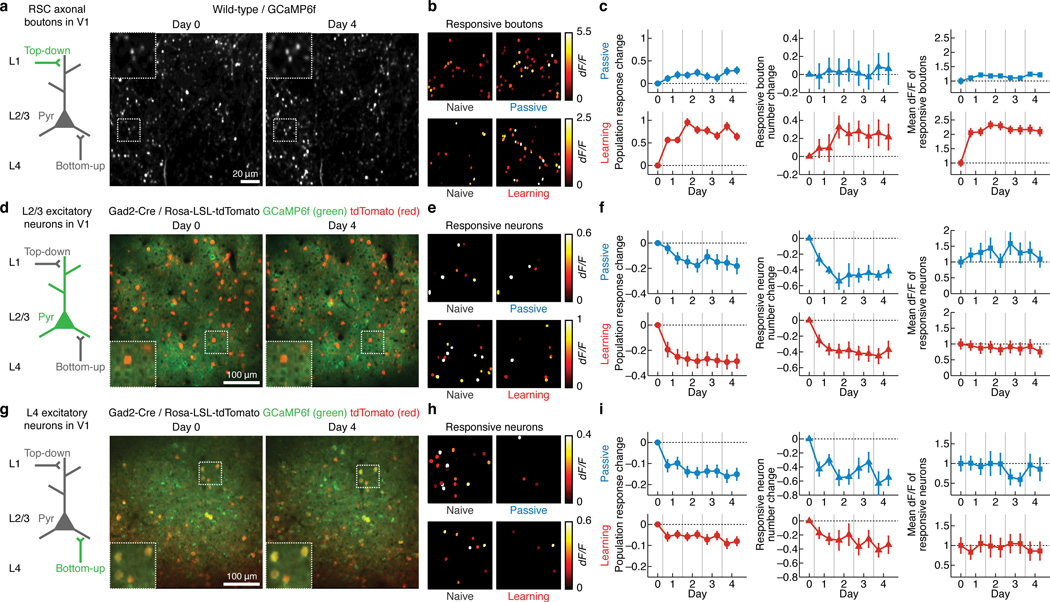
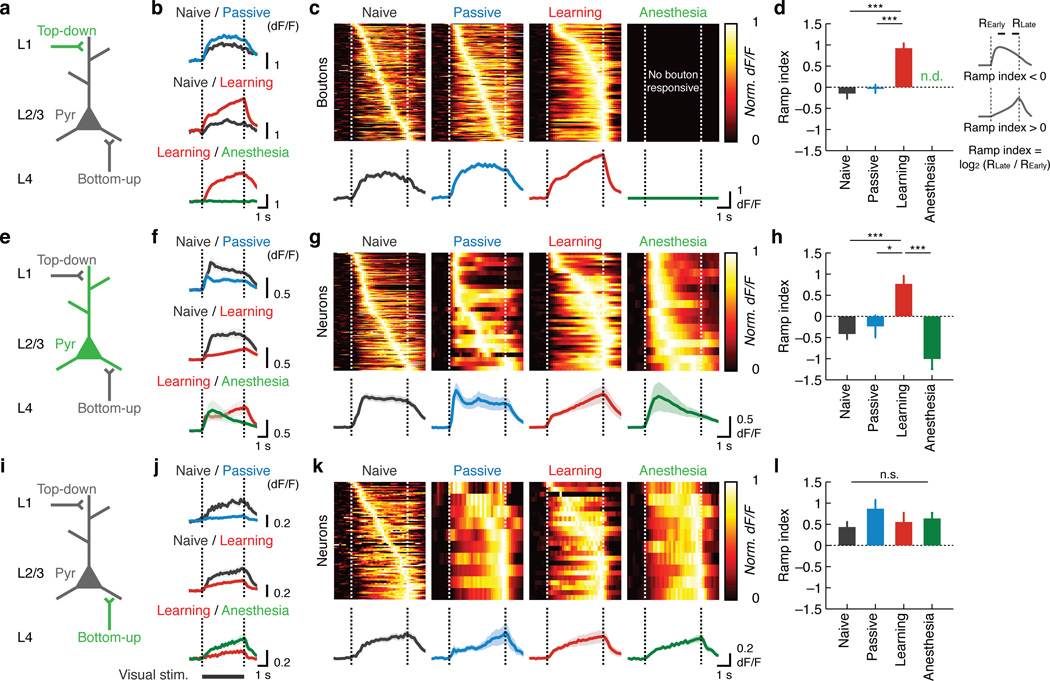
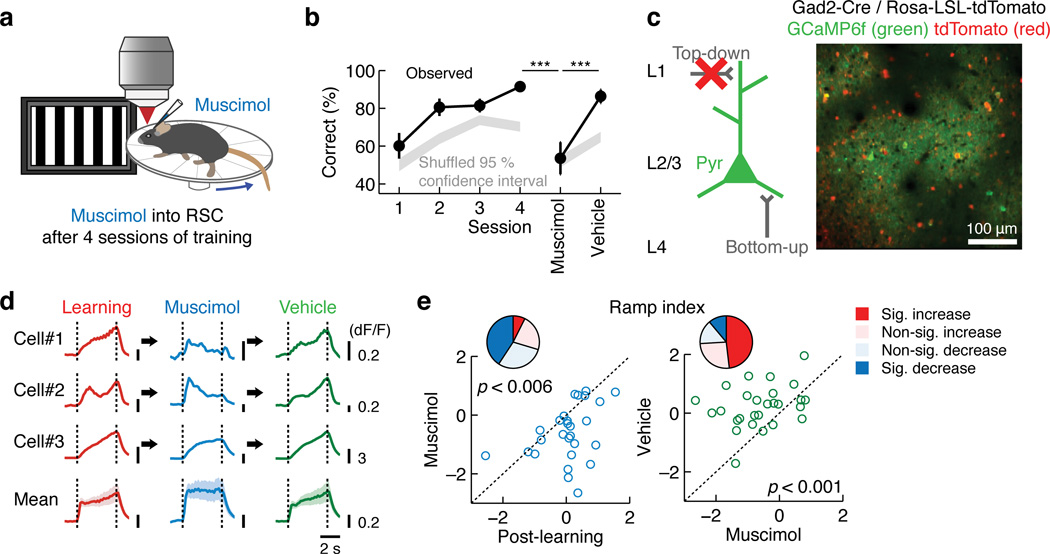
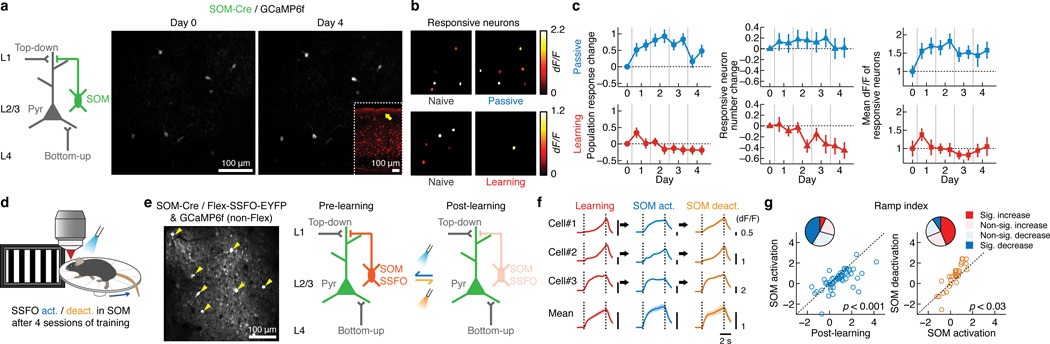
Theories have proposed that, in sensory cortices, learning can enhance top-down modulation by higher brain areas while reducing bottom-up sensory drives. To address circuit mechanisms underlying this process, we examined the activity of layer 2/3 (L2/3) excitatory neurons in the mouse primary visual cortex (V1) as well as L4 excitatory neurons, the main bottom-up source, and long-range top-down projections from the retrosplenial cortex (RSC) during associative learning over days using chronic two-photon calcium imaging. During learning, L4 responses gradually weakened, whereas RSC inputs became stronger. Furthermore, L2/3 acquired a ramp-up response temporal profile, potentially encoding the timing of the associated event, which coincided with a similar change in RSC inputs. Learning also reduced the activity of somatostatin-expressing inhibitory neurons (SOM-INs) in V1 that could potentially gate top-down inputs. Finally, RSC inactivation or SOM-IN activation was sufficient to partially reverse the learning-induced changes in L2/3. Together, these results reveal a learning-dependent dynamic shift in the balance between bottom-up and top-down information streams and uncover a role of SOM-INs in controlling this process.


Figures

Figure 1
Figure 1
Hypothesis and behavioral paradigm. (a) Hypothesis. Bottom-up inputs dominate in the naive condition, and learning induces a top-down dominant state. This study focused on V1 L2/3 as a potential site subject to such changes. (b) Top: schematic of the behavioral setup. Bottom: timeline of the experiment. (c) Left: structure of the visually-guided active avoidance task. During the first 3.5 s of the visual stimulus (‘response period’), the mouse has to initiate running in order to avoid a tail shock. Right: example running traces of a mouse in session 1 and session 4 (10 example trials in each session). (d) Behavioral performance improves with training (p < 0.001, Kruskal-Wallis test, n = 47 mice). Muscimol injections in V1 after learning impair the performance (***p < 0.001, **p = 0.0016, one-tailed bootstrap with Bonferroni correction, n = 7 mice).
Figure 2
Figure 2
Retrosplenial cortex (RSC) provides monosynaptic excitatory inputs to V1 L2/3 excitatory neurons. (a) Retrograde tracing. Retrograde beads were injected into V1 to identify potential brain regions providing top-down inputs (n = 4 mice). Inset: injection site indicated by the arrow. (b) Left: schematic illustrating the location of RSC. Middle: RSC containing dense labeling of the beads. Right: zoom of the outlined area. Other brain areas labeled with the retrograde beads include anterior cingulate cortex, secondary motor cortex, secondary visual cortex, lateral geniculate nucleus and auditory cortex. RSC was one of the most densely labeled areas. (c) Anterograde tracing. AAV expressing ChR2 or GCaMP6f was injected into RSC. Arrow, injection site at RSC. (d) GCaMP6f-expressing axons of RSC neurons innervate predominantly in L1 of V1. Bottom left panel: zoom of the outlined area in V1. Bottom right panel: zoom of the outlined area in the left panel. Arrowhead, RSC axons arriving in L1 of V1. (e) Photoactivation of RSC axons and whole-cell recordings in acute V1 slices reveal monosynaptic excitatory input from RSC to V1 L2/3 excitatory neurons. Traces are light-evoked EPSCs (top), EPSPs (middle) and the regular spiking pattern with current injection confirming that they are excitatory neurons (bottom). Twelve out of 13 neurons showed such post-synaptic responses.
Figure 3
Figure 3
Asymmetrical changes in responses of RSC axons, L2/3 excitatory neurons and L4 excitatory neurons in V1 during passive experience and associative learning. (a) Left: circuit schematic with the imaged component (RSC axonal boutons) shown in green. Right: same population of RSC axonal boutons expressing GCaMP6f imaged 4 days apart. Insets are zoom of outlined areas. (b) Spatial map of responsive RSC axonal boutons within an image field from a mouse before (left) and after passive experience or learning (right), pseudocolor-coded according to the activity levels. (c) Left: population response change of RSC axonal boutons over days in passive and learning groups. The value at each time point (t) is Rt − R0 where R0 and Rt are the population response at Day 0 and time point t, respectively (defined as the mean dF/F during the stimulus period averaged across trials, and then averaged across all ROIs that are responsive in at least one time point). Each training session (Day 1–4) was split into two blocks. Passive: p < 0.001, n = 365 boutons, 6 mice; learning: p < 0.001, n = 227 boutons, 5 mice, one-way repeated measures ANOVA. Middle: changes in the number of responsive RSC axonal boutons at each time point normalized to the value on Day 0 in passive and learning groups. Passive: p = 0.98, 6 mice; learning: p = 0.09, 6 mice, one-way repeated measures ANOVA. Right: dF/F of the RSC axonal boutons that are responsive at each time point in passive and learning groups, normalized to the mean value on Day 0. Passive: p = 0.0051, 6 mice; learning: p < 0.001, 5 mice, Kruskal-Wallis test. (d–f) Same as a–c for L2/3 excitatory neurons. tdTomato in d and g marks inhibitory neurons. Left in f: passive: p < 0.001, n = 88 neurons, 5 mice; learning: p < 0.001, n = 163 neurons, 7 mice. Middle in f: passive: p < 0.001, 5 mice; learning: p < 0.001, 7 mice. Right in f: passive: p = 0.22, 5 mice; learning: p = 0.57, 7 mice. (g–i) Same as a–c for L4 excitatory neurons. Left in i: passive: p < 0.001, n = 50 neurons, 5 mice; learning: p < 0.001, n = 81 neurons, 5 mice. Middle in i: passive: p < 0.001, 5 mice; learning: p = 0.03, 5 mice. Right in i: passive: p = 0.31, 5 mice; learning: p = 0.50, 5 mice. For these and all other analyses, shocked trials (misses) are excluded unless stated otherwise.
Figure 4
Figure 4
Temporal patterns of responses of the three excitatory components. (a) Circuit schematic with the imaged component (RSC axonal boutons) shown in green. (b) Trial-average dF/F of responsive RSC axonal boutons. Here boutons that are responsive in either of the two conditions are included and thus each comparison contains the same set of boutons. Naive / passive: n = 236 boutons, 6 mice; naive / learning: n = 142 boutons, 5 mice; learning / post-learning anesthesia, n = 139 boutons, 3 mice. (c) Top: heat maps of normalized trial-average dF/F of individual boutons responsive within each time point sorted in the order of peak timing for naive, passive and learning conditions. Bottom: mean dF/F of the boutons responsive within each time point. Note the emergence of ramp-up responses in RSC inputs and L2/3 excitatory neurons in g after learning. Note also that, while plots in b, f and j include the same set of ROIs for the comparisons and thus directly reflect the magnitude of population activity, the plots in c, g and k have a varying number of responsive ROIs in each condition and thus focus on the temporal response patterns without faithfully representing the size of population activity. See Fig. 2 for the changes in the number of responsive ROIs. (d) Mean ramp index under each condition for RSC axonal boutons, p < 0.001, naive: n = 155 boutons, 11 mice; passive: 152 boutons, 6 mice; learning: 121 boutons, 6 mice; post-learning anesthesia: 3 mice, ***p < 0.001, one-way ANOVA with post-hoc Tukey test. There were no responsive RSC axonal boutons under post-learning anesthesia. (e–h) Same as a–d for L2/3 excitatory neurons. Naive / passive: n = 71 neurons, 5 mice; naive / learning: n = 131 neurons, 7 mice; learning / post-learning anesthesia: n = 19 neurons, 3 mice in f. P < 0.001, naive: n = 146 neurons, 13 mice; passive: 21 neurons, 5 mice; learning: 45 neurons, 7 mice; post-learning anesthesia: 15 neurons, 3 mice, ***p < 0.001, *p = 0.038 in h. All other comparisons in d, h and l were statistically non-significant (p > 0.05). (i–l) Same as a–d for L4 excitatory neurons. Naive / passive: n = 43 neurons, 5 mice; naive / learning: n = 55 neurons, 5 mice; learning / post-learning anesthesia, n = 13 neurons, 3 mice in j. P = 0.63, naive: n = 72 neurons, 10 mice; passive: 9 neurons, 5 mice; learning: 23 neurons, 5 mice; post-learning anesthesia: 10 neurons, 3 mice in l.
Figure 5
Figure 5
Necessity of RSC for the learned active avoidance behavior and post-learning activity in L2/3 excitatory neurons. (a) Schematic of the experiment. (b) RSC inactivation impairs the task performance (***p < 0.001, one-tailed bootstrap with Bonferroni correction, n = 9 mice). (c) Monitoring post-learning responses of L2/3 excitatory neurons with RSC inactivation. (d) Responses of three example neurons and mean of all responsive neurons, showing that RSC inactivation leads to more onset-locked responses. For the population mean, all neurons that are responsive in at least one of the three conditions are included. (e) Left: ramp index of individual neurons decreased by RSC inactivation after learning (p = 0.005, Wilcoxon signed-rank test with Bonferroni correction, n = 27 neurons, 7 mice). Right: ramp index was higher with vehicle injections compared to muscimol injections (p < 0.001, n = 27 neurons, 7 mice). The pie charts illustrate the fractions of neurons showing a significant increase or decrease in the ramp index (Wilcoxon signed-rank test, p < 0.05).
Figure 6
Figure 6
Learning-induced reduction in SOM-IN activity and partial restoration of the naive-like activity in L2/3 by post-learning reactivation of SOM-INs. (a) Left: circuit schematic of SOM-IN. Right: same population of SOM-INs expressing GCaMP6f imaged 4 days apart. (b) Spatial map of responsive SOM-INs within an image field from a mouse before (left) and after passive experience or learning (right), pseudocolor-coded according to the activity levels. (c) As in Fig. 2. Left: population response change. Passive: p < 0.001, n = 42 neurons, 6 mice; learning: p < 0.001, n = 40 neurons, 7 mice, one-way repeated measures ANOVA. Middle: responsive neuron number change. Passive: p = 0.41, n = 7 mice; learning: p < 0.001, n = 7 mice, one-way repeated measures ANOVA. Right: mean dF/F of responsive neurons. Passive: p = 0.09, n = 7 mice; learning: p = 0.24, n = 7 mice, Kruskal-Wallis test. (d) Schematic of the SOM-IN reactivation experiment. (e) Left: L2/3 SOM-INs expressing SSFO-EYFP (arrowheads) and putative excitatory neurons expressing GCaMP6f imaged in vivo. Right: rationale of the experiment. (f) Responses of three example L2/3 putative excitatory neurons and mean of all responsive neurons, showing that SOM-IN activation leads to more onset-locked responses. For the population mean, all neurons that are responsive in at least one of the three conditions are included. (g) Left: ramp index of individual putative excitatory neurons decreased with SOM-IN activation (p < 0.001, Wilcoxon signed-rank test with Bonferroni correction, n = 58 neurons, 6 mice). Right: reversal in the ramp index of individual neurons by SOM-IN deactivation (p = 0.024, n = 32 neurons, 4 mice). The pie chart illustrates the fractions of neurons showing a significant increase or decrease in the ramp index.

References

    1. Desimone R, Duncan J. Neural mechanisms of selective visual attention. Annu Rev Neurosci. 1995;18:193–222. - PubMed
    1. Hupe JM, et al. Cortical feedback improves discrimination between figure and background by V1, V2 and V3 neurons. Nature. 1998;394:784–787. - PubMed
    1. Engel AK, Fries P, Singer W. Dynamic predictions: oscillations and synchrony in top-down processing. Nat Rev Neurosci. 2001;2:704–716. - PubMed
    1. Krupa DJ, Wiest MC, Shuler MG, Laubach M, Nicolelis MA. Layer-specific somatosensory cortical activation during active tactile discrimination. Science. 2004;304:1989–1992. - PubMed
    1. Nienborg H, Cumming BG. Decision-related activity in sensory neurons reflects more than a neuron's causal effect. Nature. 2009;459:89–92. - PMC - PubMed

Publication types