. 2015 Aug;18(8):1133-42.
doi: 10.1038/nn.4062. Epub 2015 Jul 13.

Conjunctive input processing drives feature selectivity in hippocampal CA1 neurons

Affiliations

Conjunctive input processing drives feature selectivity in hippocampal CA1 neurons

Katie C Bittner et al. Nat Neurosci. 2015 Aug.

Abstract

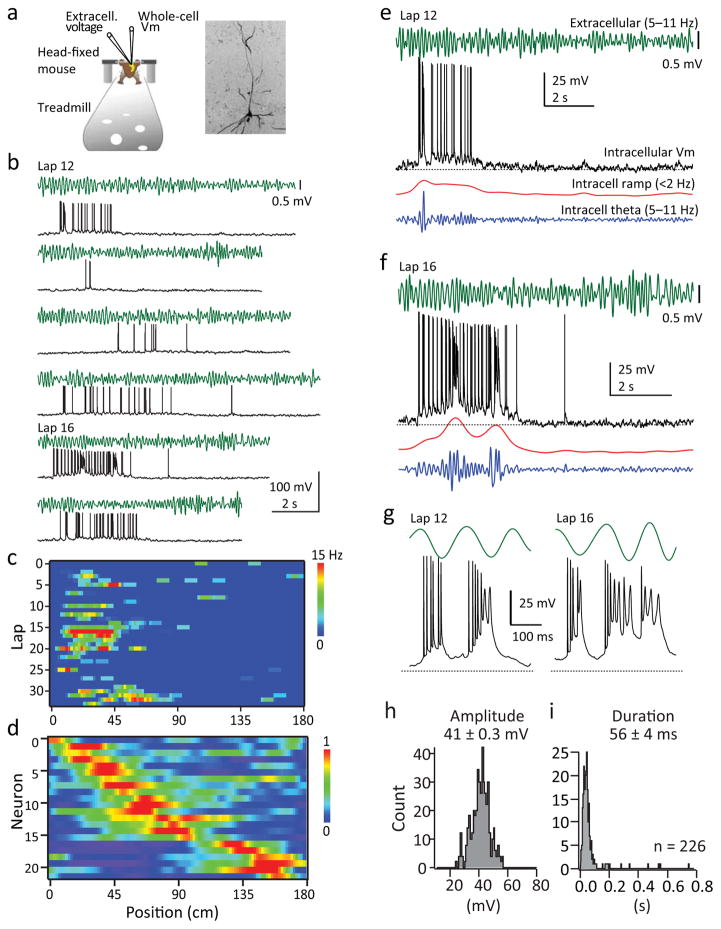
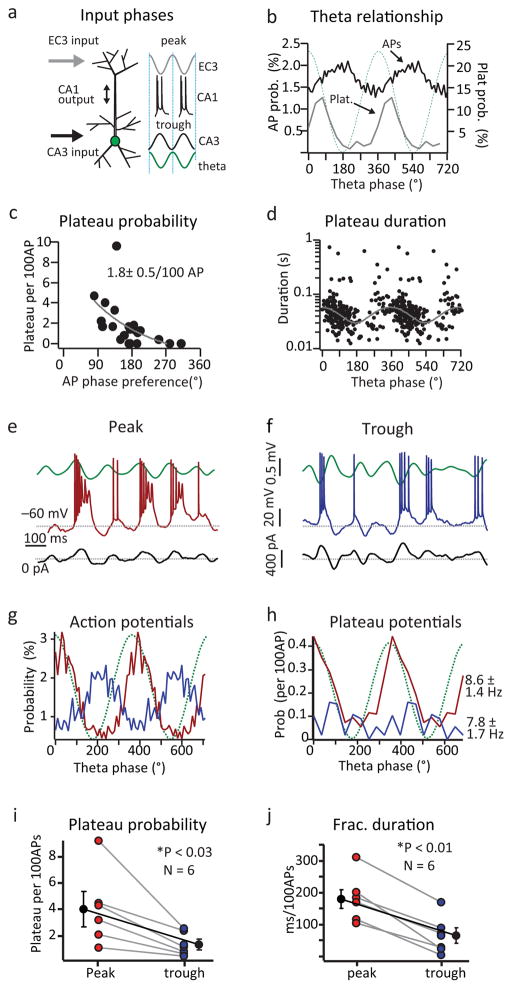
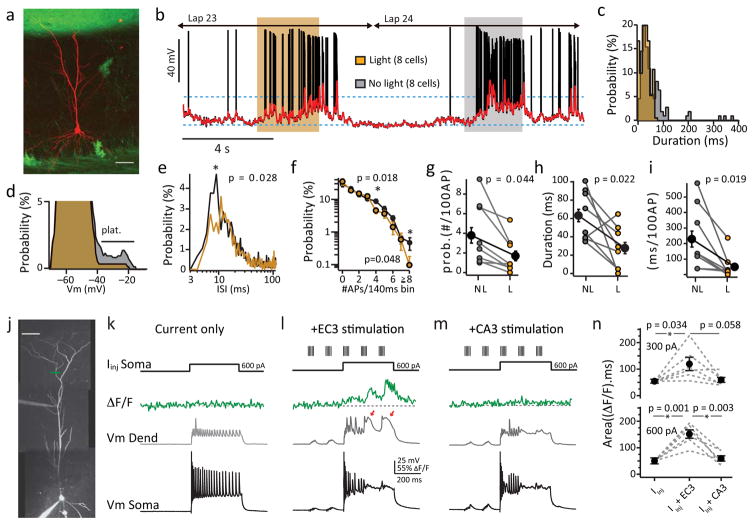
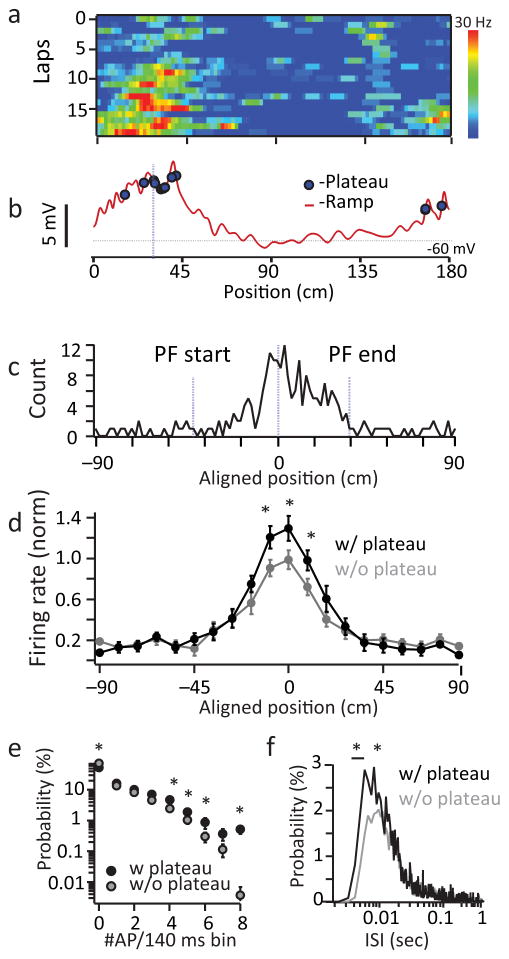
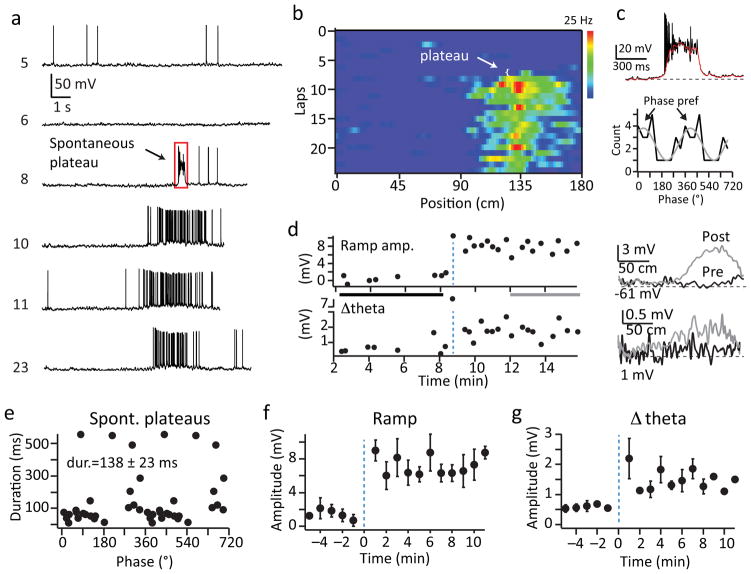
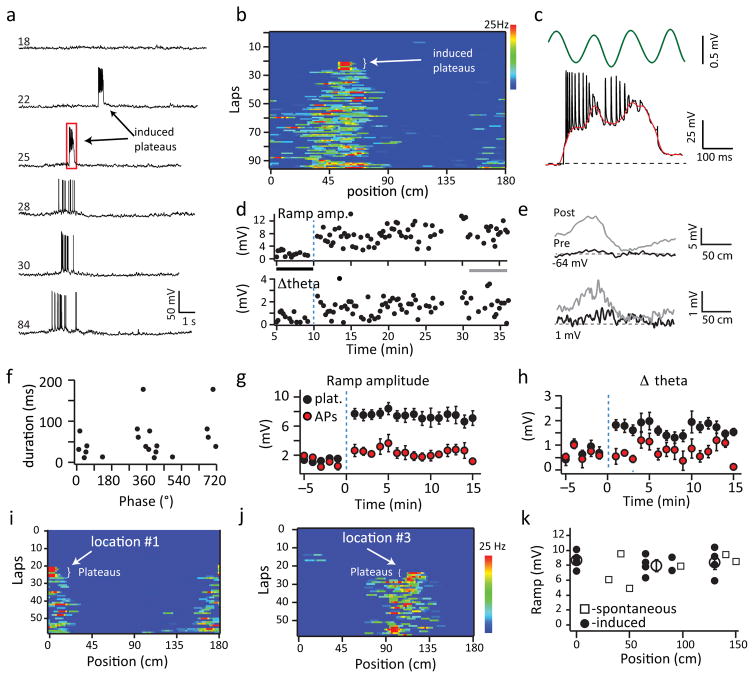
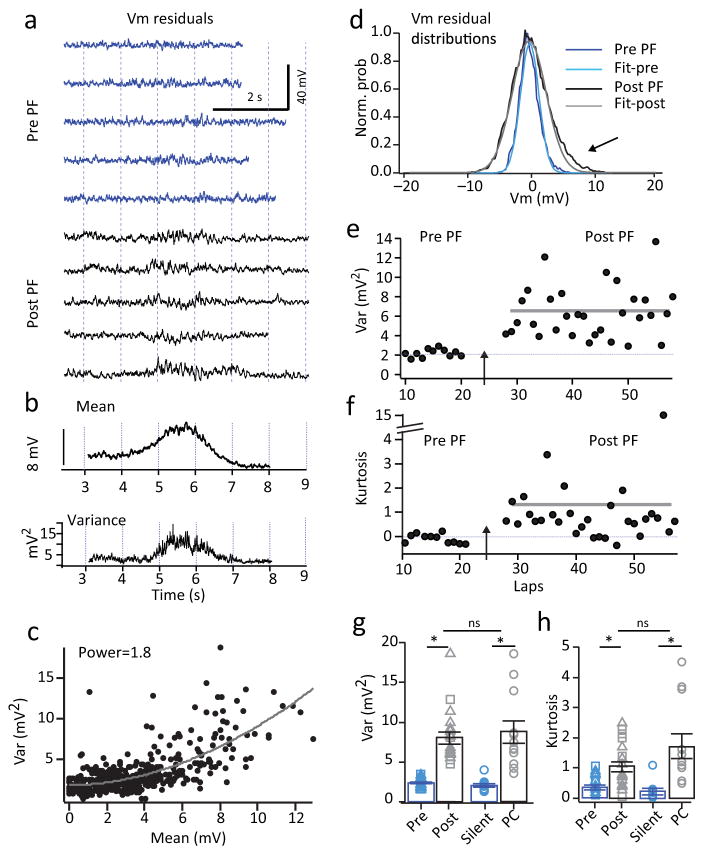
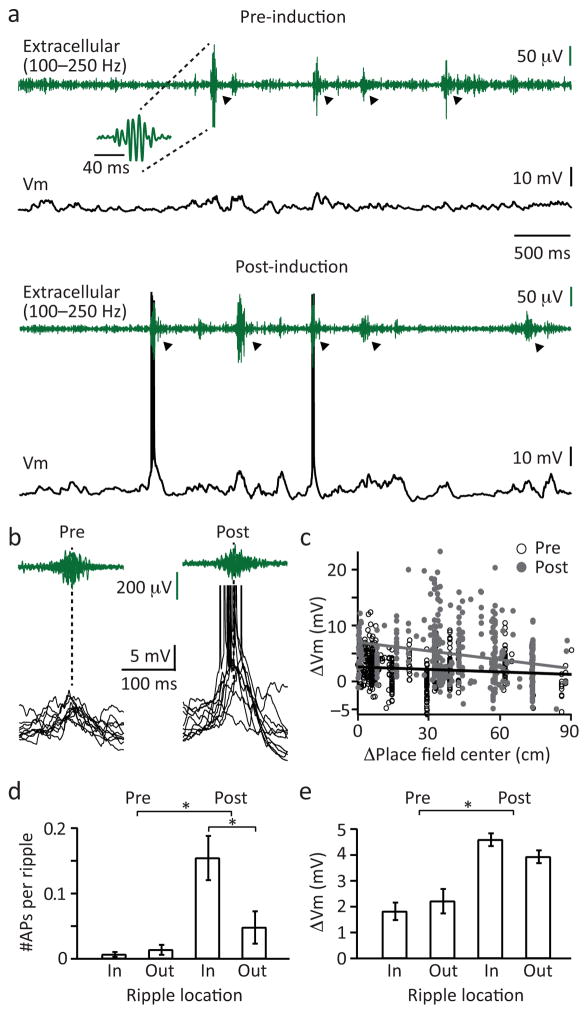
Feature-selective firing allows networks to produce representations of the external and internal environments. Despite its importance, the mechanisms generating neuronal feature selectivity are incompletely understood. In many cortical microcircuits the integration of two functionally distinct inputs occurs nonlinearly through generation of active dendritic signals that drive burst firing and robust plasticity. To examine the role of this processing in feature selectivity, we recorded CA1 pyramidal neuron membrane potential and local field potential in mice running on a linear treadmill. We found that dendritic plateau potentials were produced by an interaction between properly timed input from entorhinal cortex and hippocampal CA3. These conjunctive signals positively modulated the firing of previously established place fields and rapidly induced new place field formation to produce feature selectivity in CA1 that is a function of both entorhinal cortex and CA3 input. Such selectivity could allow mixed network level representations that support context-dependent spatial maps.


Figures

Figure 1
Figure 1. Intracellular recordings of CA1 place cell firing
a, Top: Schematic of recording set up (left) and confocal stack of a biocytin filled cell (right). b, Representative intracellular Vm (black) and extracellular theta (green) for laps 12–17 for a representative place cell (cell #3 in d). c, AP firing rate for all single laps as a function of distance for cell shown in b. d, Normalized firing rates of all place cells (N=22 from 21 mice) ordered by place field position. e, f, Representative extracellular theta (green), intracellular Vm (black), intracellular ramp (red) and thetain (blue) as a function of time for lap 12 (e) and lap 16 (f) for cell in b. g, Representative complex spikes (plateaus) from traces shown in e and f. Black lines indicate expanded regions. h, i, Amplitude (h) and duration (i) distributions for all plateaus (N=226 events from 22 neurons from 21 mice).
Figure 2
Figure 2. Phase relationship of plateau potentials
a, Schematic of timing for EC3 and CA3 inputs relative to extracellular theta. b, Normalized population AP (black; N=12894 events from 21 neurons from 20 mice) or plateau (grey; N= 223 events from 16 neurons from 20 mice) probability as a function of theta phase. Dotted green line is idealized sinusoid. Bin size is 10° (APs) or 36° (plateaus). c, Plateau probability (per 100APs; N=16 neurons from 20 mice) as a function of theta phase preference for each cell. Mean plateau probability shown. d, Plateau duration as a function of theta phase (N=223 events from 16 neurons from 20 mice). Grey line is sine function fit to durations <140 ms (single theta cycle). e, f, Representative intracellular Vm (red e, blue f), extracellular theta (green) and injected current (black) traces from a cell with intracellular current injected into the soma to produce AP spiking near the peak (e) or trough (f) of extracellular theta (see Supplementary Fig 6) g, h, Normalized population AP (g; N=2991 (red) and 2357 (blue) events from 6 neurons from 6 mice) or plateau (h; N=127 events (red) and 32 events (blue) from 6 neurons from 6 mice) probability as a function of theta phase for current injections shown in b. i, j, Average plateau probability (i) and normalized duration (j) for current injection shown in e and f. Individuals are shown colored and averages are black as mean+SEM (N=6), paired two-tailed t-test, peak vs trough, p=0.0289 (i, 4.1±1.2, 0.8±0.2), p=0.0026 (j, 183.2±41, 63.5±33.5).
Figure 3
Figure 3. EC3 inactivation reduces burst firing and plateau probability
a, Confocal stack of biocytin filled pyramidal cell (red) in an EC3xAi35D mouse. Scale bar: 50 μm. b, Intracellular Vm (black) and smoothed Vm (red) for two consecutive lap. Shaded region designates light on (yellow) or light off (grey) periods. Laser light duration ~3 seconds and laps were interleaved. c, d, e, Plateau duration (c; N=111 nolight events, n=25 light events from 8 neurons from 8 mice), subthreshold Vm (d; from cell in b), and inter-spike interval (e; N=3928 nolight events, 1293 light events from 8 neurons from 8 mice) distributions for light (yellow) and control (grey) periods. f, Frequency distribution for all cells for light (N=1293 events, yellow) and control (N=3928 events, grey) periods. Bin size is 140ms. g, h, i, Average plateau probability (g), plateau duration (h), and normalized plateau duration (i) for control (grey) and light (yellow) periods (N=8 neurons from 8 mice). Individuals are colored and averages are black as mean+SEM; p-values are indicated, two-tailed paired t-tests (g–i). j, Two-photon projection showing dual recording from a CA1 pyramidal neuron with Ca2+ imaging location (cyan line). Scale bar: 50 μm k, l, m, Somatic Vm (black), dendritic Vm (grey) and Ca2+ fluorescence (green) for 600pA current injection alone (k), current plus EC3 stimulation (l) or current plus CA3 stimulation (m) n, Fluorescence area for 300 pA (top) or 600 pA (bottom) current and stimulation as shown in k–m. Values are mean+SEM and p-values are indicated from two-tailed, paired t-tests of 6 neurons from 6 mice.
Figure 4
Figure 4. Plateaus drive burst firing output within place fields
a, AP firing rate for single laps as a function of distance for a representative cell. b, Mean intracellular ramp for all laps as a function of distance (red). Spatial locations of plateaus are indicated by blue dots. c, Spatial distribution of all plateaus in all neurons as a function of animal’s position. Place field (PF) centers were normalized within trials. p=1e−4 bootstrapped permutation test (N=226 events from 17 neurons; see methods) d, Normalized firing rate as a function of animal’s position aligned to place field centers for trials with (black) and without (grey) plateaus. e, Frequency distribution for all laps with (black) and without (grey) plateaus. Bin size is 140ms. f, Interspike interval (ISI) distribution for laps with (black) and without (grey) plateaus. For d–f, N=5645 APs, 78 laps with plateau, N=5754 APs, 141 laps without plateau, from 17 neurons. *- indicate bins where P-values from paired two-tailed T-tests for <0.05. The exact p-values for these bins are (from left to right) d, 0.034, 0.024, 0.041; e, 0.005, 0.044, 0.041, 0.032, 0.002; f, 0.042, 0.038, 0.043, 0.027, 0.040.
Figure 5
Figure 5. Place fields form after appearance of a large plateau potential
a, Representative intracellular Vm as a function of time for laps (numbers at left) before, during and after appearance of a spontaneous plateau. Red box indicates portion of trace shown in c. b, AP firing rate for single laps as a function of distance for representative cell from a. c, top, intracellular Vm from lap 8 on an expanded time base to show plateau characteristics. Red line is smoothed trace. Bottom, phase preference of plateaus for all place cells induced by a spontaneous plateau (N=6 cells from 6 mice). Grey line is fit by sine. d, Mean intracellular ramp amplitude (top) and Δtheta (bottom) as a function of time for cell in a. The traces at right are averages across laps within the time window indicated by the grey or black bar on left plot to show the average ramp and theta for laps before and after plateau. e, Plateau duration as a function of phase for all place cells induced by a spontaneous plateau. f, g, Average intracellular ramp amplitude (f) and Δtheta (g) for all place cells induced by a spontaneous plateau as a function of time. Data are shown as mean+SEM, see methods for number of neurons in each data point.
Figure 6
Figure 6. Plateaus are sufficient to drive novel place field formation
a, Representative intracellular Vm as a function of time for laps (numbers at left) before, during and after plateau induction. b, AP firing rate for single laps as a function of distance for cell from a. Arrow indicates current injection locations c, Intracellular Vm (black), and extracellular theta (green) expanded from box in a. Red line is smoothed trace. d, Mean intracellular ramp amplitude (top) and Δtheta (bottom) as a function of time for cell in a. e, Average intracellular ramp (top) and theta (bottom) as a function of position for laps indicated by grey or black bars in d. f, Plateau duration as a function of theta phase. g, h, Average intracellular ramp amplitude (g) and Δtheta (h) for cells with plateau (black) or AP (red) inducing current injections as a function of time. Data are shown as mean+SEM, see methods for number of neurons in each data point. i, j AP firing rate for single laps as a function of distance for a place field induced at location 1, and location 3 as indicated on the figure. k, Average ramp amplitude after place field induction for all place cells induced with current injection (black circles), and spontaneous plateaus (open squares) as a function of track position. Averages across cells at the 3 positions are shown as large open circles (mean ± SEM).
Figure 7
Figure 7. Vm variance suggests input amplitude potentiation
a, Representative intracellular Vm residuals (Vm–mean Vm) for several laps before (blue) and after (black) place field induction (data from cell shown in fig 6b). b, Mean Vm and variance for cell shown in a. c, Variance as a function of mean for cell in a. Line is fit of data by power function, y=mpx+b where p=1.8. d, Normalized residual probability distribution before place field induction (blue) and after (black) for cell in a. Lighter colored lines are Gaussian fits. e, f, Variance (e) and kurtosis (f) as a function of lap to display the change after place field induction. g, Average variance and h, excess kurtosis either before (blue, pre) or after (black, post) place field induction by spontaneous (squares, N=6 cell from 6 mice) or induced plateau (triangles, N=13 cell from 13 mice) or for silent cells (blue, silent, N=10 cell from 10 mice) and place cells (black, pc, N=12 cell from 12 mice). * indicates p=8.5e−9 pre vs post variance and p=3.2e−5 pre vs post kurtosis; paired two-tailed t-tests; p=4.87e−7, place cells vs silent cells variance and p=1.2e−3 place cells vs silent cells kurtosis; unpaired two-tailed t-tests.
Figure 8
Figure 8. Ripple-associated Vm depolarization and AP output are increased following induction
a, Extracellular ripple (LFP filtered between 100 and 250 Hz) and intracellular Vm recording before (top) and after (bottom) place field induction in a CA1 pyramidal neuron. Shown is a time period during which the animal was stationary. Arrowheads indicate ripples that were detected by our algorithm (see Material & Methods). b, Enlarged view of 10 consecutive ripples and corresponding Vm. Note the increased Vm depolarization and the increased AP probability during ripples after place field induction. c, Relationships between the ripple-associated subthreshold Vm changes (ΔVm) and the locations of the ripple relative to the place field center (at 0) before (black open circles) and after (grey filled circles) place field formation. Data is taken from the cell shown in a. Each circle represents one ripple (pre: N=230 ripples, post: N=340 ripples); the lines show the linear fits. Ripple locations before and after the place field center were pooled together. d, Number of APs per ripple for events inside and outside the neuron’s place field. (mean±SEM, N=16 neurons, two-tailed unpaired t-test, pre vs post p=4.0e−4, post-inside vs-post-outside p=0.017). e, ΔVm for ripples inside and outside the neuron’s place field (mean±SEM, N=16 neurons, unpaired two-tailed t-test, pre vs post p=1.0e−4).

Comment in

  • The binding solution?
    Sheffield ME, Dombeck DA. Sheffield ME, et al. Nat Neurosci. 2015 Aug;18(8):1060-2. doi: 10.1038/nn.4075. Nat Neurosci. 2015. PMID: 26216459 No abstract available.

Similar articles

Cited by

References

    1. Shepherd GM. The Synaptic Organization of the Brain. 5. Oxford University Press; New York: 2004.
    1. Steward O, Scoville SA. Cells of origin of entorhinal cortical afferents to the hippocampus and fascia dentata of the rat. J Comp Neurol. 1976;169:347–370. - PubMed
    1. Megias M, Emri Z, Freund TF, Gulyas AI. Total number and distribution of inhibitory and excitatory synapses on hippocampal CA1 pyramidal cells. Neuroscience. 2001;102:527–540. - PubMed
    1. Cauller LJ, Clancy B, Connors BW. Backward cortical projections to primary somatosensory cortex in rats extend long horizontal axons in layer I. J Comp Neurol. 1998;390:297–310. - PubMed
    1. Petreanu L, Mao T, Sternson SM, Svoboda K. The subcellular organization of neocortical excitatory connections. Nature. 2009;457:1142–1145. - PMC - PubMed

Publication types

MeSH terms