. 2015 Jul 13;10(7):e0132464.
doi: 10.1371/journal.pone.0132464. eCollection 2015.

Do Global Cities Enable Global Views? Using Twitter to Quantify the Level of Geographical Awareness of U.S. Cities

Affiliations

Do Global Cities Enable Global Views? Using Twitter to Quantify the Level of Geographical Awareness of U.S. Cities

Su Yeon Han et al. PLoS One. .

Abstract

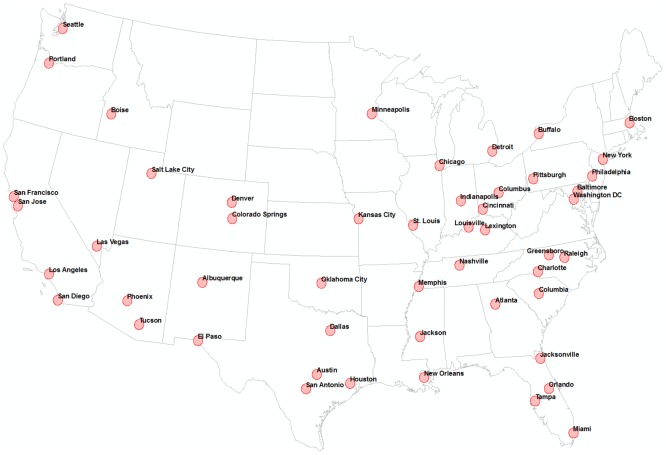
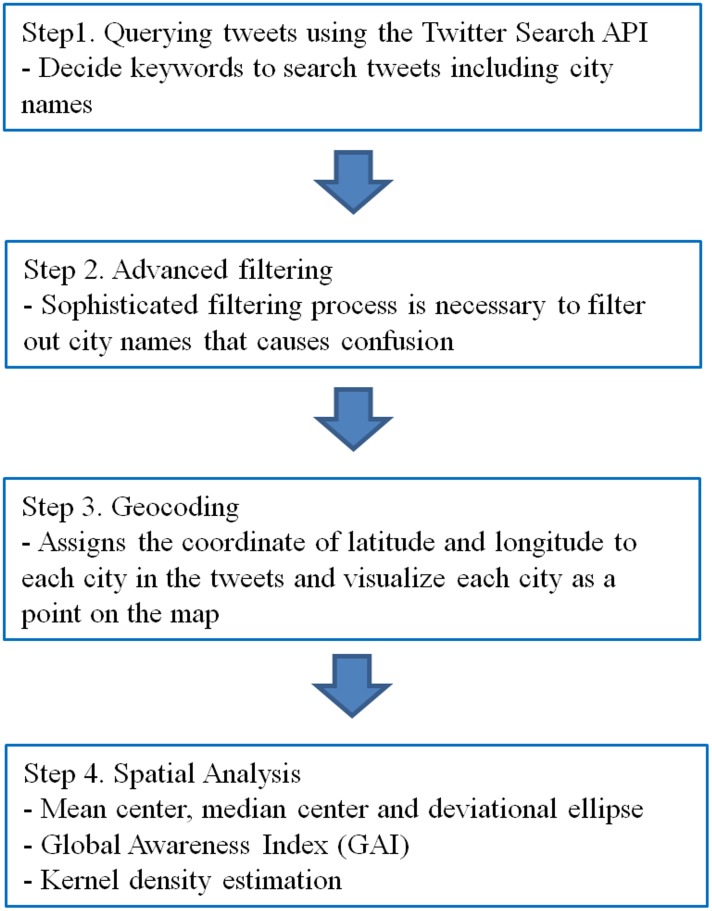
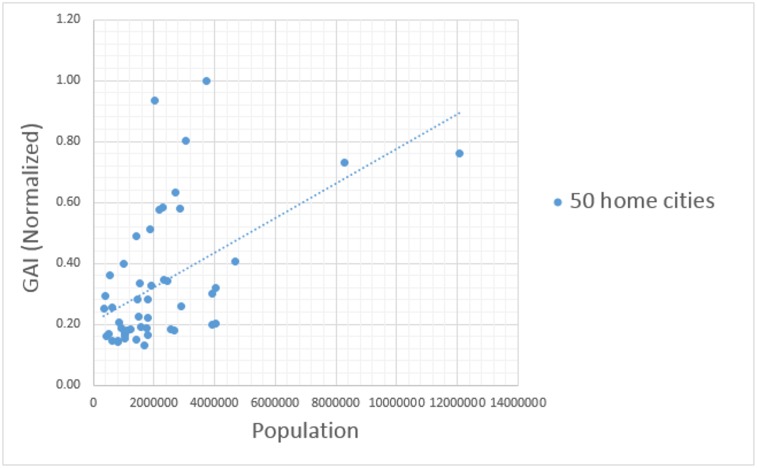
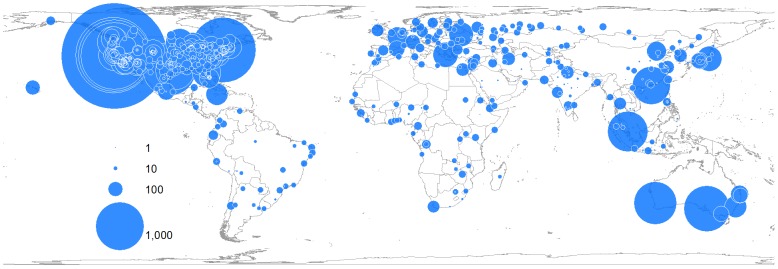
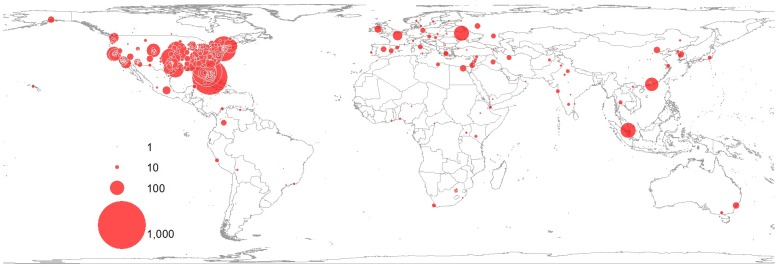
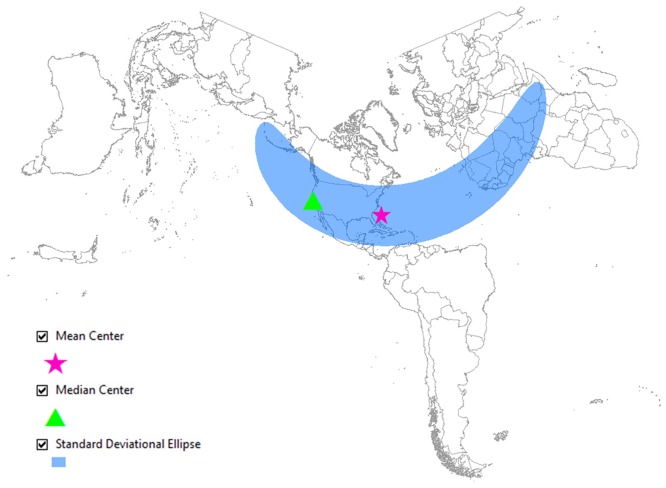
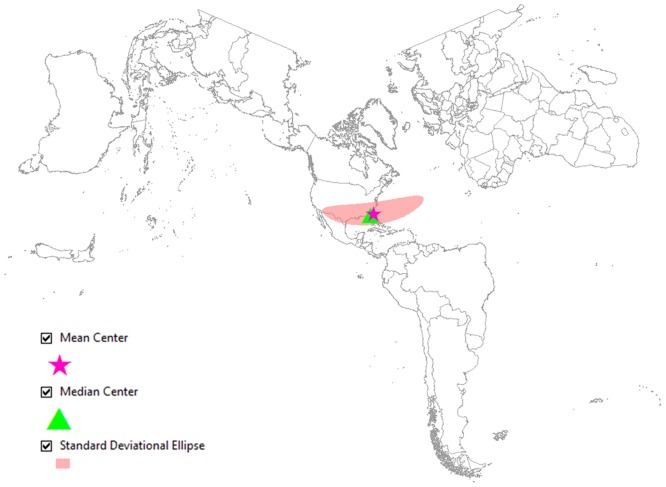
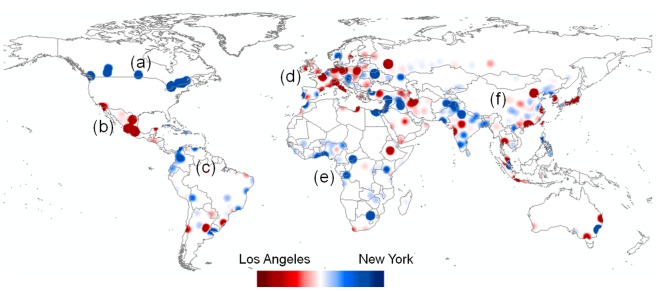
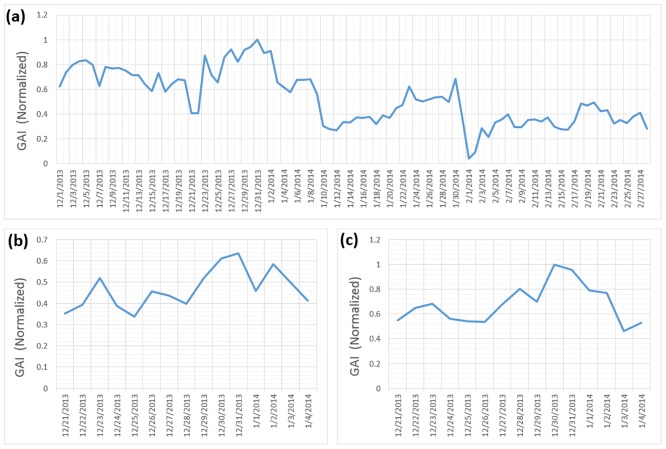
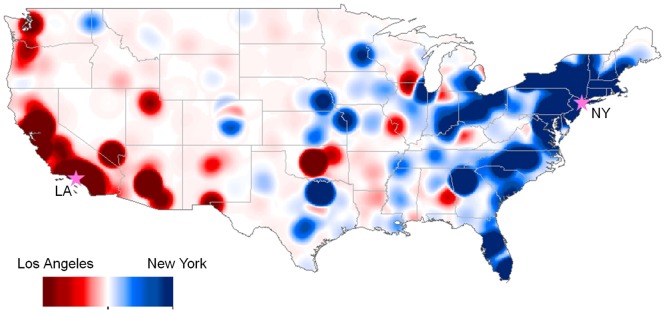
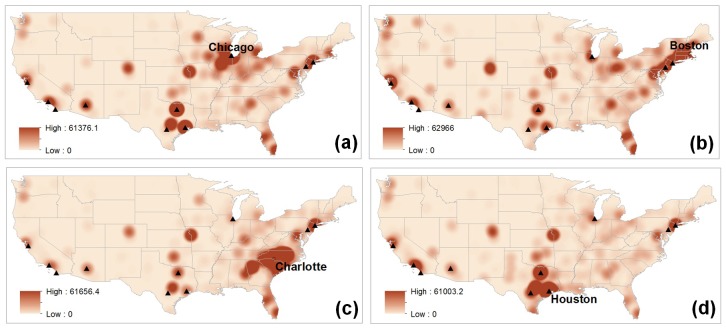
Dynamic social media content, such as Twitter messages, can be used to examine individuals' beliefs and perceptions. By analyzing Twitter messages, this study examines how Twitter users exchanged and recognized toponyms (city names) for different cities in the United States. The frequency and variety of city names found in their online conversations were used to identify the unique spatiotemporal patterns of "geographical awareness" for Twitter users. A new analytic method, Knowledge Discovery in Cyberspace for Geographical Awareness (KDCGA), is introduced to help identify the dynamic spatiotemporal patterns of geographic awareness among social media conversations. Twitter data were collected across 50 U.S. cities. Thousands of city names around the world were extracted from a large volume of Twitter messages (over 5 million tweets) by using the Twitter Application Programming Interface (APIs) and Python language computer programs. The percentages of distant city names (cities located in distant states or other countries far away from the locations of Twitter users) were used to estimate the level of global geographical awareness for Twitter users in each U.S. city. A Global awareness index (GAI) was developed to quantify the level of geographical awareness of Twitter users from within the same city. Our findings are that: (1) the level of geographical awareness varies depending on when and where Twitter messages are posted, yet Twitter users from big cities are more aware of the names of international cities or distant US cities than users from mid-size cities; (2) Twitter users have an increased awareness of other city names far away from their home city during holiday seasons; and (3) Twitter users are more aware of nearby city names than distant city names, and more aware of big city names rather than small city names.


Conflict of interest statement

Competing Interests: The authors have declared that no competing interests exist.

Figures

Fig 1
Fig 1. Home cities.
Tweets were collected within a 20 mile buffer from each center of the 50 major U.S. cities.
Fig 2
Fig 2. Four steps of knowledge discovery in cyberspace for geographical awareness (KDCGA).
The first and second steps select tweets containing the city names. The third step is to locate and visualize the tweets on the map. The fourth step is to reveal spatiotemporal patterns by using spatial statistical methods.
Fig 3
Fig 3. The relationship between population size and global awareness index (GAI).
There is a weak positive relationship (Pearson correlation coefficient (r = 0.52) between the population within a 20 mile buffer of each of the 50 cities in Fig 1 and the level of geographical awareness of Twitter users in their respective city (S1 Table).
Fig 4
Fig 4. Geographical awareness of Twitter users in San Jose, CA.
The size of the circle is proportional to the number of city names mentioned in tweets. Twitter users in San Jose, CA mentioned city names 53,625 times from Dec 2013 to Feb 2014. Among them, the users mentioned San Jose 14,272 times, which is 27% of all the city names mentioned in the tweets. The city name, San Jose, was excluded in this map. The top three most mentioned city names were San Jose, CA, Sunnyvale, CA and San Francisco, CA. This map was created using tweets collected from San Jose, CA during the collection of dataset 1 in Table 1(S2 Table).
Fig 5
Fig 5. Geographical awareness of Twitter users in Jacksonville, FL.
The size of the circle is proportional to the number of city names mentioned in tweets. Twitter users in Jacksonville, FL mentioned city names 40,039 times from Dec 2013 to Feb 2014. Among them, the users mentioned Jacksonville 33,617 times, which is 84% of the entire city names mentioned in the tweets. The city name, Jacksonville, was excluded in this map. The top three most mentioned city names are Jacksonville, FL, Miami, FL, and Orlando, FL. This map was created using tweets collected from Jacksonville, FL during the collection of dataset 1 in Table 1 (S3 Table).
Fig 6
Fig 6. Twitter users with national and international levels of awareness from San Jose, CA.
The map shows the central tendency, dispersion and directional trends of the tweets mapped in Fig 4. The widely stretched ellipse shows that the users are well aware of cities belonging to faraway states and international cities. Map projection: Lambert Conformal Conic. (S2 Table)
Fig 7
Fig 7. Twitter users with regional and local levels of awareness from Jacksonville, FL.
The map shows the central tendency, dispersion and directional trends of the tweets mapped in Fig 5. The narrow ellipse shows that the users are more aware of regional and local cities rather than international cities. Map projection: Lambert Conformal Conic. (S3 Table)
Fig 8
Fig 8. The awareness of global cities between Twitter users in New York (NY) versus Los Angeles (LA).
The geographical awareness of each group was estimated based on the names of international cities mentioned in their tweets. The map shows the difference in the distributional patterns of the geographical awareness between the two groups. The users in LA are more aware of the red regions than those in NY. The users in NY are more aware of the blue regions than those in LA. This map was created by using tweets collected from LA and NY during the collection of dataset 1 in Table 1 (S4 and S5 Tables). Tweets inside the U.S. are excluded to map.
Fig 9
Fig 9. The temporal change of global awareness index (GAI) of Twitter users inU.S.
(a) shows the temporal change of the level of geographical awareness of Twitter uesers living in all 50 home cities (Fig 1) from December 2013 to February 2014. The temporal change of the level of geographical awareness is also examined at the city level, in New York City (b) and in Houston, TX (c) around the last week of December. The geographical awareness of the Twitter users was highest in late December 2013.
Fig 10
Fig 10. The awareness of U.S. cities between Twitter users in New York (NY) versus Los Angeles (LA).
The geographical awareness of each group was estimated based on the names of U.S. cities mentioned in their tweets. The map shows the difference in the distributional patterns of the geographical awareness between the two groups. The users in LA are more aware of the red regions (mostly the western U.S.) than those in NY. The users in NY are more aware of the blue regions (mostly the eastern U.S.) than those in LA. This map was created by using tweets collected from LA and NY during the collection of dataset 2 in Table 1 (S6 and S7 Tables).
Fig 11
Fig 11. Geographical awareness of Twitter users in Chicago (a), Boston (b), Charlotte (c), and Houston (d).
Twitter users are highly aware of hotspots (represented by high intensity), and rarely aware of the regions represented by low intensity. The black triangles represent the top 10 most populated cities. These maps are created using tweets collected from Chicago, Boston, Charlotte and Houston during the collection of dataset 2 in Table 1 (S8, S9, S10 and S11 Tables).

References

    1. Ghosh D, Guha R. What are we ‘tweeting’about obesity? Mapping tweets with topic modeling and Geographic Information System. Cartography and Geographic Information Science. 2013;40(2):90–102. - PMC - PubMed
    1. Li L, Goodchild MF, Xu B. Spatial, temporal, and socioeconomic patterns in the use of Twitter and Flickr. Cartography and Geographic Information Science. 2013;40(2):61–77.
    1. Mislove A, Lehmann S, Ahn Y-Y, Onnela J-P, Rosenquist JN. Understanding the Demographics of Twitter Users. ICWSM. 2011;11:5th.
    1. Tsou M-H, Yang J-A, Lusher D, Han S, Spitzberg B, Gawron JM, et al. Mapping social activities and concepts with social media (Twitter) and web search engines (Yahoo and Bing): a case study in 2012 US Presidential Election. Cartography and Geographic Information Science. 2013;40(4):337–48.
    1. MacEachren AM, Robinson AC, Jaiswal A, Pezanowski S, Savelyev A, Blanford J, et al., editors. Geo-twitter analytics: Applications in crisis management. 25th International Cartographic Conference; 2011.

Publication types